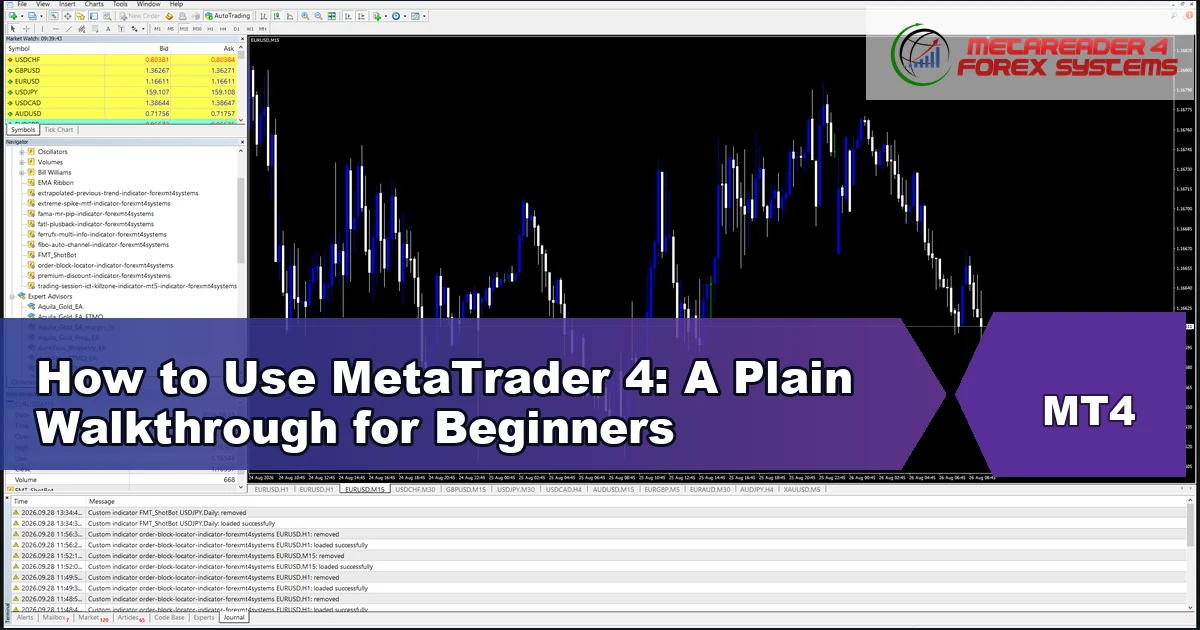
How to use MetaTrader 4 comes down to four panels, one menu and a handful of shortcuts. This walkthrough settles which window does what, how to add an indicator, and …
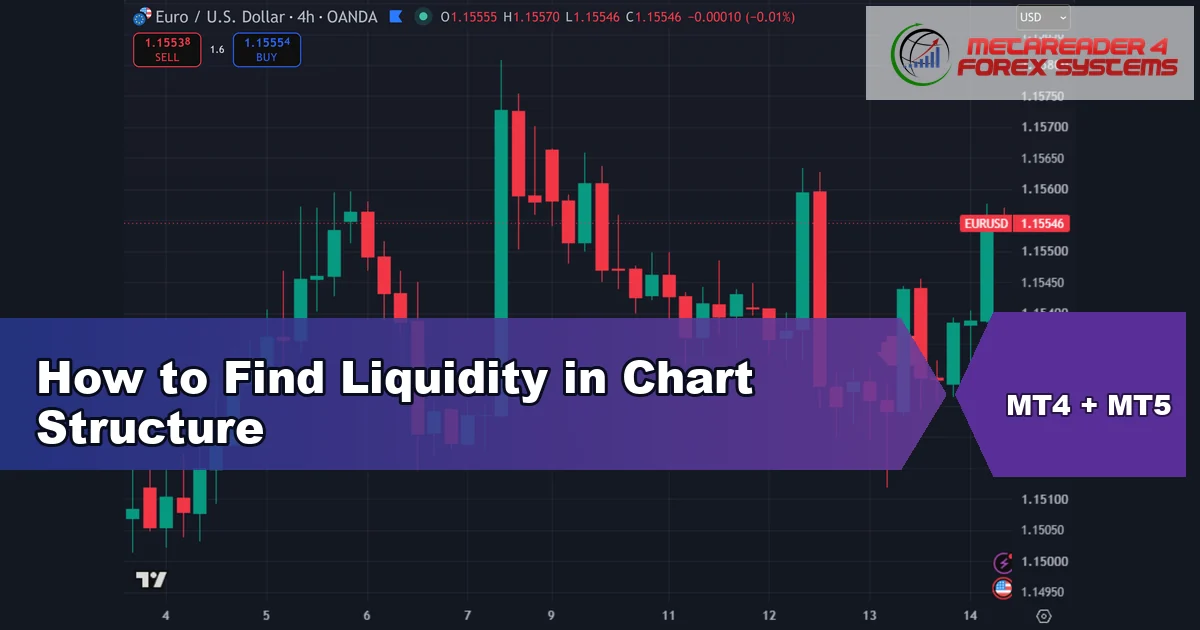
Learning how to find liquidity in chart structure means identifying where stop orders are most likely to sit. Those clusters attract price, because filling large orders requires someone on the …
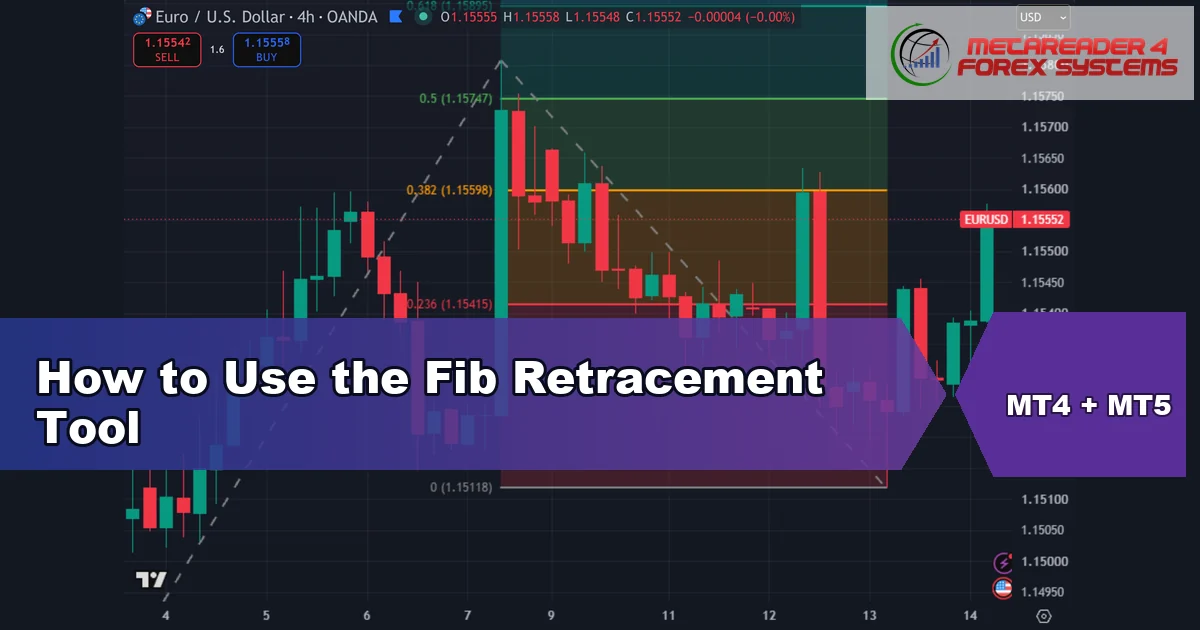
Learning how to use the Fib retracement tool is mostly about the two anchor points. The tool itself does one thing: it divides a move you select into percentage bands. …
Understanding how does leveraging work in forex comes down to separating two ideas most traders blur together. Leverage decides how much of your balance a position ties up. Position size …
Here is the honest answer up front. You cannot load the custom indicators MT4 mobile traders keep searching for. The mobile apps do not support them. The MT4 and MT5 …
A parabolic chart can mean two different things, so this guide covers both. Traders use the word for a price move that speeds up until it looks almost vertical. They …
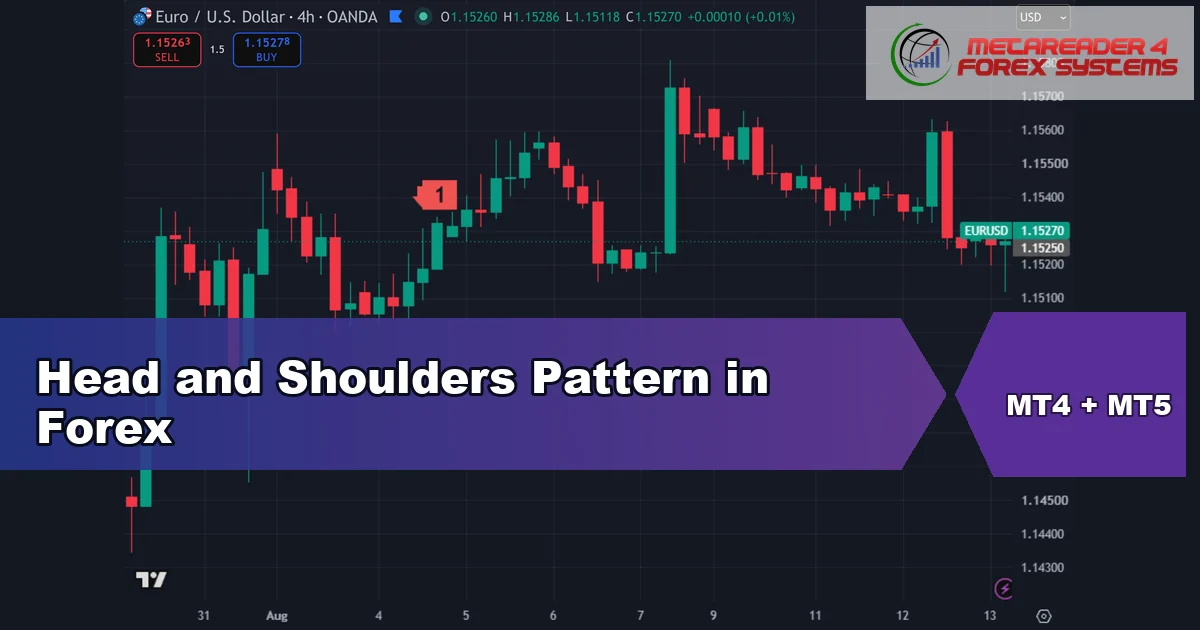
The head and shoulders pattern is a three-peak reversal formation that warns an uptrend may be ending. The first peak is the left shoulder. A taller peak forms the head. …
A breaker block is an order block that failed. Price traded back through the zone that was supposed to hold, so the traders who bought or sold there are now …
ICT times are the narrow session windows that Inner Circle Trader followers call kill zones. The idea is simple: volatility and volume cluster around session opens, so most of the …
SMC trading, short for Smart Money Concepts, reads a price chart as a record of where large institutional orders were filled. Rather than asking an indicator for a buy signal, …
Forex pair volatility is simply how far a pair tends to travel in a given period, usually measured in pips or by ATR. Some pairs drift. Others swing hard. That …
A pivot point calculator turns one session’s high, low and close into support and resistance levels for the next session. The maths is plain arithmetic, and you can run it …
An inverse FVG is a fair value gap that price has traded straight through instead of respecting. When that happens the zone flips polarity: a bullish gap that fails becomes …
A compound interest calculator forex traders use runs one formula: A = P(1 + r)n. Start with the honest part, because it decides how much the output is worth. Trading …
Market liquidity describes how easily you can buy or sell a given size without pushing the price against yourself. Deep liquidity means your order fills close to the price you …
A forex position sizing calculator answers one question: how many lots can I trade without risking more than I intended? It takes four inputs: your account balance, the percentage you …
A forex pips calculator turns a price move into money. You give it the pair, the lot size and your account currency, and it hands back the cash value of …
When does the forex market open? Trading begins at the Sydney open on Sunday evening, around 21:00–22:00 GMT, and runs without a break until the New York close on Friday …
In trading, a liquidity trap is a false move that lures traders onto the wrong side of the market before reversing against them. Price breaks a level, everyone piles in, …
A liquidity sweep happens when price pushes just beyond an obvious high or low, triggers the stop orders resting there, and then reverses back into the range it came from. …
A bullish divergence happens when price makes a lower low but the oscillator underneath makes a higher low. In plain terms, the market printed a fresh low without the selling …
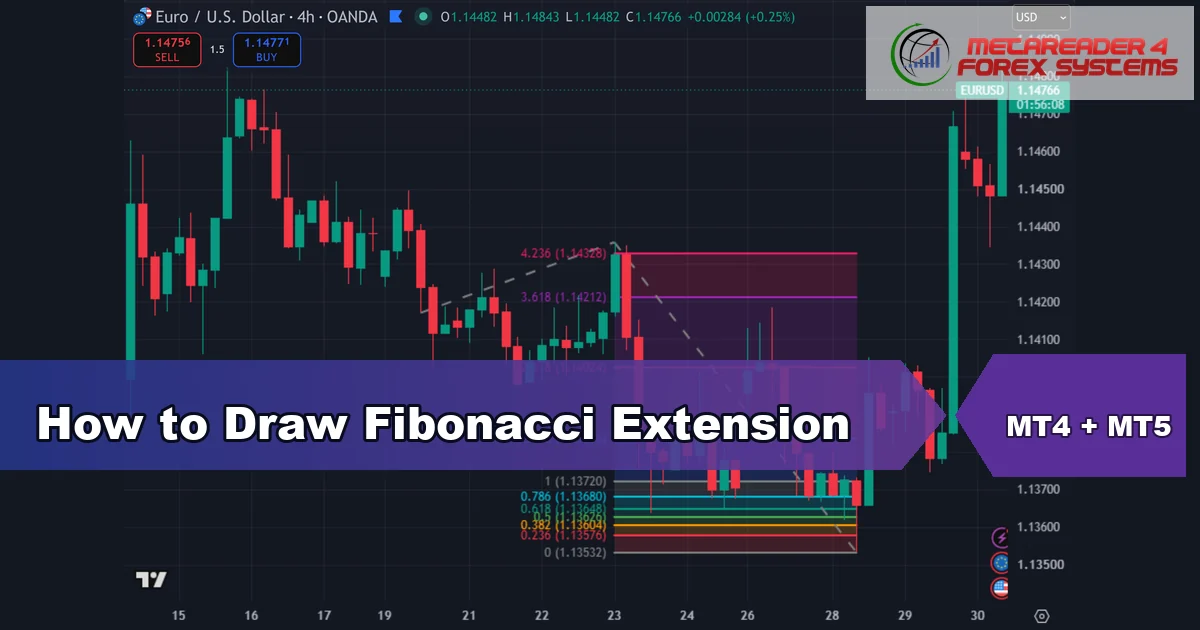
To draw a Fibonacci extension, you plot three points in order: the swing low, the swing high, then the retracement pullback. The tool projects profit targets beyond that move, at …
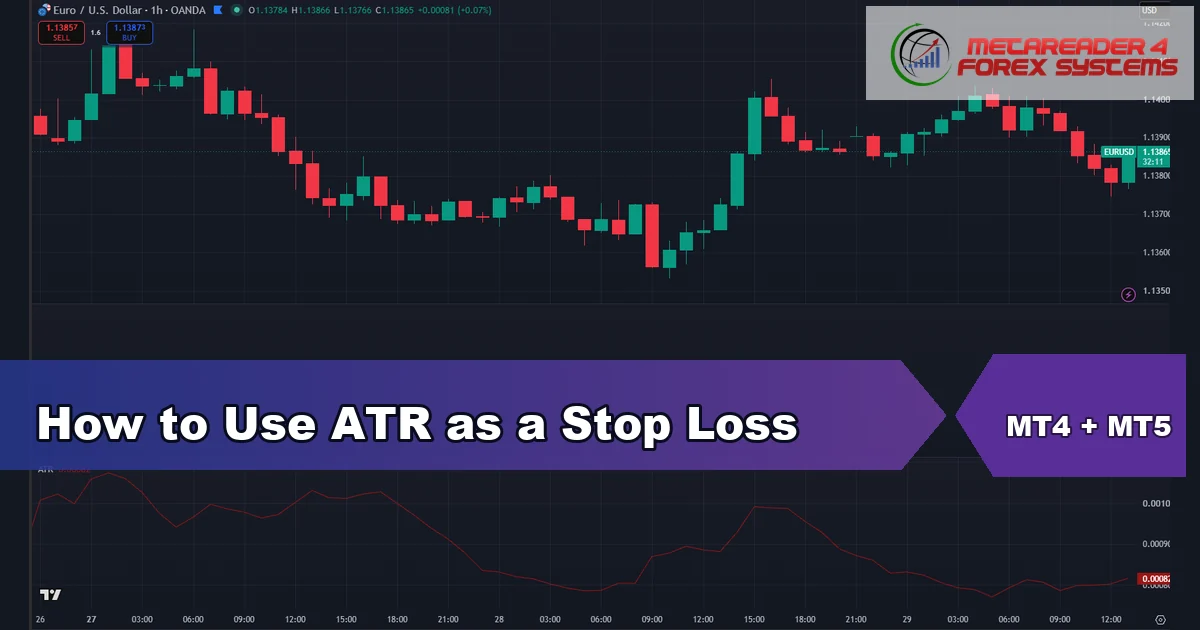
An ATR stop loss places your stop a set multiple of the Average True Range away from your entry, so the distance adapts to how much a pair actually moves. …
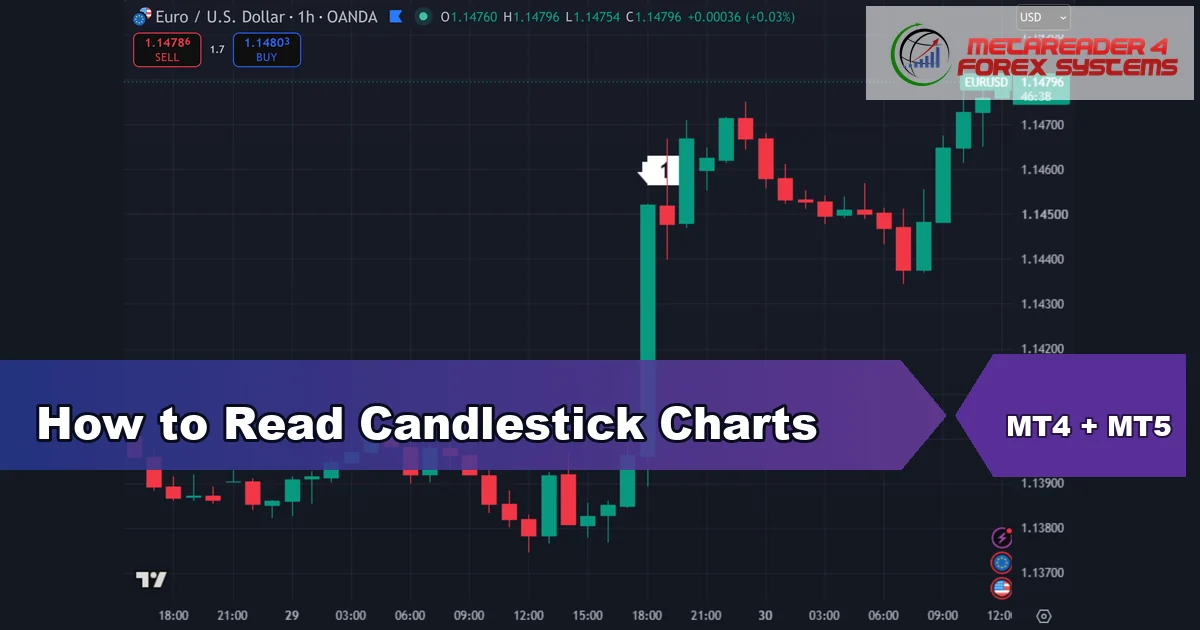
To read a candlestick chart, focus on four prices in every candle: the open, the high, the low and the close. The thick body shows where price opened and closed. …