
A parabolic chart can mean two different things, so this guide covers both. Traders use the word for a price move that speeds up until it looks almost vertical. They also use it for the Parabolic SAR, the dotted indicator built into MT4, MT5 and TradingView. The first half shows you how to read a parabolic price move, why it happens, and why chasing one late is dangerous. After that comes the Parabolic SAR indicator, its two settings, and the jobs it genuinely does well.
Part 1: what a parabolic chart move looks like

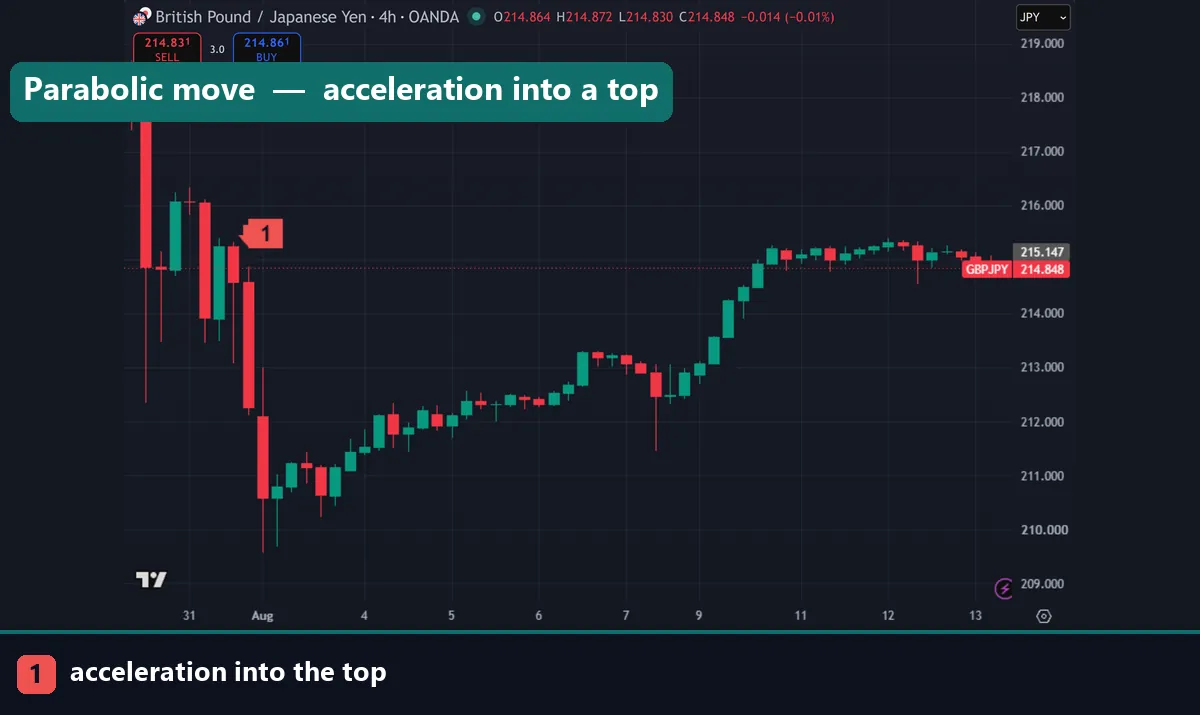
A parabolic move is an advance that accelerates. Early on, price rises in ordinary steps with healthy pullbacks. Then the slope steepens. Each pullback gets shallower than the one before it, and the pauses between higher highs get shorter. Finally the candles stack almost vertically, with long bodies and thin wicks. Sketch the path and it curves upward like the arm of a parabola, which is where the name comes from.
Three clues mark the late stage. First, candle ranges expand while pullbacks nearly vanish. Second, the gap between price and a 20-period moving average grows unusually wide. Third, the move reaches the news, and by then most of the crowd has already bought. Reading the candles helps too, so our guide on how to read candlestick charts covers the exhaustion patterns that appear near tops.
Why parabolic moves happen
Momentum chasing does most of the work. A market breaks out, early buyers show a profit, and other traders notice. Many of them buy because price is rising, not because anything changed underneath. So buying creates more buying.
Short covering adds the fuel. Traders who sold into the early rally now sit on growing losses. Their stops trigger, and every one of those stops is a buy order. That forced buying lifts price again, which reaches the next layer of stops. Notice that none of this needs fresh information. The move feeds on positioning alone, which is why it cannot last.
Why parabolic moves end so abruptly
A parabolic advance needs a steady supply of new buyers. That supply is finite. Once the last hesitant buyer has committed, nobody is left to lift the offer, and price stalls without any obvious trigger.
Then the chain runs in reverse. Late buyers hold thin cushions, so a small dip puts them underwater straight away. They exit, the dip deepens, and the next group follows. Because the advance left almost no consolidation zones behind, little structure remains to slow the fall. Retracements are often deep and fast, and much of the move can unwind in a fraction of the time it took to build.
The practical lesson is short. Chasing a parabolic chart late hands you a poor entry and forces your stop far away. Your risk grows at the exact moment the move is most fragile. Waiting costs nothing, while a bad entry costs a lot. Sizing against real volatility helps, and our guide on using ATR as a stop loss covers the arithmetic.
Part 2: the Parabolic SAR indicator
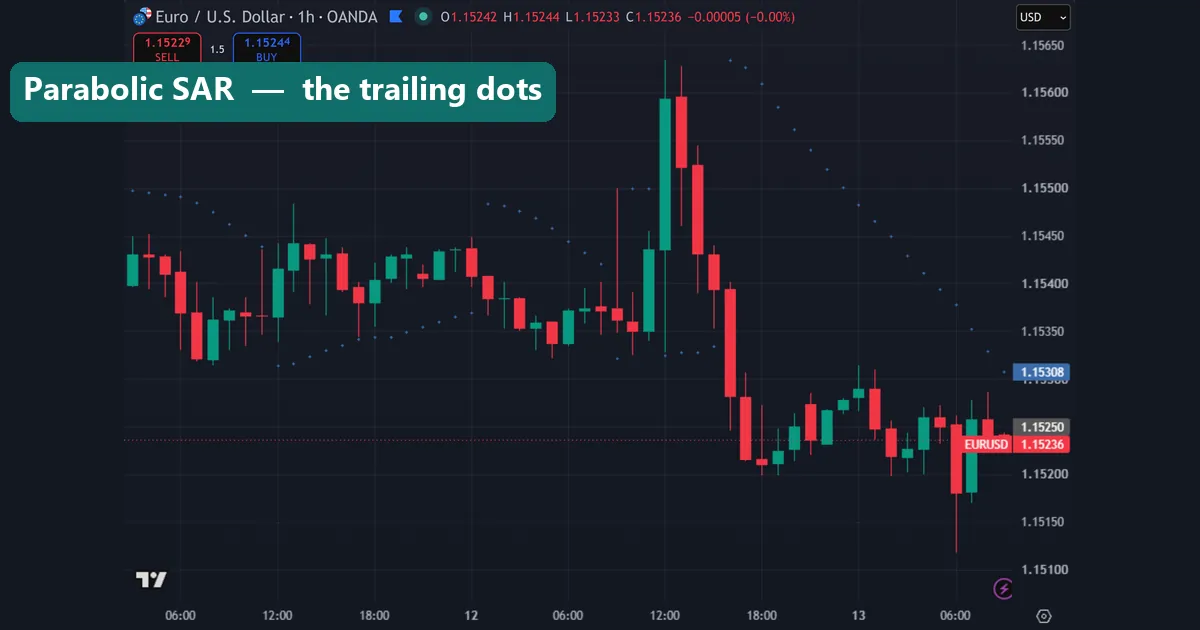
SAR stands for stop and reverse. J. Welles Wilder Jr. published it in 1978, in the same book that introduced RSI and ATR. On the chart it draws a string of dots. Dots below the candles mean the indicator reads the trend as up. Dots above the candles mean it reads the trend as down.
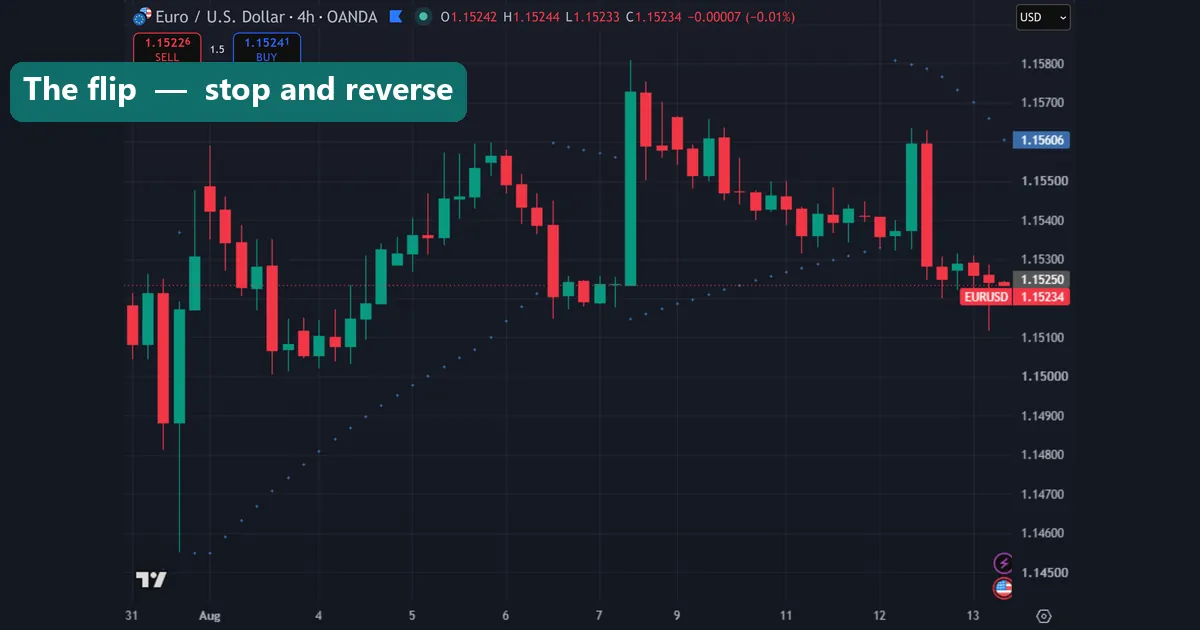
The dots trail price and tighten as the move extends. Each time the trend prints a new extreme, the calculation speeds up, so the next dot sits closer to price. Eventually price crosses the dots. The indicator then flips: the dots jump to the other side of the candles and trail in the new direction. That flip is the “reverse” in stop and reverse, and it is the only signal the tool produces.
Parabolic SAR settings: step and maximum
MetaTrader exposes two inputs. Step defaults to 0.02 and Maximum defaults to 0.2. TradingView labels them Start, Increment and Max value, with the same numbers behind them.
Step is the acceleration factor. It controls how much closer the dots move each time the trend makes a new extreme. Raise it to 0.03 or 0.05 and the dots tighten quickly, so flips arrive sooner and far more often. Drop it to 0.01 and the dots hang back, giving the trend more room but reacting later.
Maximum caps that acceleration. At 0.2 the dots can only tighten so fast, however long the trend runs. Lift the cap and long trends get cut short; lower it and the dots trail loosely. Most traders leave both defaults alone and change timeframe instead, since a higher timeframe already slows the flips.
The two jobs Parabolic SAR does well
Trailing stop comes first, and Wilder designed the tool for exactly that. Enter a long trade, then move your stop to the dot below price as each bar closes. The stop only ever moves in your favour. As the trend accelerates the dots tighten, so a strong run locks in more of the move. Use closed-bar values only, since the live dot can still shift.
Trend direction filter comes second. Read the dots on a higher timeframe, then take trades in that direction only. For example, dots below price on H4 means you look for long entries on M15 and skip the short signals. That one filter removes a lot of counter-trend trading. Pair it with a momentum tool, and our notes on the best RSI indicator settings show sensible pairings.
Parabolic chart and Parabolic SAR at a glance
| Item | What it is | What it does | Best use or warning |
|---|---|---|---|
| Parabolic move, early stage | Steepening trend, shallower pullbacks | Trend still has structure to trade | Enter on pullbacks, not on breakouts |
| Parabolic move, late stage | Near-vertical candles, no pauses | Risk per trade balloons | Avoid chasing; stops sit far away |
| SAR step 0.02 | Default acceleration factor | Balanced trailing speed | Leave it here for most pairs |
| SAR step 0.05 | Faster acceleration | Dots tighten quickly, more flips | Short intraday trends only |
| SAR maximum 0.2 | Cap on acceleration | Limits how tight the trail becomes | Lower it to hold long trends |
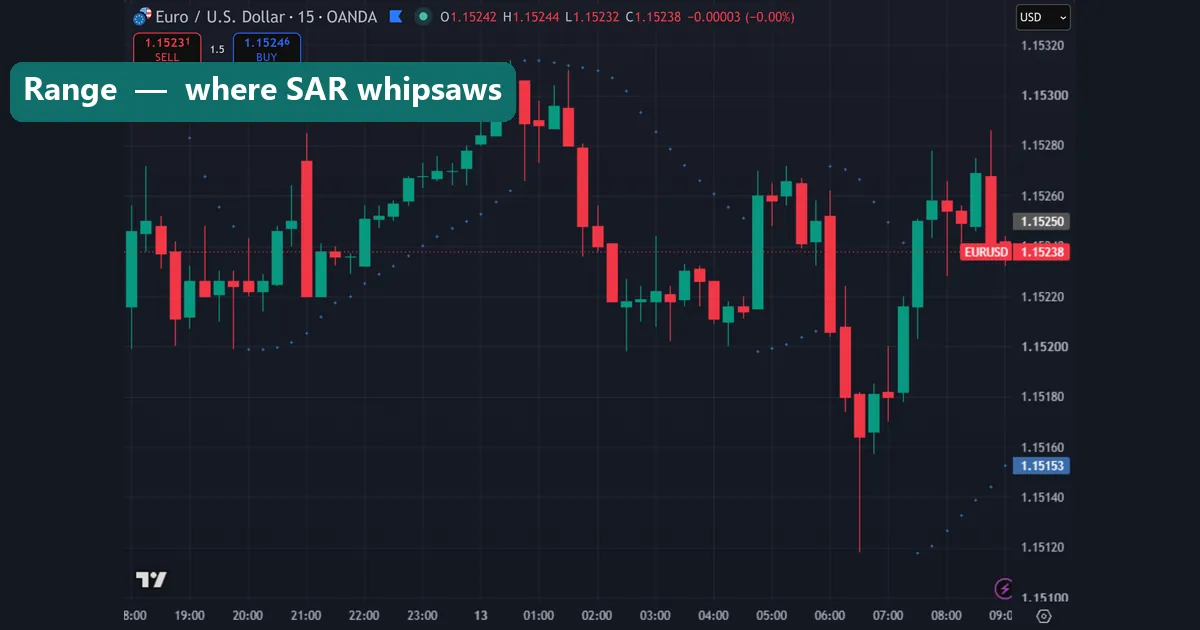
| SAR in a range | Dots flip above and below repeatedly | Whipsaw after whipsaw | Switch it off in sideways markets |
Treat every row as a starting point. Test the numbers on the pair and timeframe you actually trade before you rely on them.
Download the complete indicator database
Put these concepts on your charts. One email unlocks the full library of 1,380+ indicators with compiled MT4 and MT5 files, plus my TradingView scripts. No paywall, no spam, unsubscribe any time.
Get free access to my indicator database
One email unlocks 1,380+ free MT4, MT5 and TradingView indicators — the complete library. No single-tool download; you get the whole database.
Honest limitations
Start with the price move. A parabolic advance cannot be timed. No indicator or pattern marks the exact top, because the top depends on when buyers run out rather than on a measurable level. Anyone selling a precise reversal signal for parabolic moves is selling hindsight.
The indicator has a clear weakness too. Parabolic SAR whipsaws badly in ranging markets. Price drifts sideways, the dots flip above, then below, then above again, and each flip looks like a signal. On a quiet M15 chart you can collect a dozen flips in an afternoon. Checking conditions first helps, so read our guide on forex pair volatility before you trust any trailing tool.
One more point matters. Parabolic SAR is a trailing tool, not an entry signal. The flip tells you the previous swing has ended, which is useful for exits and for direction. It says nothing about where the next move is going. Traders who take every flip as an entry end up trading noise.
Common mistakes
Four errors show up again and again. The first is buying a parabolic chart because it looks strong; strength and safety are opposites at that stage. Another is trading SAR flips alone, with no trend context behind them. A third is raising the step after a few missed moves, which only multiplies flips. The last is moving a stop backwards. SAR trails one way by design, so dragging your stop away from price to survive a dip defeats the method.
Where to find Parabolic SAR on MT4, MT5 and TradingView
Parabolic SAR ships with every platform, so you never need to download it. In MT4 and MT5, open Insert, choose Indicators, then Trend, then Parabolic SAR, and set Step and Maximum in the dialog. On TradingView, open the Indicators panel, search for Parabolic SAR, then edit Start, Increment and Max value from the settings gear. For custom versions in MetaTrader, our walkthrough on how to install MT4 and MT5 indicators shows the folder path.
Where to go next
Trend tools work best in a small, tested set. See our roundup of the best day trading technical indicators for tools that combine well with SAR. For background reading, Investopedia explains the Parabolic SAR indicator at Investopedia, and Wikipedia documents the Parabolic SAR formula on Wikipedia.
FAQ
What does a parabolic chart mean?
It means price is accelerating rather than trending steadily. Each pullback gets shallower, candle ranges expand, and the slope steepens toward vertical. The same word also describes the Parabolic SAR indicator, so check the context before you answer.
What does SAR stand for in Parabolic SAR?
SAR stands for stop and reverse. The dots act as a trailing stop while the trend runs. When price crosses them, the indicator stops that direction and reverses, placing the dots on the other side of the candles.
What are the best Parabolic SAR settings?
Start with the defaults: step 0.02 and maximum 0.2. A step of 0.03 to 0.05 suits fast intraday charts because the dots tighten sooner. Lower values suit swing trades, since they give a trend more breathing room.
Does Parabolic SAR repaint?
No. Values are fixed once a bar closes, so historical dots stay where they are. Only the dot on the live, unclosed candle can still move, which is normal behaviour for any trailing calculation.
Can you time the top of a parabolic move?
No, and you should not try. The top arrives when buyers run out, not at a level you can measure in advance. Trail a stop behind the move instead, then let the market take you out when momentum breaks.
Will Parabolic SAR always keep me on the right side?
No. The indicator trails price and reacts to it; it never predicts the next move, and it whipsaws in ranges. Trading involves risk, results are not guaranteed, and past performance is not indicative of future results.

About the author
Written by Dominic Walsh, a Forex trader and MT4/MT5 indicator, Expert Advisor and script developer. Every tool on forexmt4systems.com is tested on live charts before release and ships with ready-to-use compiled MT4 (.ex4) and MT5 (.ex5) files. Learn more about the trader and developer behind this site.
How we build, test and correct every tool: Editorial & Testing Policy. Trading carries risk; see the disclaimer.