
The best RSI indicator settings for most traders are the default 14-period lookback, with overbought at 70 and oversold at 30. Those numbers suit almost every pair and timeframe. Still, the right setting depends on how you trade. Scalpers shorten the period to react faster; swing traders lengthen it to filter noise. This guide gives you the exact RSI settings for scalping, day trading and swing trading on MT4, MT5 and TradingView. Real EURUSD and gold charts show each one, so you can see the difference before you commit.
What RSI is and the default 14 setting
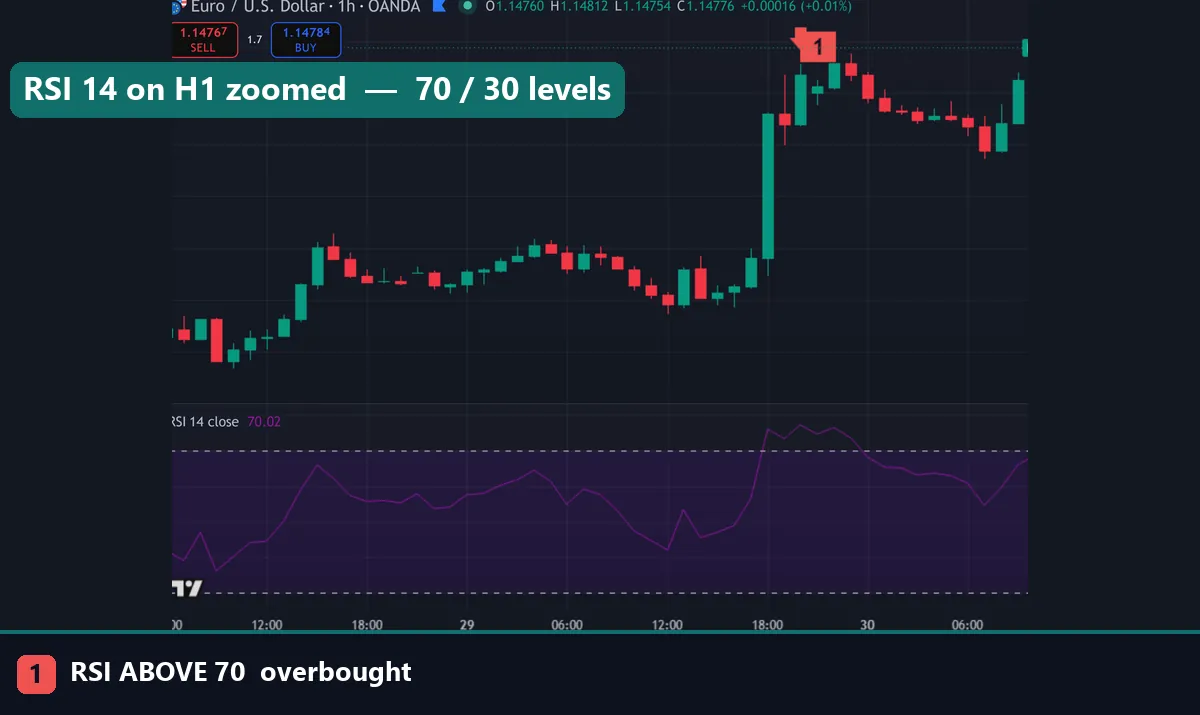
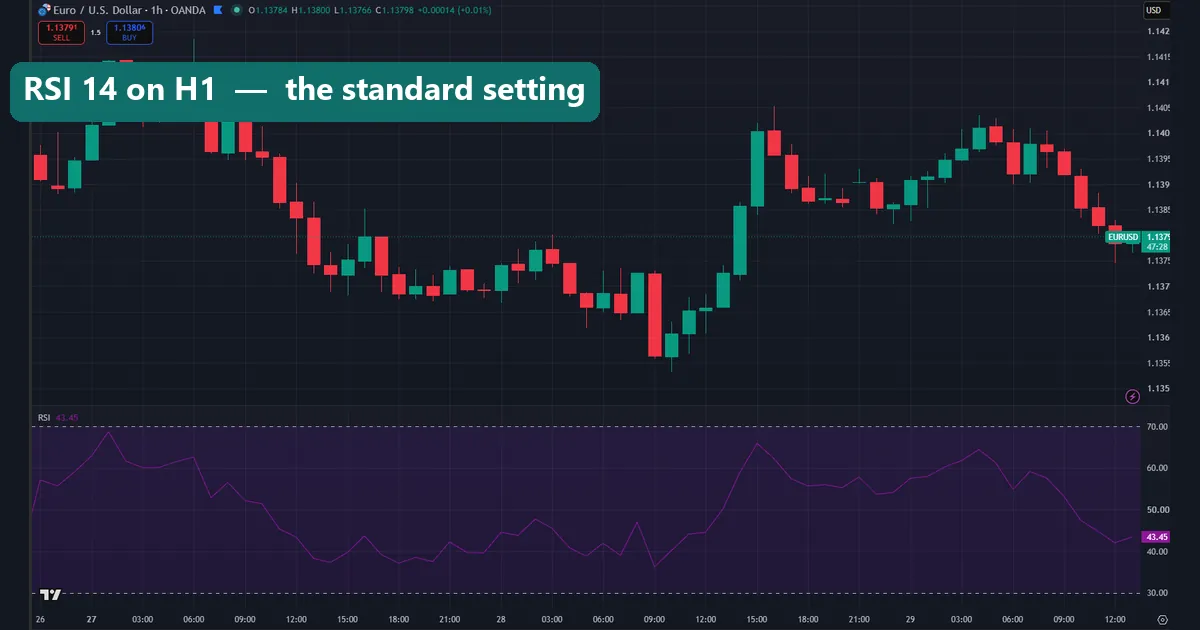
RSI stands for Relative Strength Index. J. Welles Wilder introduced it in 1978 as a momentum oscillator. It measures the speed and size of recent price moves on a scale from 0 to 100. The default lookback is 14 periods, with overbought marked at 70 and oversold at 30. A reading above 70 means price has climbed fast and may be stretched. A reading below 30 means sellers have pushed hard.
Keep 14 when you are learning the tool or trading H1 and above. The default reacts quickly enough for most setups without flip-flopping on every candle. Above 70, momentum is strong but extended. Below 30, the move looks overdone. The 50 line matters too, because a cross above it often confirms that buyers have regained control. Change the number only once you know why 14 is not fitting your style.
Best RSI settings for scalping
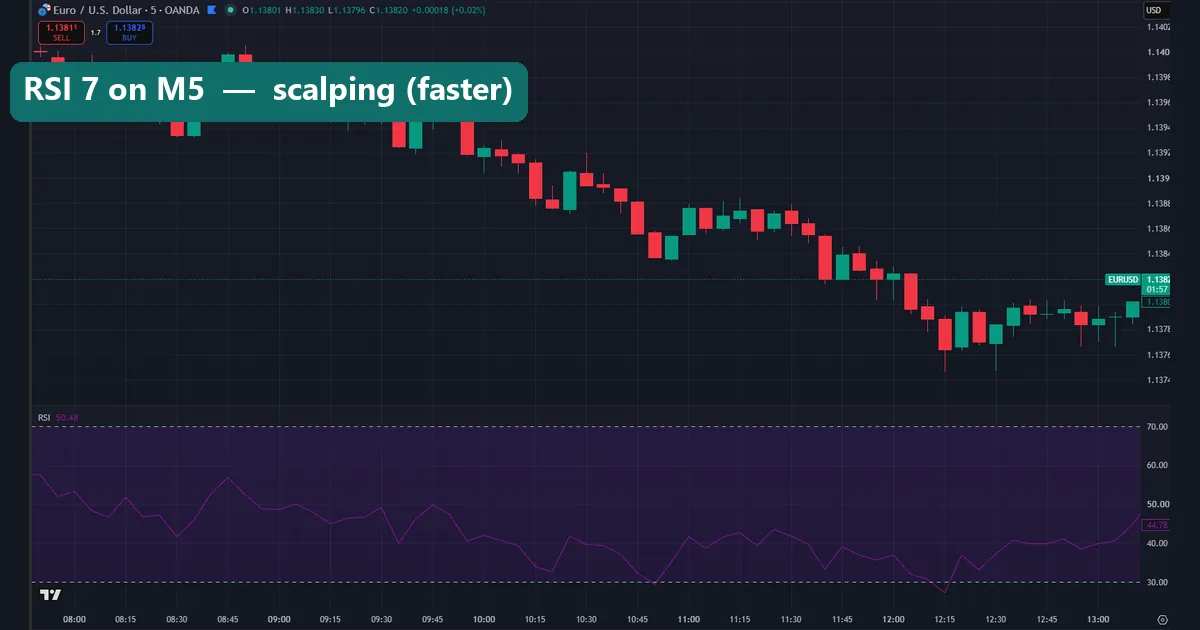
Scalping on M1 to M5 needs an RSI that reacts now, not in fourteen candles. Shorten the period to 7 to 9, and many scalpers widen the levels to 80 and 20. The shorter lookback swings faster, so you get more overbought and oversold readings and quicker mean-reversion signals. On the chart above the length-7 line reaches both extremes far more often than the default does.
The trade-off is noise. A faster RSI fires constantly, and plenty of those signals lead nowhere. So pair a scalping RSI with a trend filter, such as a higher-timeframe moving average or the session you trade. Then take signals only in the direction of that filter, and ignore the ones that fight it.
Best RSI settings for day trading
Day traders on M15 to H1 are best served by the standard 14-period RSI with 70/30 levels. It is the setting Wilder designed, and it balances speed against reliability. On these timeframes 14 reacts fast enough to catch intraday turns, yet it filters out the tick-by-tick chop that a 7-period line would chase. In short, the best setting for the RSI indicator on an intraday chart is usually the one you started with.
Use the middle of the range as well. A cross back above 50 after a dip often confirms that momentum has flipped, which gives a cleaner entry than waiting for a full oversold print. Combine that with support or a trendline, and the default earns its place.
There is no need to over-engineer this. Many profitable day traders never touch the 14. Instead, they read the RSI in context: is price at a level, and does momentum agree? That question matters far more than the exact number in the settings box.
Best RSI settings for swing trading
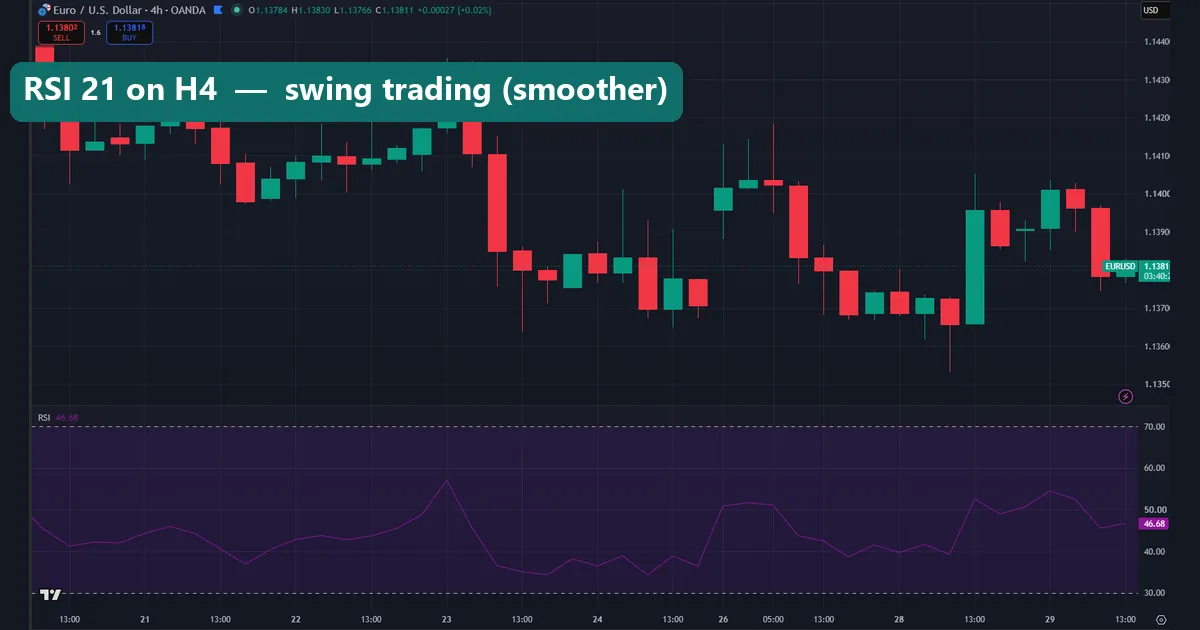
Swing traders on H4 and daily charts want the opposite of a scalper: fewer, cleaner signals. Lengthen the period to 21, or even 25, and keep the levels at 70/30. The longer lookback smooths through intraday noise, so the line only reaches an extreme on a real move. On the length-21 chart above the RSI ignores the small wobbles and turns only when the swing is genuine.
These settings produce far fewer signals, which is exactly the point. A daily RSI that pushes below 30 and then curls back up, inside a strong trend, is a high-quality setup worth waiting for. Patience is the edge here, not speed. Longer periods also fit position traders who check charts once a day and want to skip the intraday noise entirely.
Best RSI indicator settings by timeframe and style
| Style | Timeframe | Period | Levels | Use it for |
|---|---|---|---|---|
| Scalping | M1–M5 | 7–9 | 80/20 | Fast momentum extremes |
| Day trading | M15–H1 | 14 | 70/30 | Balanced intraday turns |
| Swing | H4–D1 | 21–25 | 70/30 | High-quality trend reversions |
Treat these as starting points, not rules. The best RSI setting for one pair can be slightly off on another, so backtest the numbers on the market and timeframe you actually trade before you rely on them.
Adjusting the RSI overbought and oversold levels
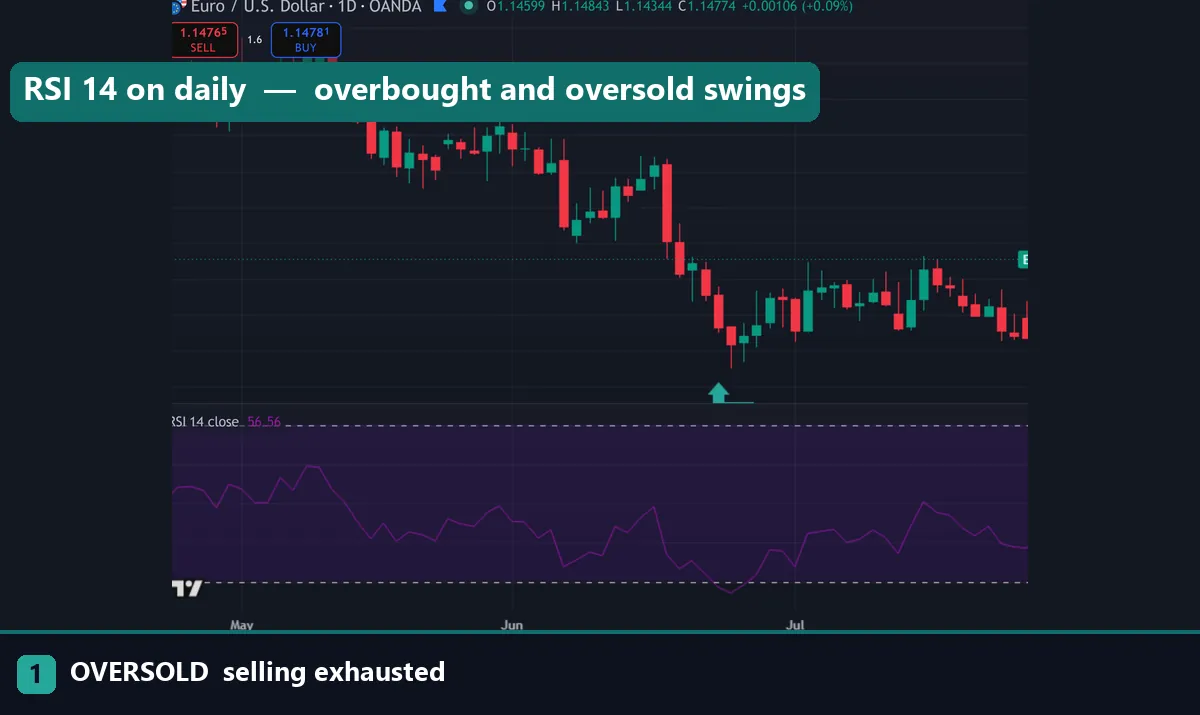
The period is only half the setting; the levels matter just as much. The default 70 and 30 suit ranging markets, where price rotates between the two extremes. In a strong trend, though, RSI can sit above 70 for a long stretch without turning. So trend traders often shift the bands to 80 and 20 to demand a stronger reading before they act.
Divergence is the other reason to read RSI closely. When price makes a higher high but RSI makes a lower high, momentum is fading even though price is not. That gap often warns of a pullback before the candles do. The chart above marks one such divergence. Keep your period fixed, then read divergence off whatever levels you have set.
How to change RSI settings on MT4, MT5 and TradingView
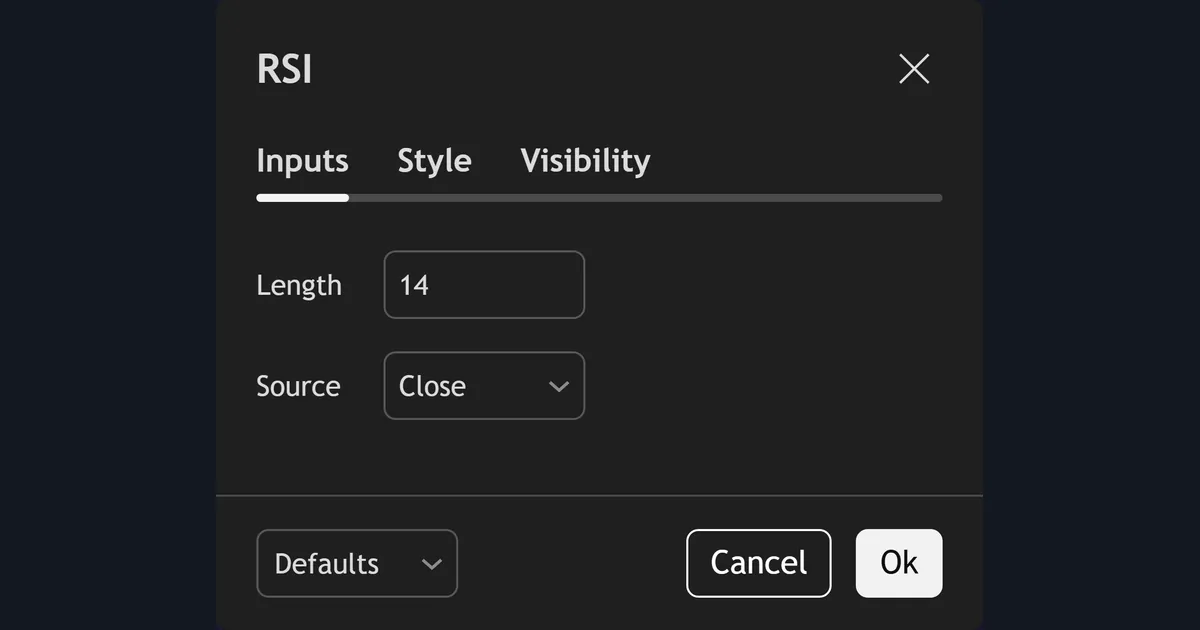
On MetaTrader the RSI lives under Insert → Indicators → Oscillators → Relative Strength Index. In the dialog, Period is the lookback, and Apply to should stay on Close. Open the Levels tab to change 70 and 30 to your own numbers, then click OK. On TradingView, add the Relative Strength Index, open its settings gear, and edit Length and the level lines. The full walkthrough with screenshots is in the guide on how to install MT4 and MT5 indicators.
Download the complete indicator database
Put these concepts on your charts. One email unlocks the full library of 1,380+ indicators with compiled MT4 and MT5 files, plus my TradingView scripts. No paywall, no spam, unsubscribe any time.
Get free access to my indicator database
One email unlocks 1,380+ free MT4, MT5 and TradingView indicators — the complete library. No single-tool download; you get the whole database.
Common RSI settings mistakes
Three mistakes ruin most RSI setups. First, over-shortening: a 3-period RSI on a daily chart just tracks noise and prints overbought on nearly every green candle. Second, trading every overbought or oversold reading. In a strong trend RSI can ride above 70 for dozens of bars, so an extreme is not a reversal on its own — wait for a level cross back, a break of structure, or a divergence. Third, moving the levels without a reason. The 70/30 pair is standard for a reason, and jumping to 90/10 means you will almost never see a signal. Fix the period to your timeframe first, and leave the levels near 70/30 unless a backtest clearly tells you otherwise.
Where to go next
RSI pairs well with other momentum and trend tools. See our roundup of the best day trading indicators, the wider library of indicator settings guides, and the full range of RSI indicators you can download and test. For the theory, Investopedia explains how the RSI works, and Wikipedia covers the underlying Relative Strength Index formula.
FAQ
What is the best RSI setting for day trading?
Stick with the default 14-period RSI and 70/30 levels on M15 to H1. It reacts fast enough for intraday turns while filtering the noise a shorter period would chase. Watch the 50 line as well, because a cross through it helps confirm the trend.
What is the best RSI setting for scalping?
Shorten the period to 7 to 9 and consider widening the levels to 80/20. That reacts fast enough for M1 and M5. Always add a trend filter, though, because a fast RSI produces many false signals on its own.
Is a lower RSI period always better?
No. A lower period reacts faster but fires more false signals; a higher period is smoother but slower. Match the number to your timeframe instead — short for scalping, 14 for intraday, and 21 or more for swing trading.
Should I change the RSI period or the levels?
Change the period first, because it does most of the work of matching RSI to your timeframe. Adjust the levels to 80/20 only when you trade strong trends and want a stricter reading before you act.
Does the RSI repaint?
No. RSI is calculated from closed prices, so once a candle closes its RSI value for that bar is fixed. Only the current, unclosed candle updates in real time, which is normal for any oscillator.
Are these RSI settings guaranteed to work?
No. Settings only shape the tool; they do not predict price. Trading involves risk, results are not guaranteed, and past performance is not indicative of future results.

About the author
Written by Dominic Walsh, a Forex trader and MT4/MT5 indicator, Expert Advisor and script developer. Every tool on forexmt4systems.com is tested on live charts before release and ships with ready-to-use compiled MT4 (.ex4) and MT5 (.ex5) files. Learn more about the trader and developer behind this site.
How we build, test and correct every tool: Editorial & Testing Policy. Trading carries risk; see the disclaimer.