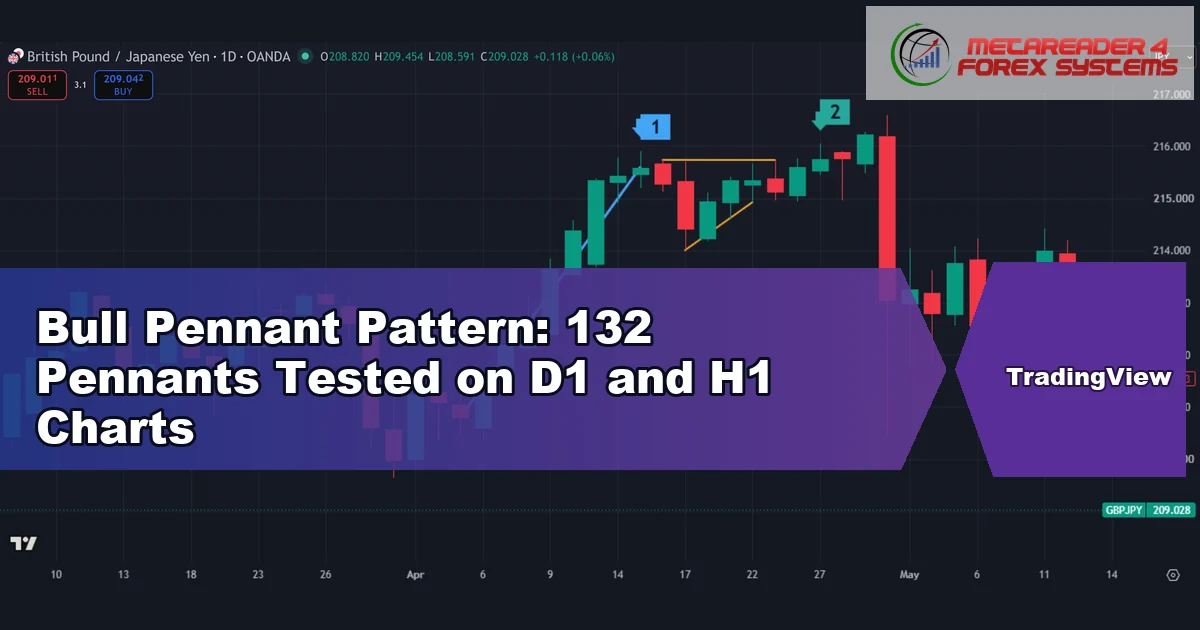
A bull pennant is a sharp rally that pauses in a short, narrowing range, and the textbook says price should then break higher and travel about as far again. We …
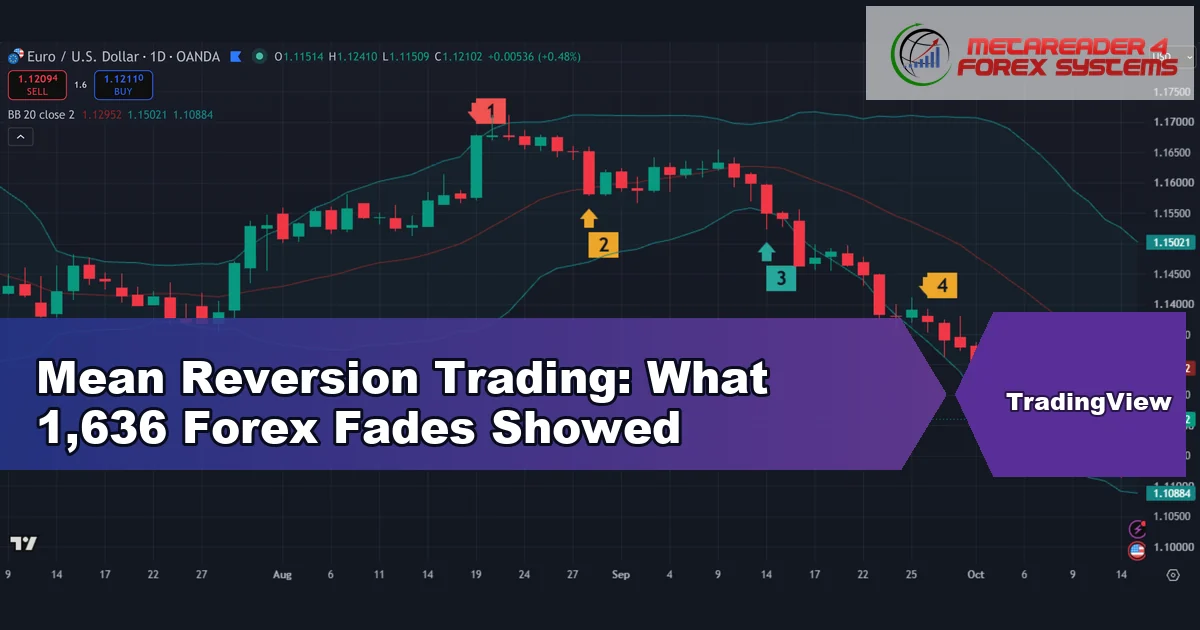
Mean reversion trading bets that a price stretched far from its recent average will drift back toward it. This guide tests that bet on forex with one plain rule: fade …
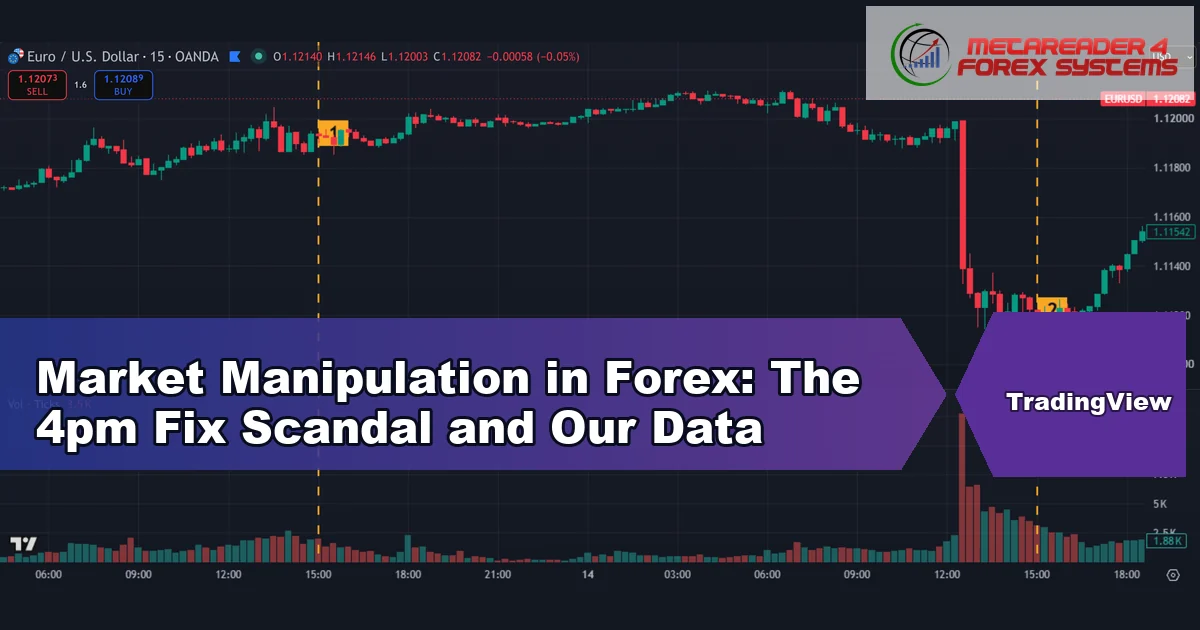
Market manipulation is any deliberate attempt to push a price away from where real supply and demand would set it. In forex, the best documented case is the 4pm London …
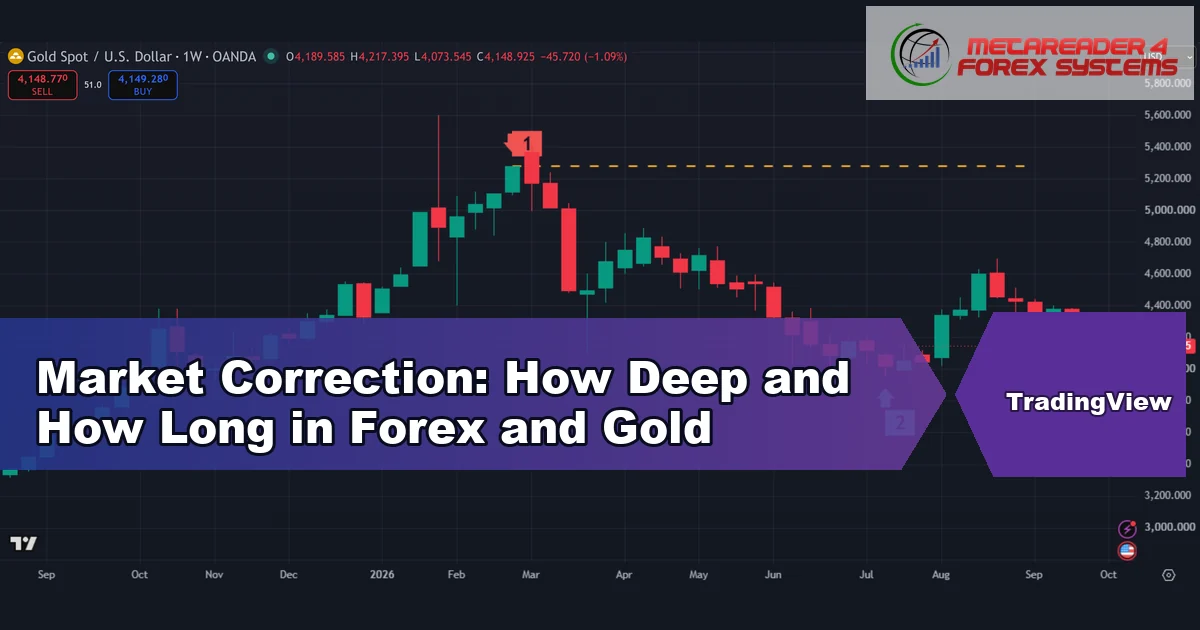
A market correction is a fall of at least 10% from a recent closing high, but that rule comes from stock indexes and fits currencies and gold badly. This guide …
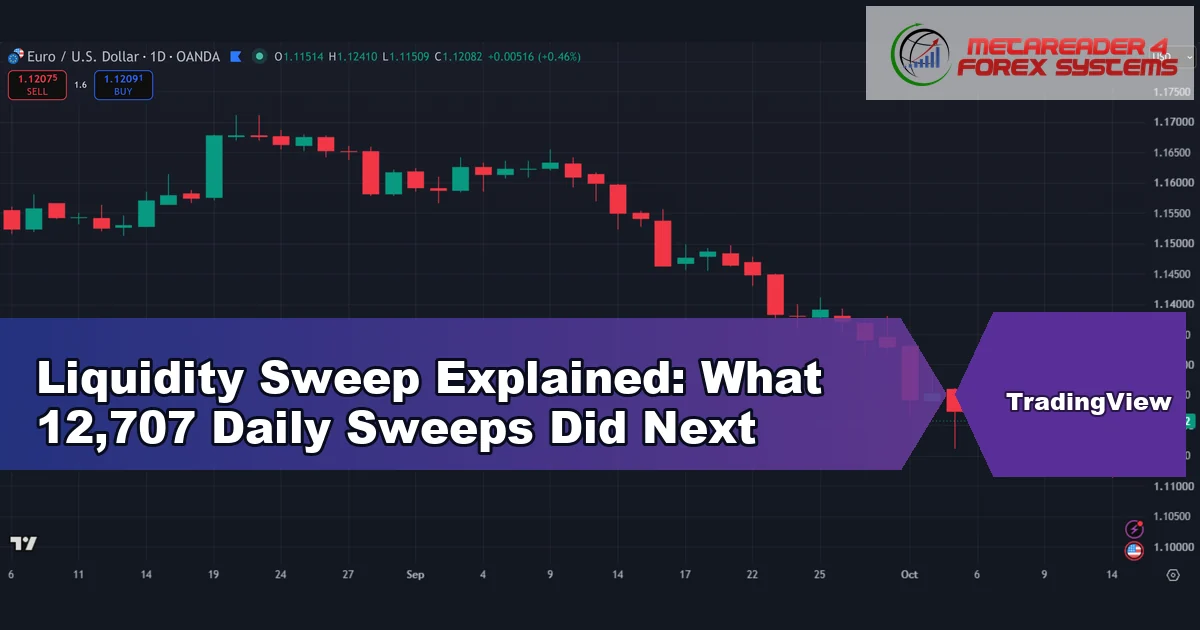
A liquidity sweep is a candle that trades through a prior high or low, where stop orders tend to rest, then closes back on the other side of that level. …
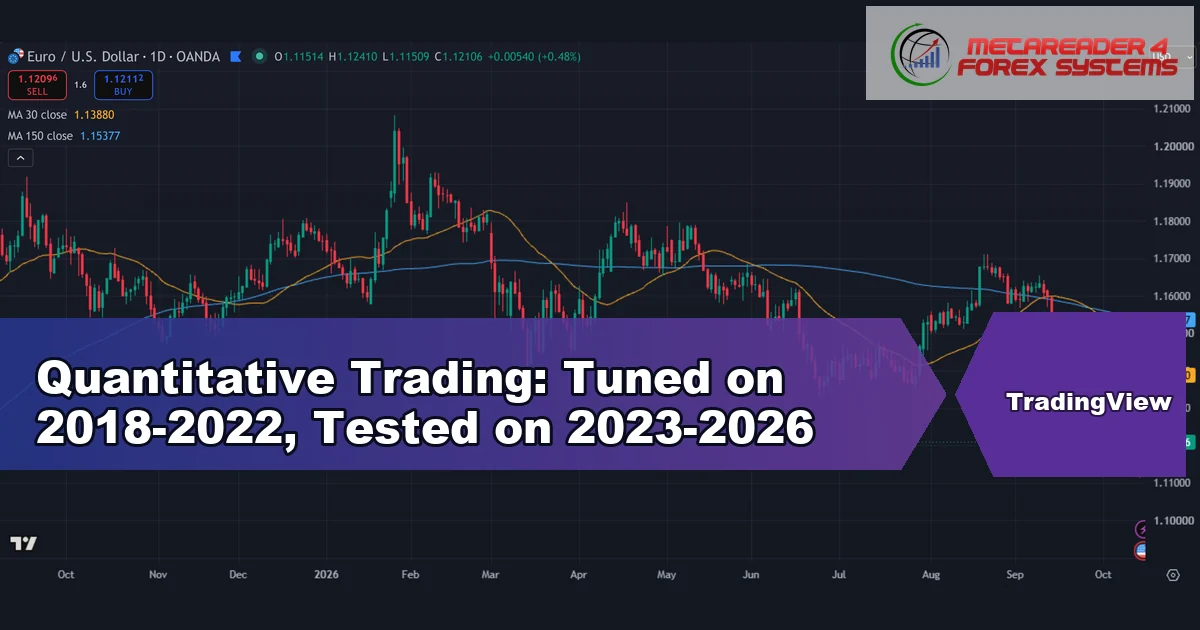
Quantitative trading means trading from exact rules that a computer can test on past data before any money goes in. This guide covers what that takes: rules, data, testing and …
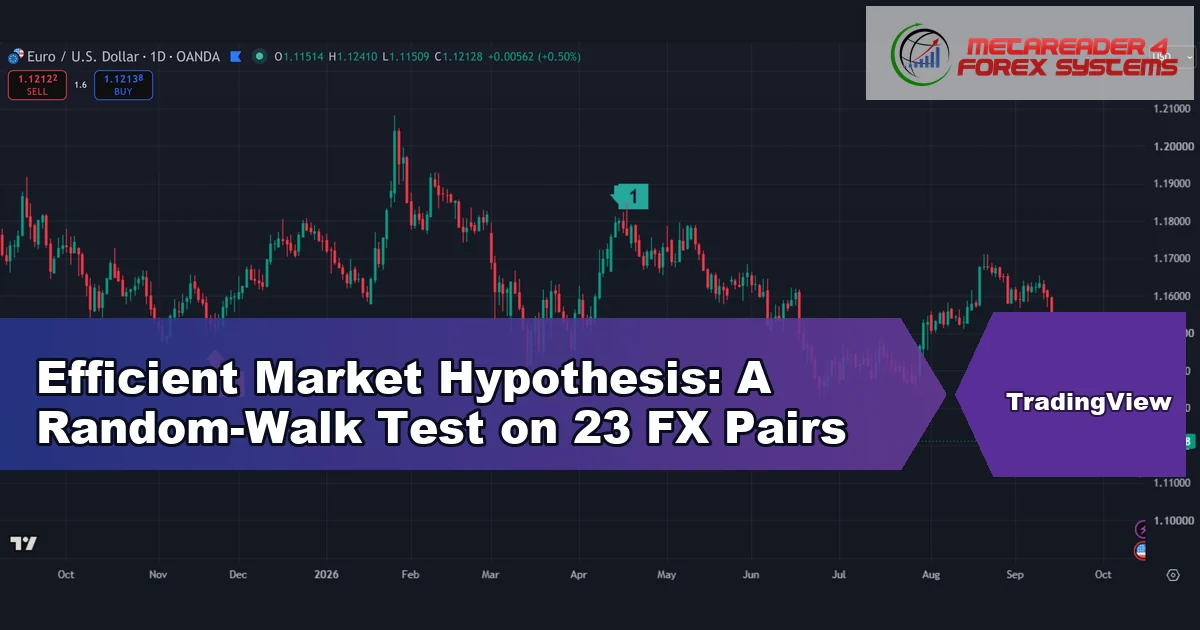
The efficient market hypothesis says that prices already reflect the information traders have. If that holds, yesterday’s moves cannot tell you where price goes next. This guide explains the idea, …
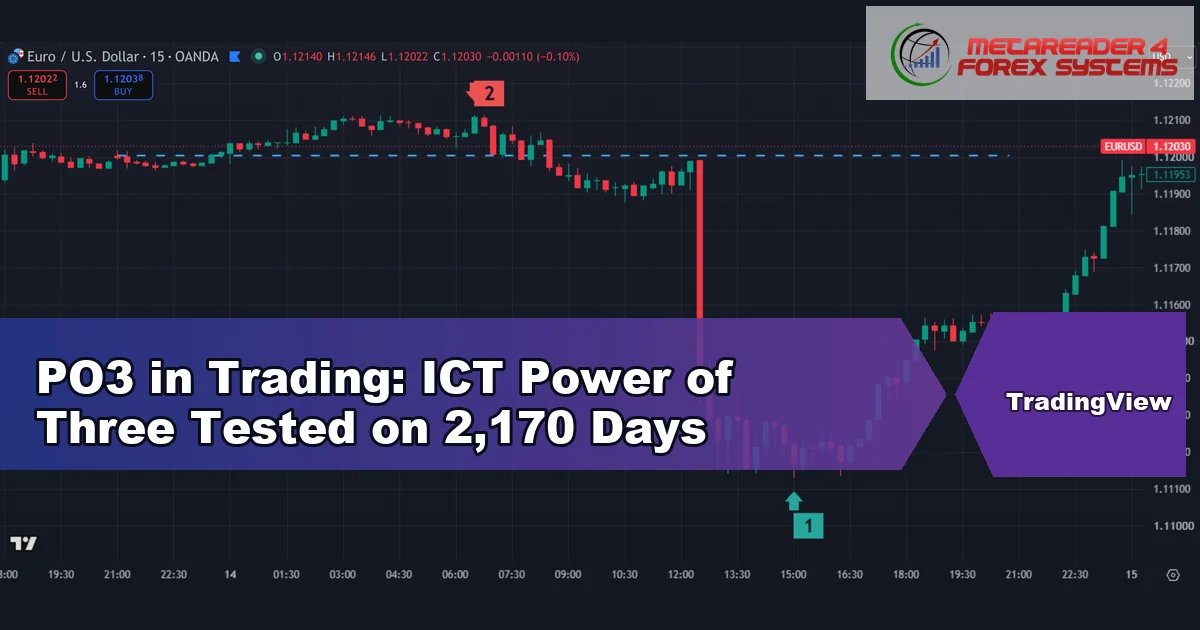
PO3 is the ICT name for the “power of three”: the idea that a daily candle forms in three phases. ICT calls them accumulation, manipulation and distribution. This guide tests …
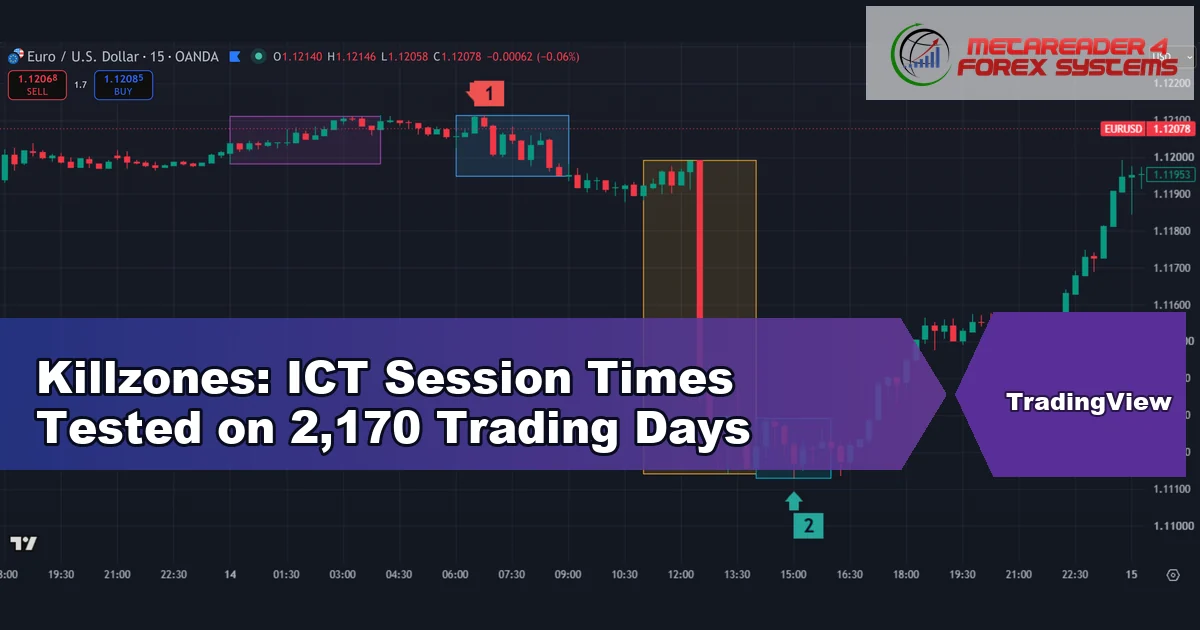
Killzones are four time windows, set in New York time, when ICT teaching says the big moves start. This guide gives the times in New York, London and UTC, shows …
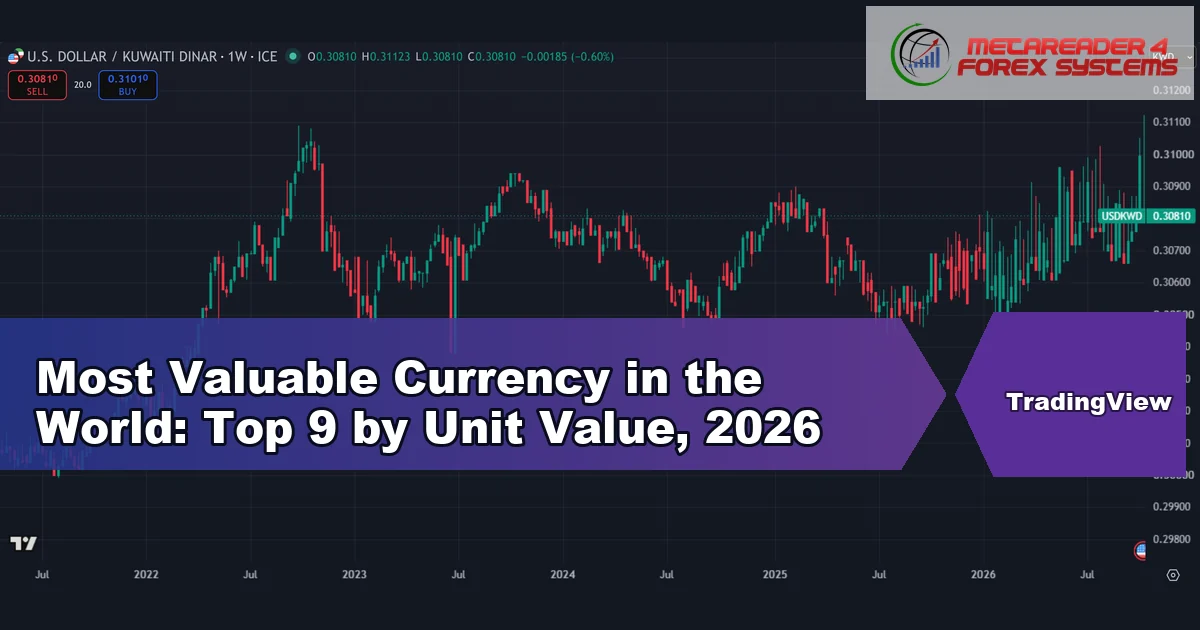
The most valuable currency in the world, measured by how many US dollars one unit buys, is the Kuwaiti dinar. At the quoted rate on 13 October 2026, one dinar …
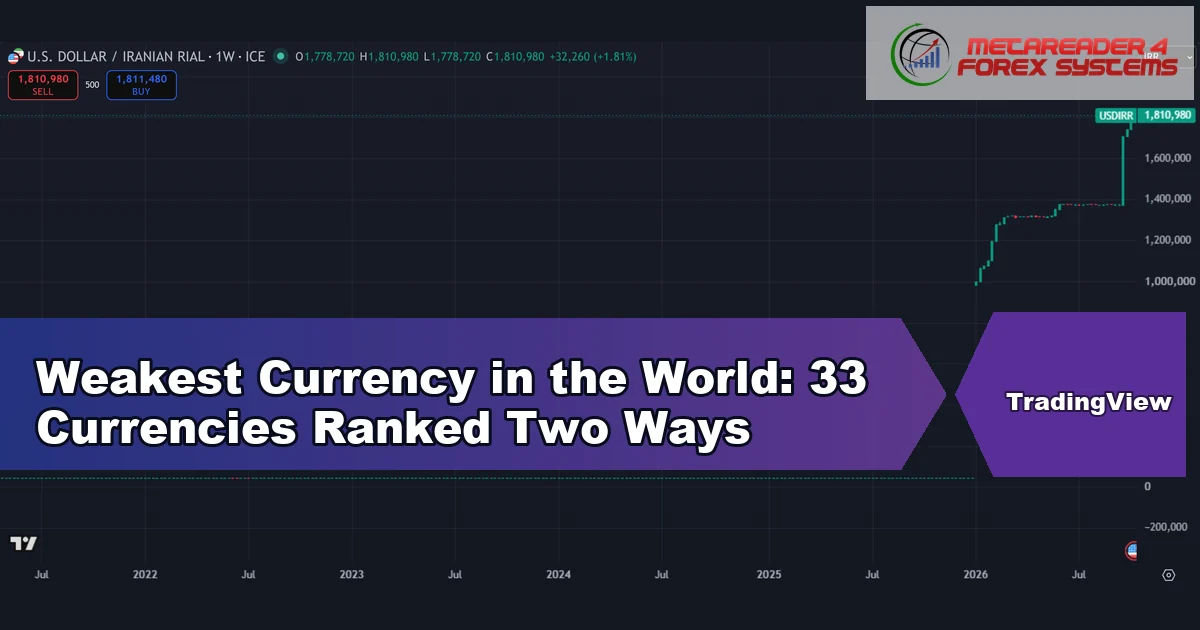
The weakest currency in the world, measured by how many units one US dollar buys, was the Iranian rial in our data: 1 USD = 1,800,165 IRR at the quoted …
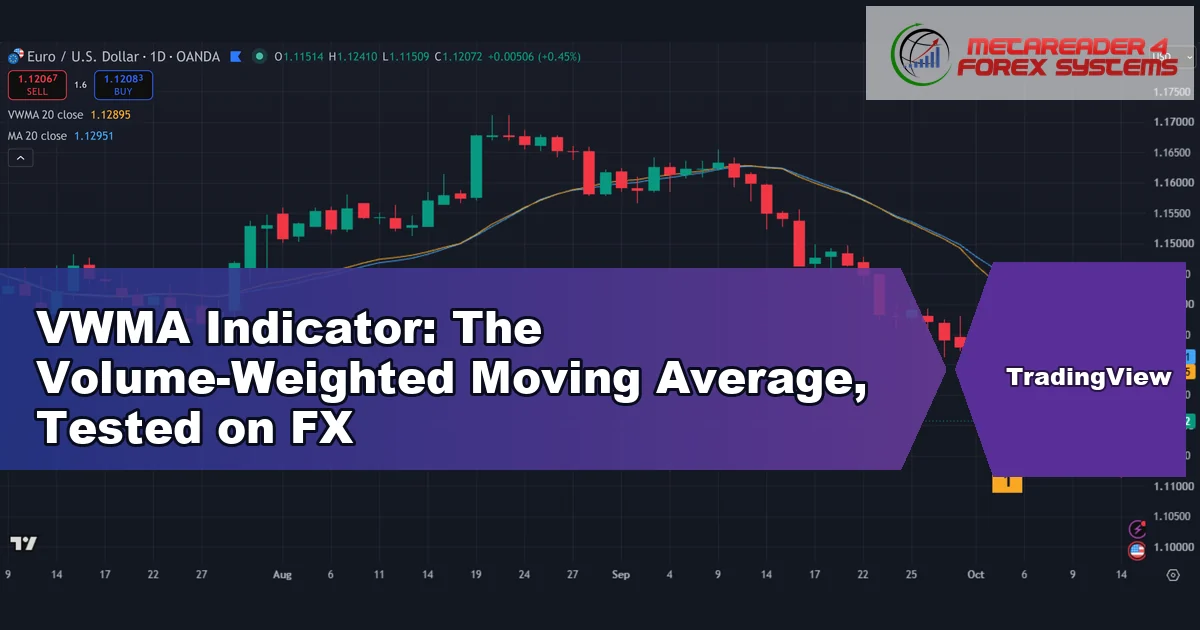
The VWMA indicator is a moving average that lets busy bars count for more than quiet ones. This guide settles three things: how the line is built, what “volume” means …
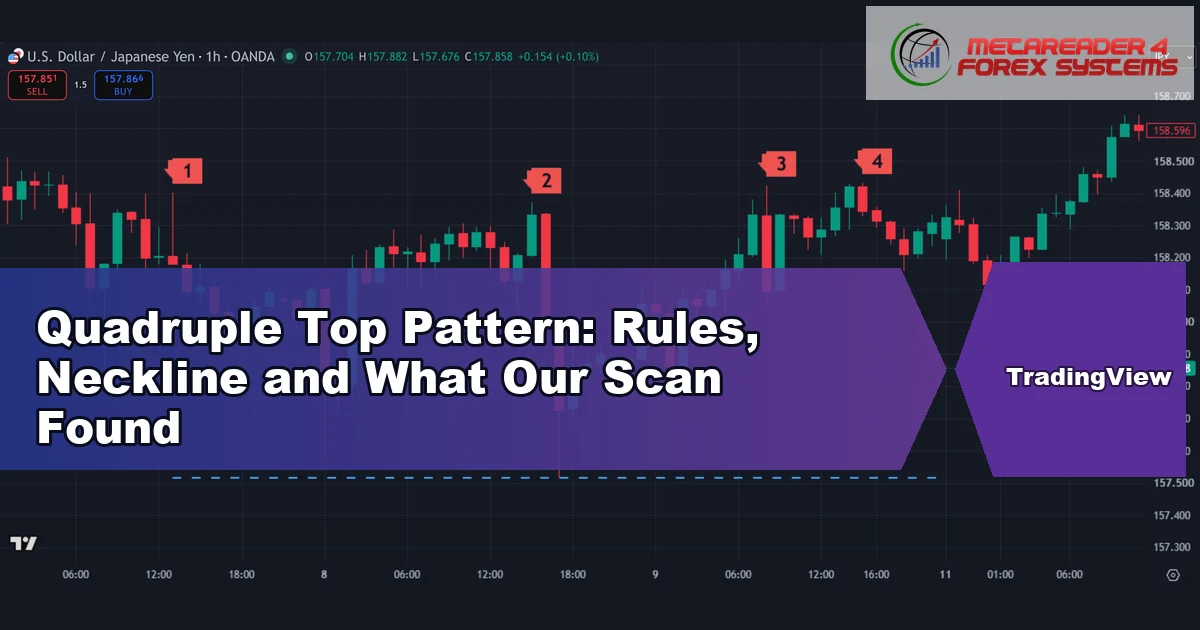
A quadruple top is a chart pattern with four highs at about the same price. It completes when price closes below the lowest point between those highs. This guide shows …
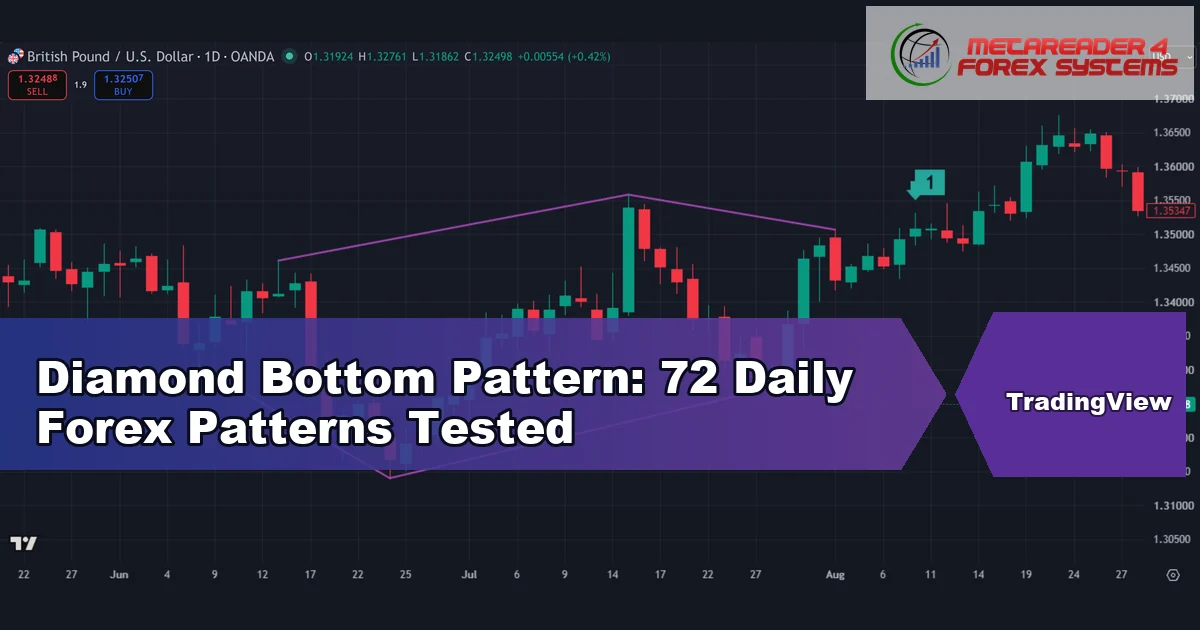
A diamond bottom is a chart pattern that forms after a fall. Price swings widen for a while and then narrow, so lines across the highs and lows look like …
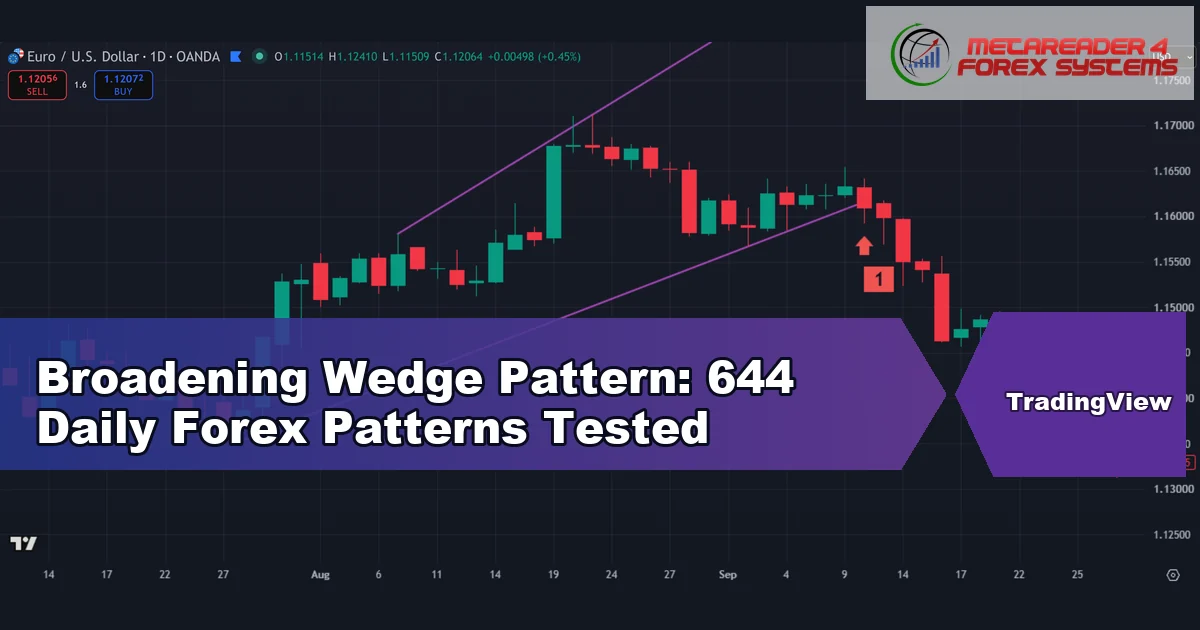
A broadening wedge is a chart pattern where two trend lines slope the same way and move apart, so each swing is wider than the last. This guide settles three …
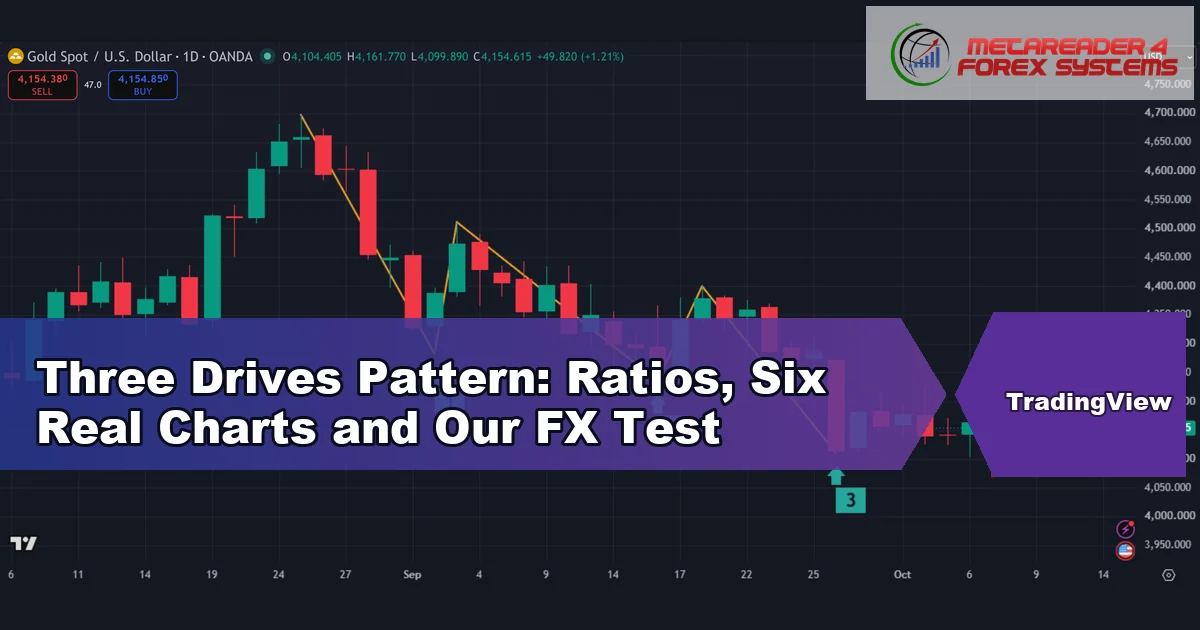
The three drives pattern is a reversal shape built from three pushes in one direction, each to a new extreme, with two pullbacks in between. This guide settles one question: …
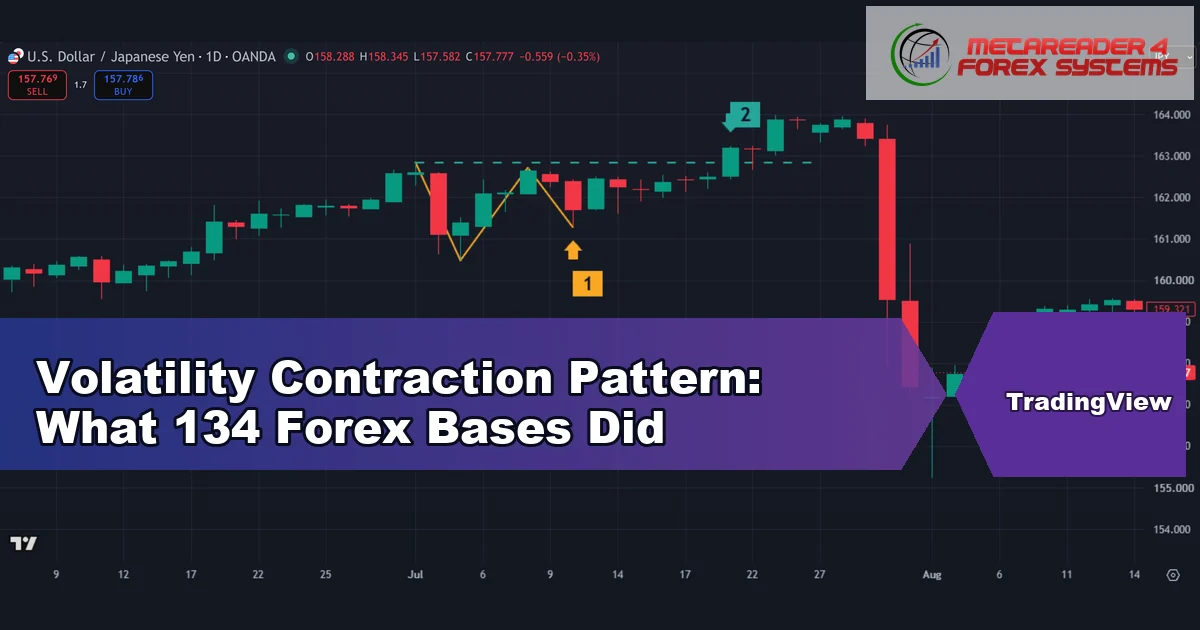
The volatility contraction pattern is a pause inside an uptrend where each pullback is shallower than the one before, until price closes above the top of the base. Mark Minervini …
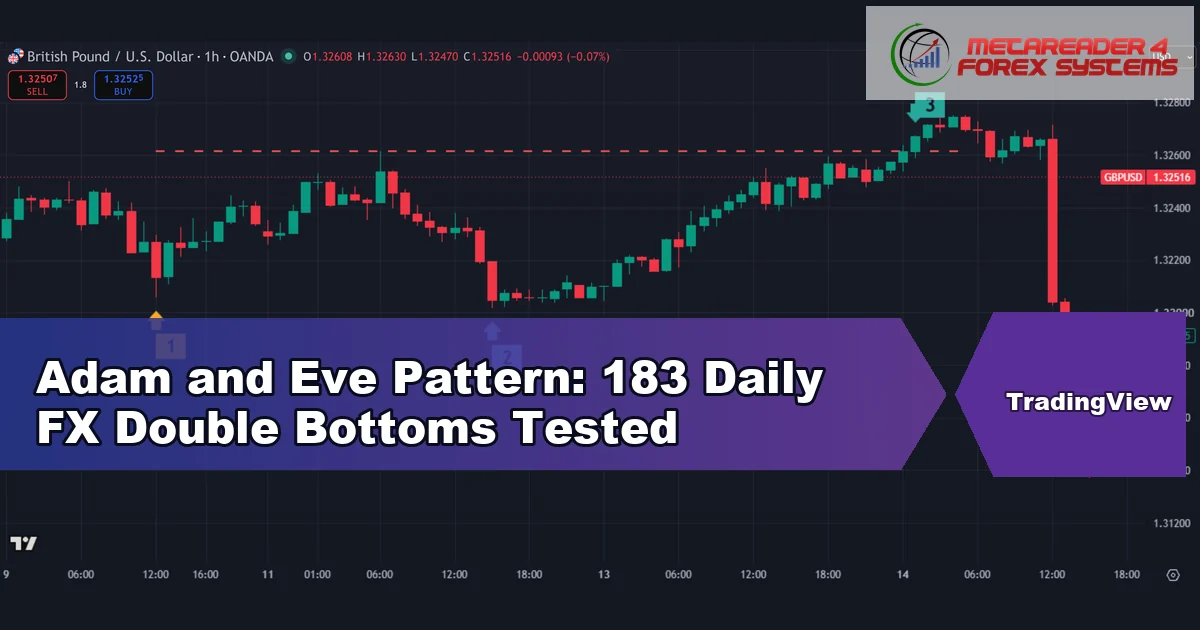
The Adam and Eve pattern is a double bottom with a sharp first low and a wide, rounded second low. Many trading sites treat that mix as a stronger reversal …
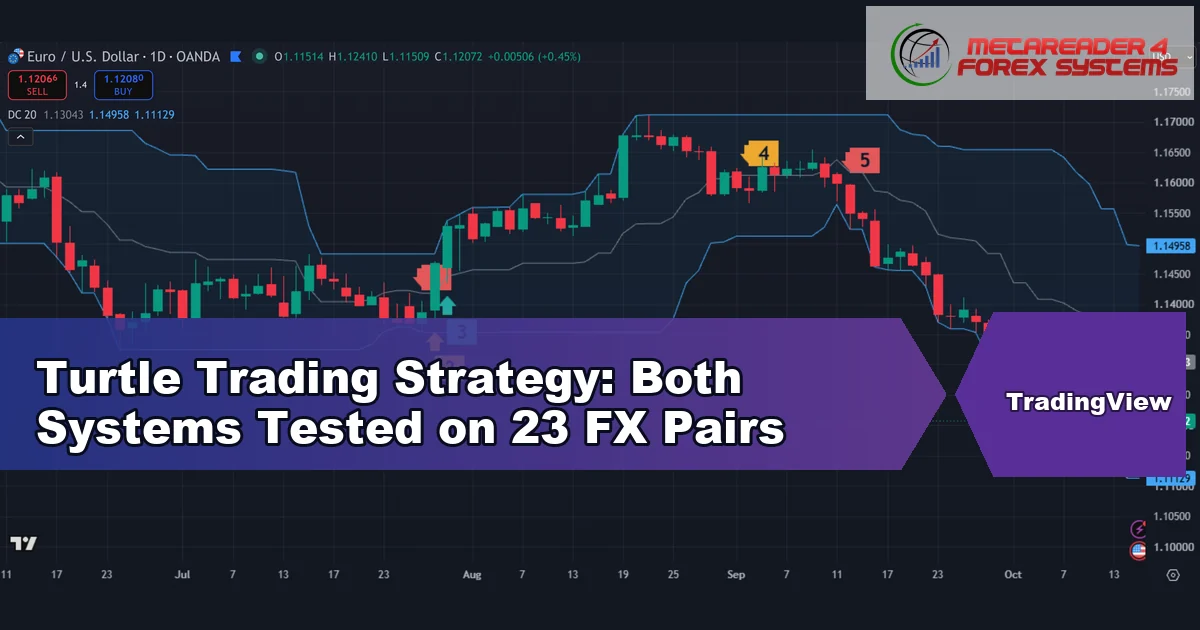
The turtle trading strategy is a breakout system with fixed rules for entries, exits, stops and position size. It buys when price breaks the highest high of the last 20 …
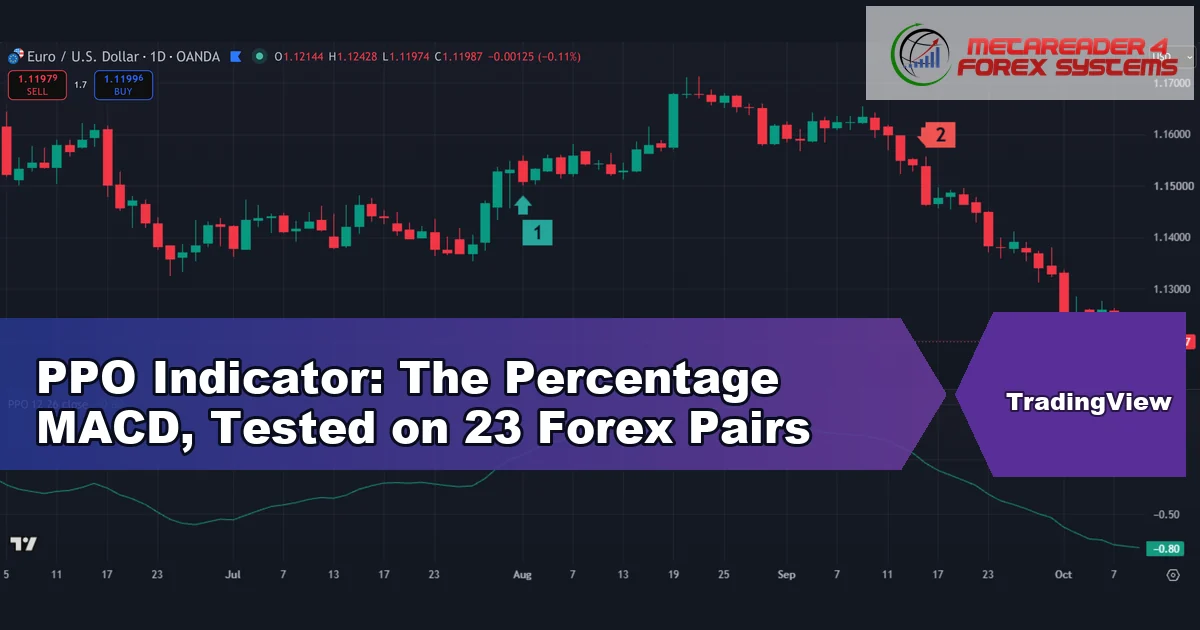
The PPO indicator is the MACD rebuilt as a percentage, so one reading means the same thing on EURUSD, USDJPY or gold. This guide settles three questions. First, what the …
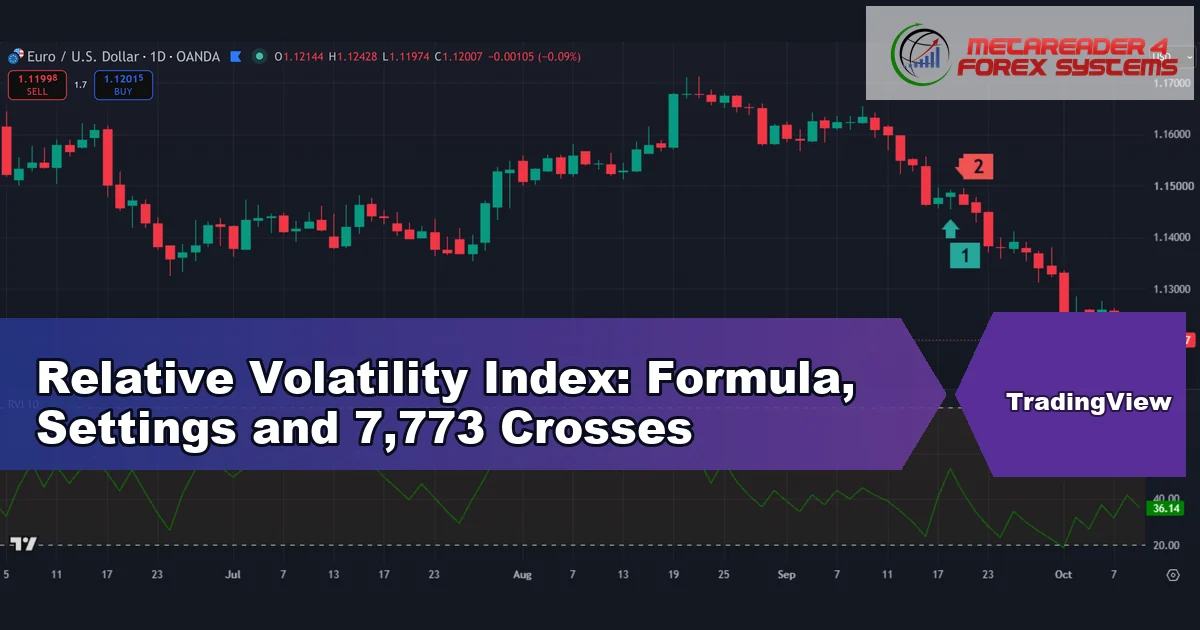
The relative volatility index is an RSI-style oscillator that asks a different question: on which days was volatility bigger, the up days or the down days? This guide settles what …
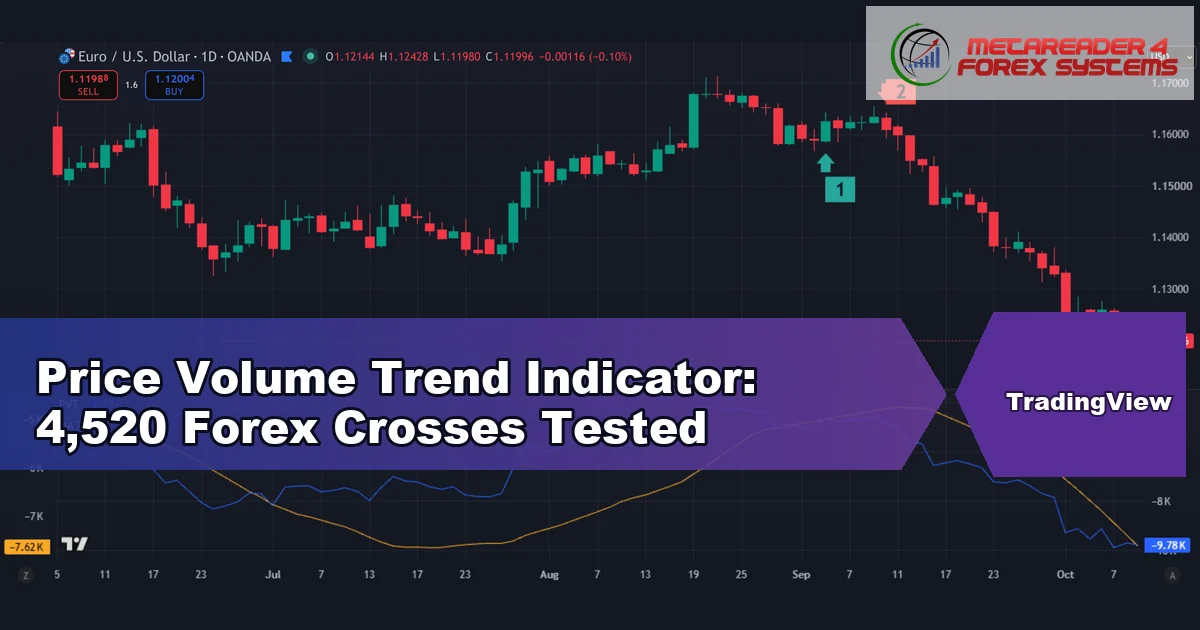
The price volume trend indicator adds up volume, but it scales each day’s volume by how far price moved in percent. So a big up day on busy tape lifts …
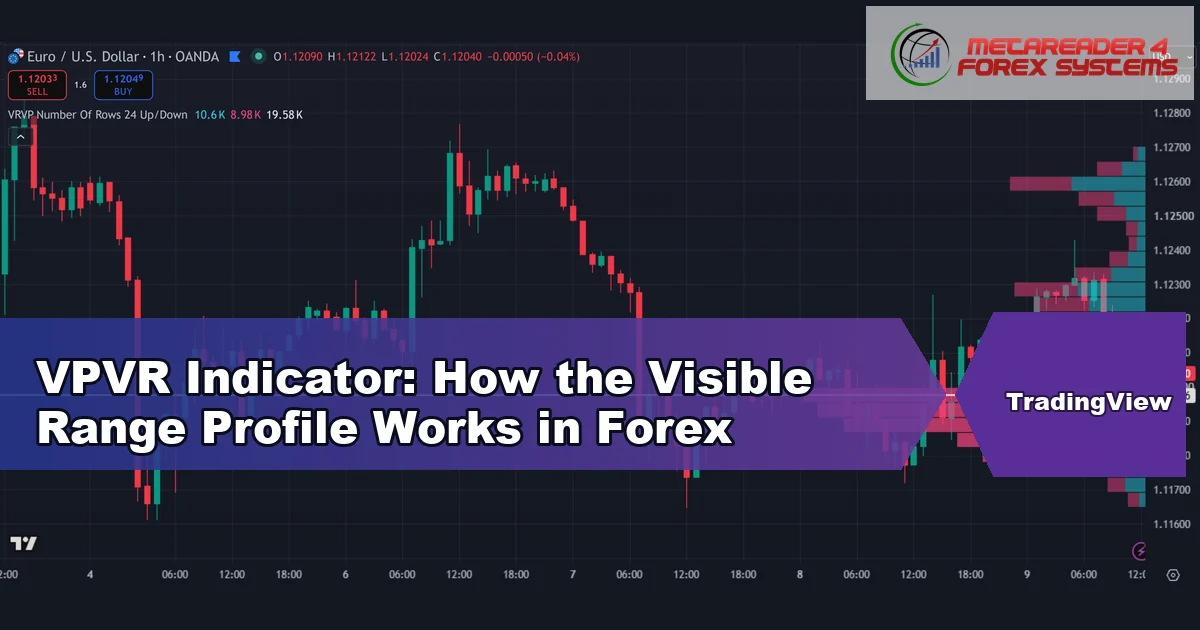
The VPVR indicator is TradingView’s Visible Range Volume Profile: a sideways histogram that shows how much volume traded at each price inside the part of the chart you can see. …
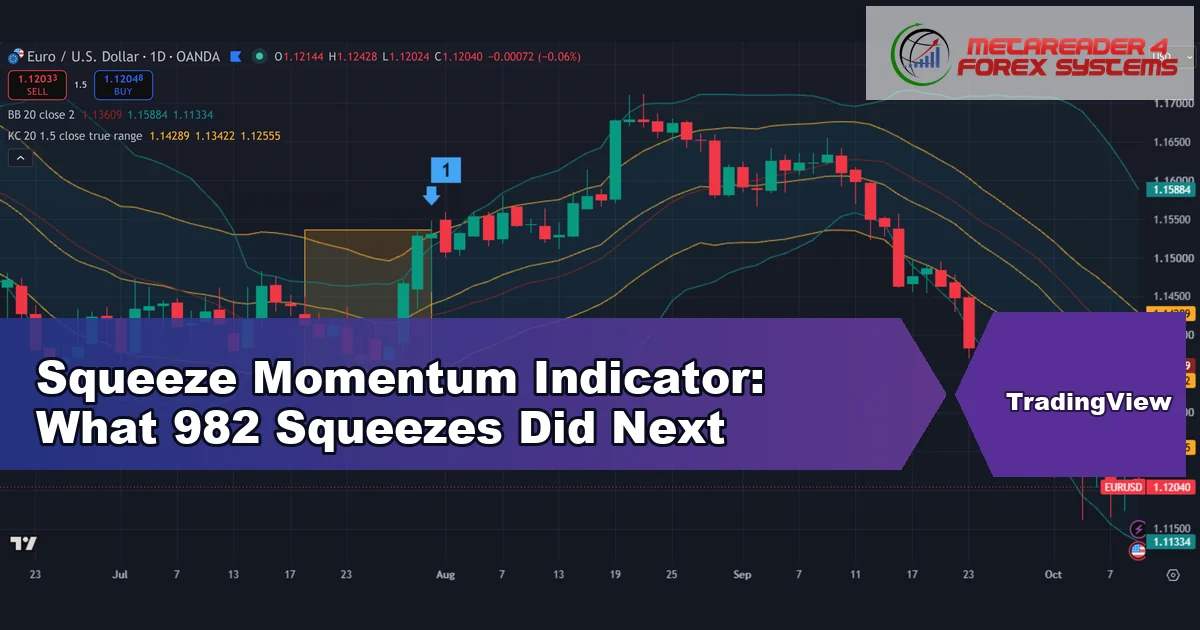
The squeeze momentum indicator flags the moment Bollinger Bands slip inside a Keltner Channel, then shows which way momentum leans when they slip back out. Traders use it to spot …
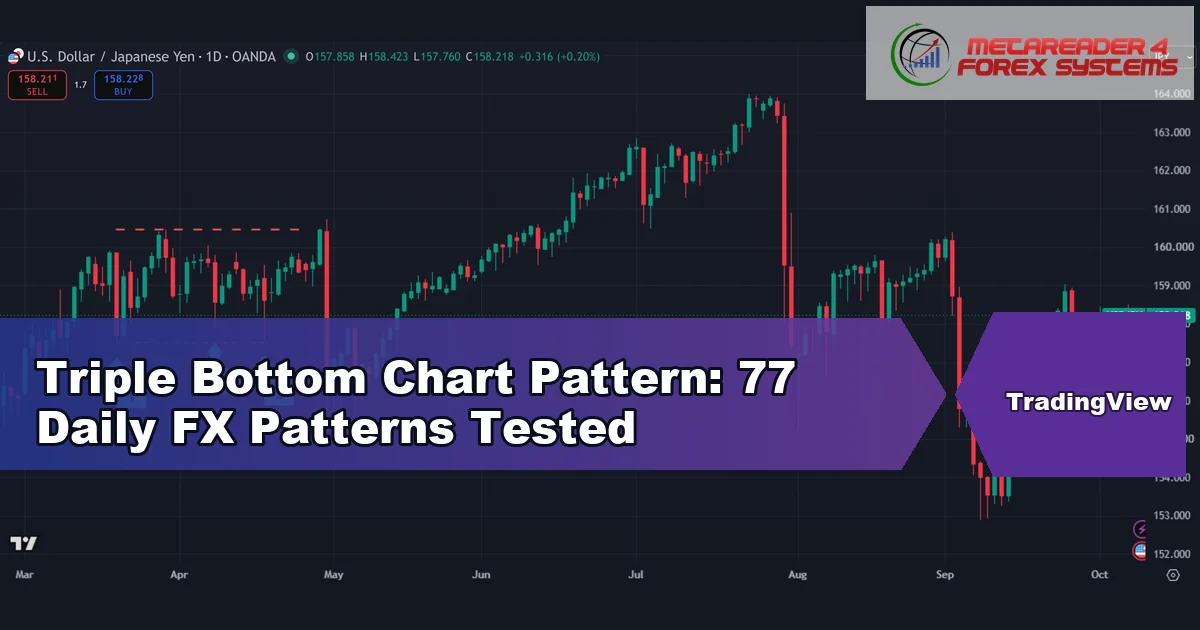
A triple bottom is a chart pattern where price falls to roughly the same low three times, bounces each time, and then closes above the highest point between those lows. …
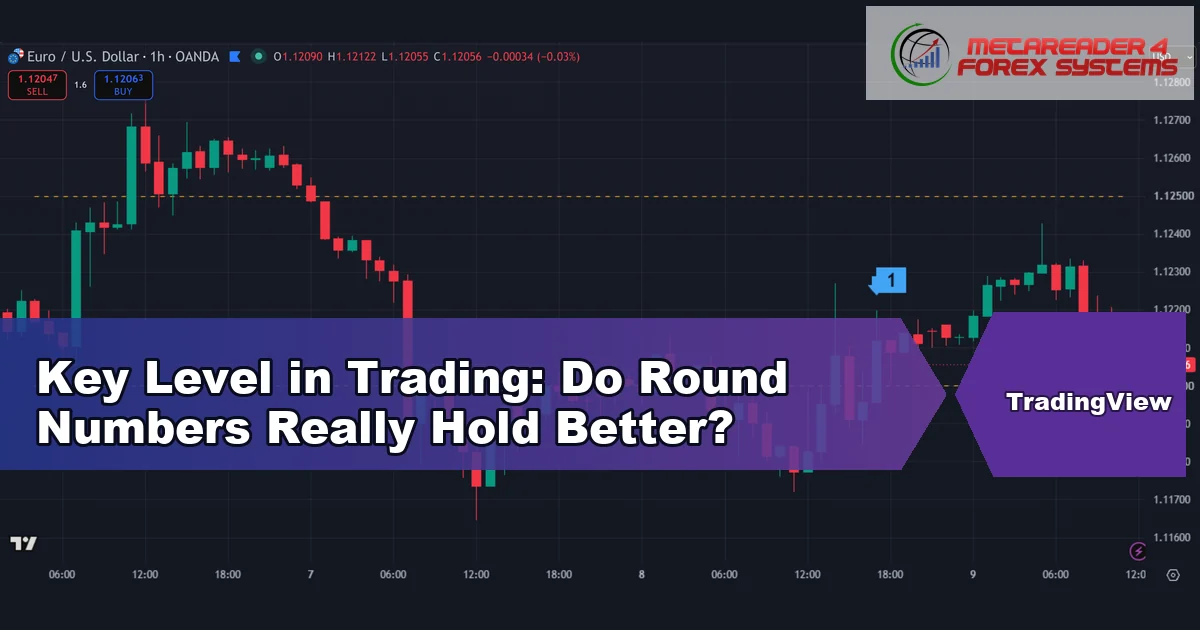
A key level is a price where traders expect the market to react, so they place orders there and watch it closely. This guide settles three things: what counts as …
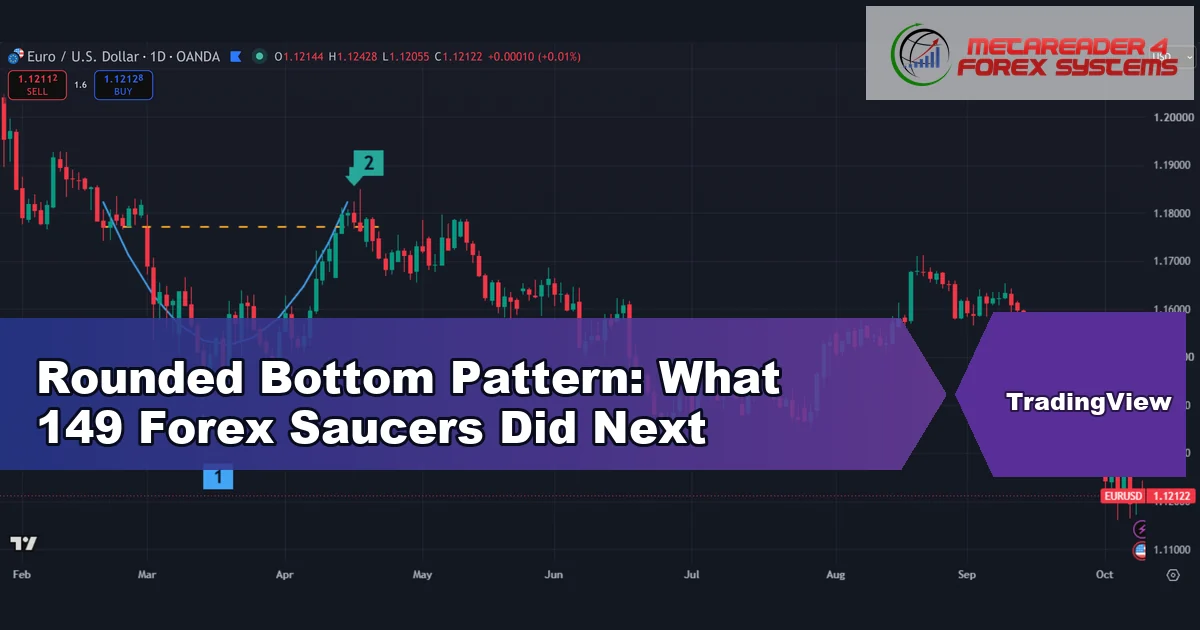
A rounded bottom is a slow, U-shaped low where price drifts down, flattens out and then climbs back toward where the fall began. This guide settles three questions. First, how …
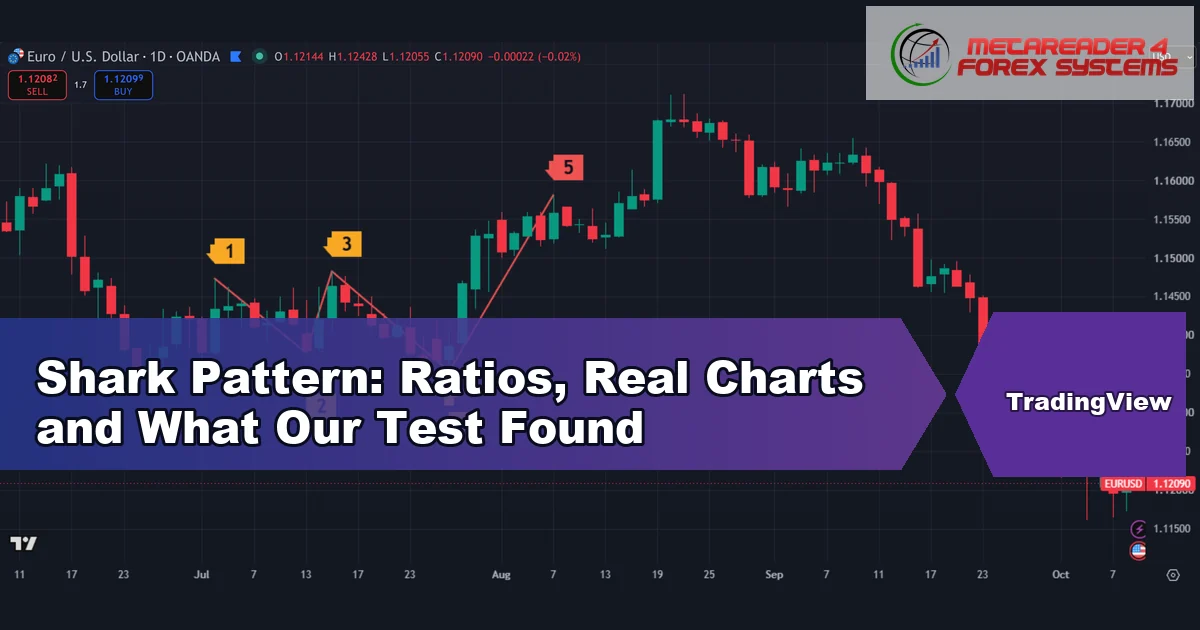
The shark pattern is a five-point harmonic reversal shape that Scott Carney introduced in 2011, and this guide settles one practical question: does it tell you anything on forex charts? …
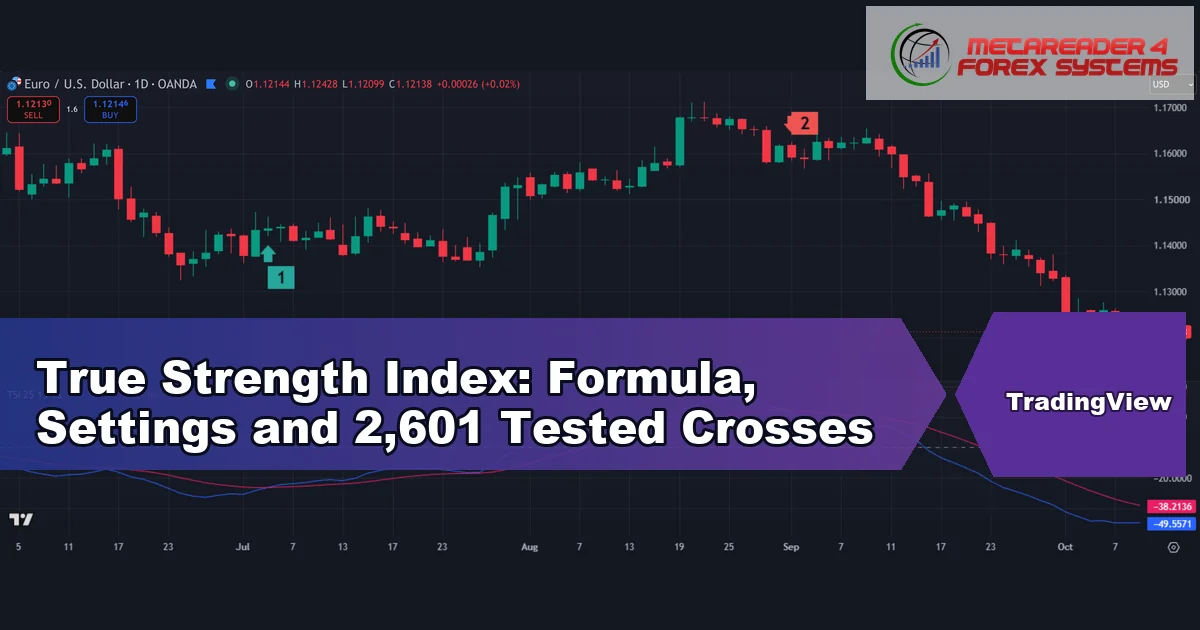
The true strength index (TSI) is a momentum oscillator that smooths price change twice and then scales it between -100 and +100. This guide settles three things. First, it shows …
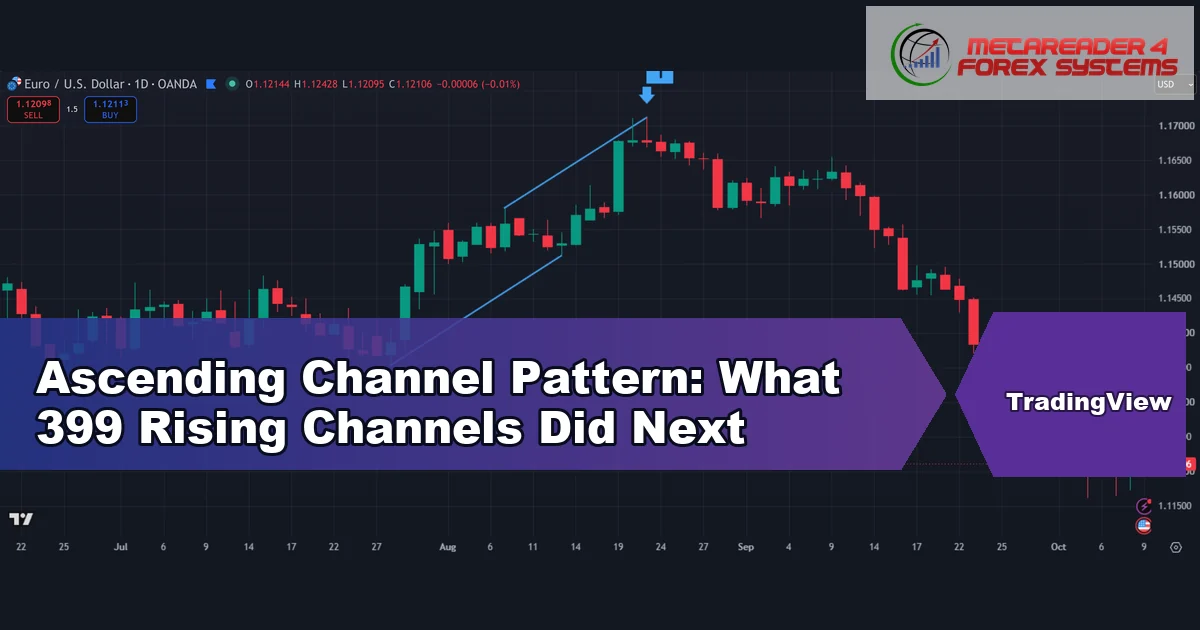
An ascending channel pattern is two rising, roughly parallel lines: one joins higher peaks, the other joins higher troughs, and price climbs between them. This guide settles what happened next …
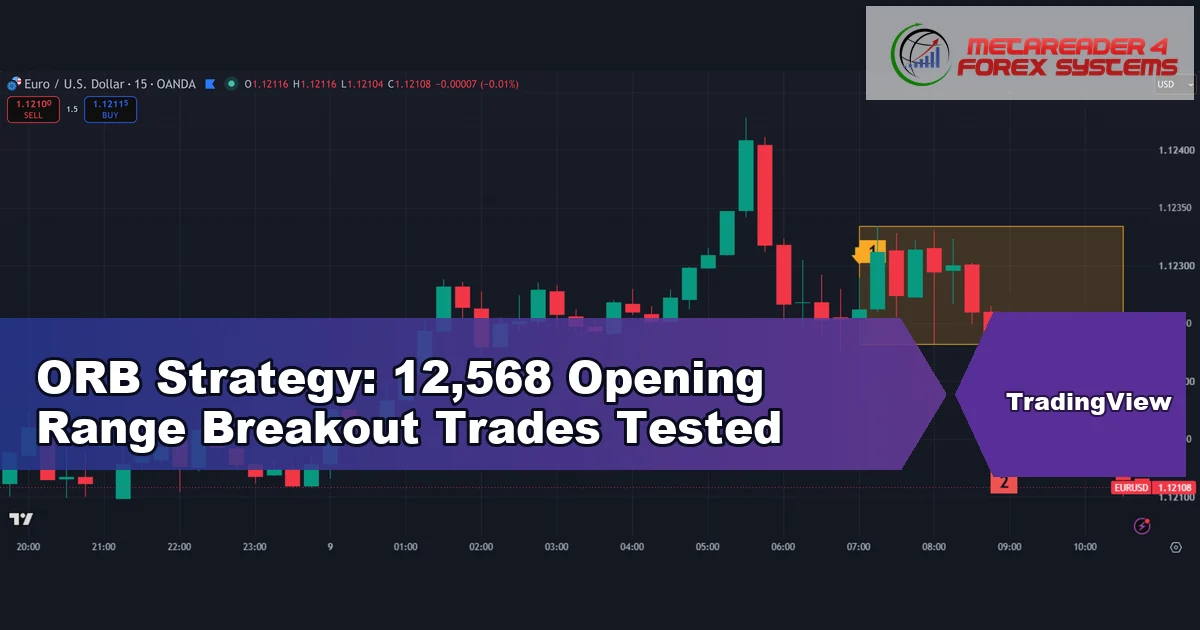
An ORB strategy trades the first break of the price range set in the opening minutes of a session. This guide settles one question with our own data: does the …
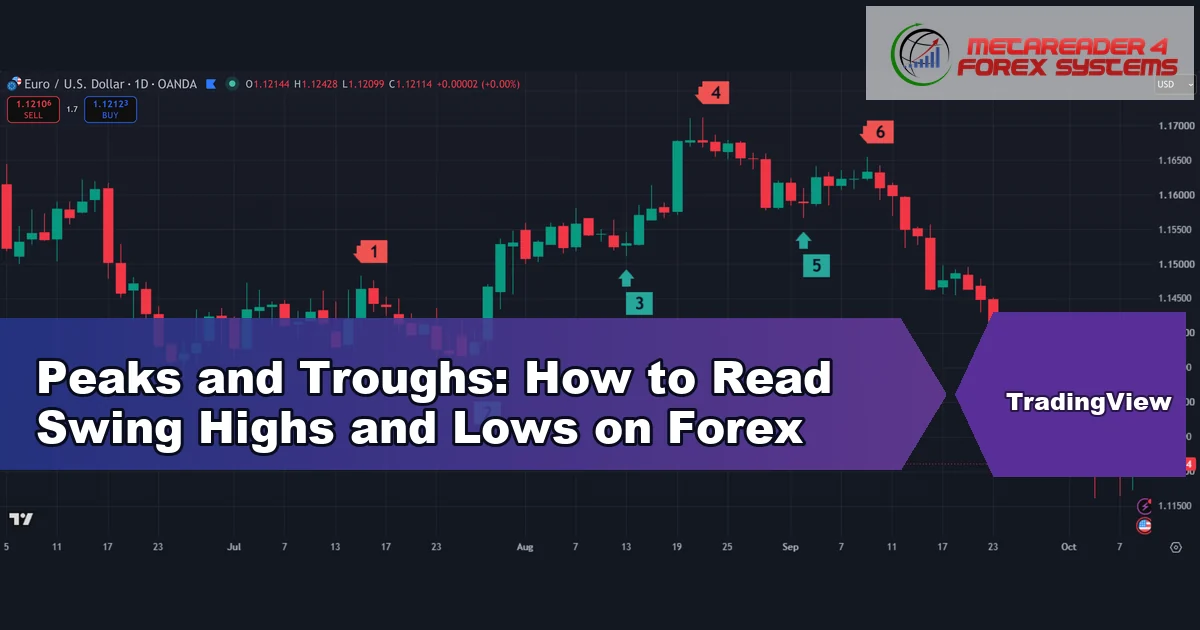
Peaks and troughs are the turning points of a price chart: a peak is a swing high and a trough is a swing low. This guide settles three things. First, …
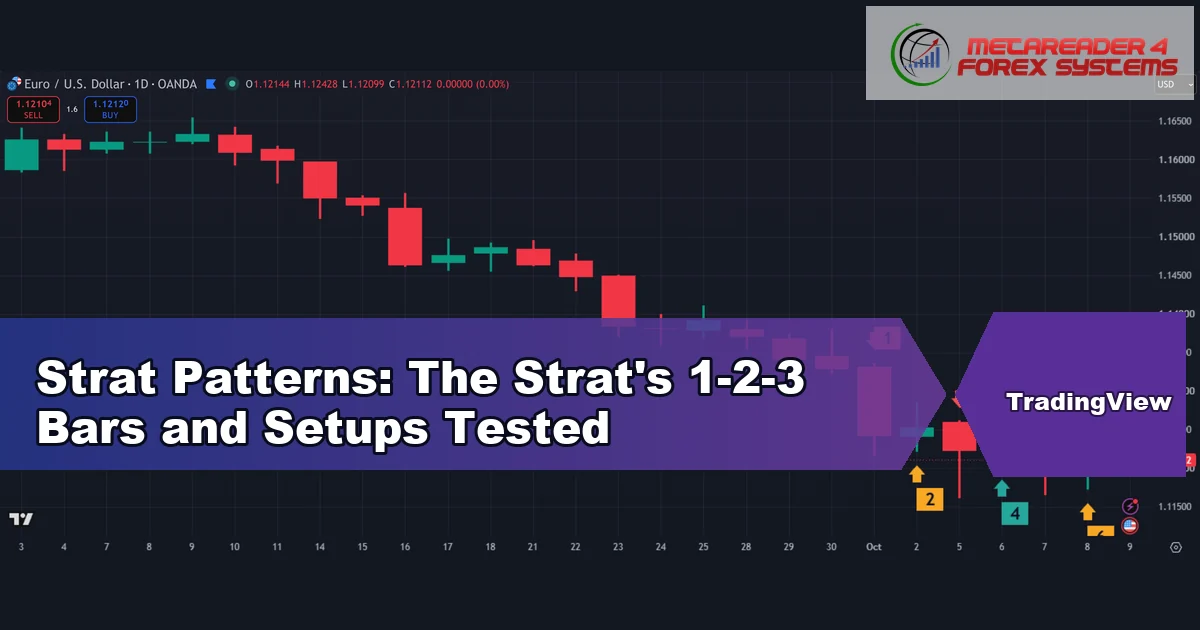
Strat patterns are short chains of numbered bars, where each number says how one bar relates to the bar before it. The method comes from The Strat, the bar-counting approach …
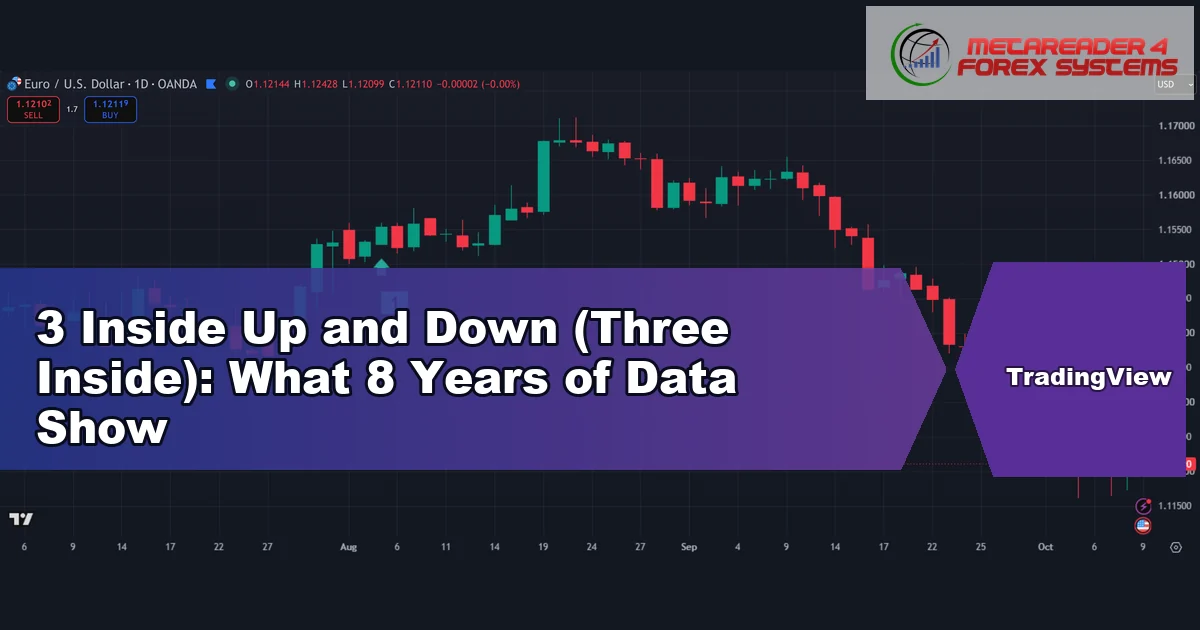
The 3 inside pattern, also called three inside up and down, is a three-candle reversal signal: a harami followed by a candle that closes past the first candle’s open. This …
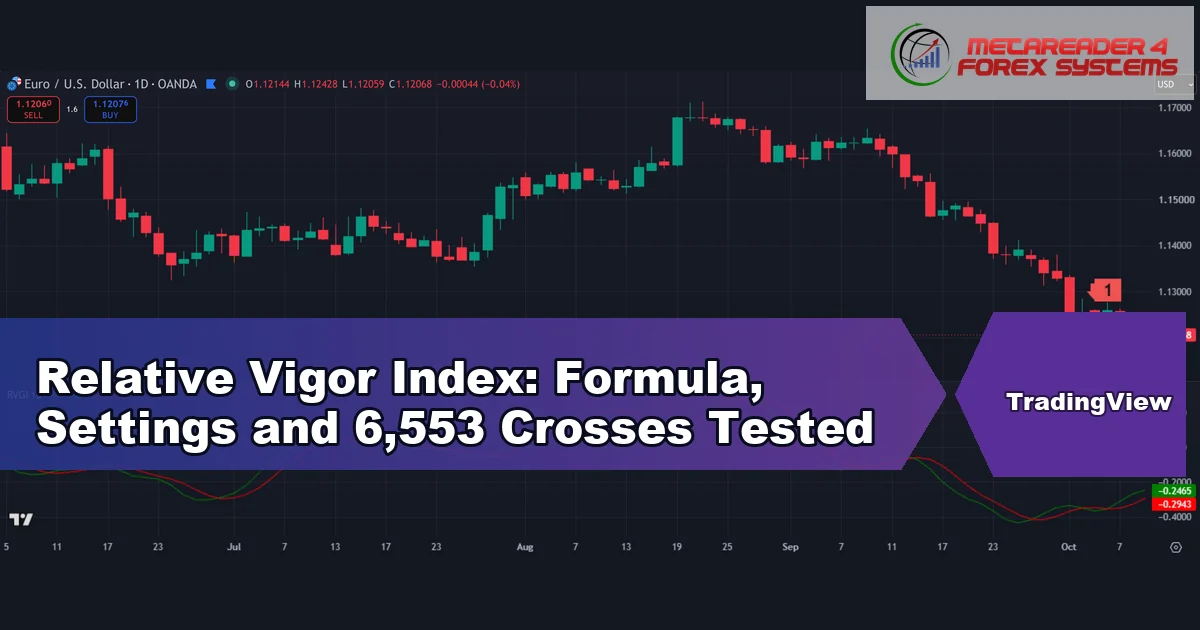
The relative vigor index (RVI) asks one plain question of every bar: did it close nearer its high or its low, compared with where it opened? This guide settles what …
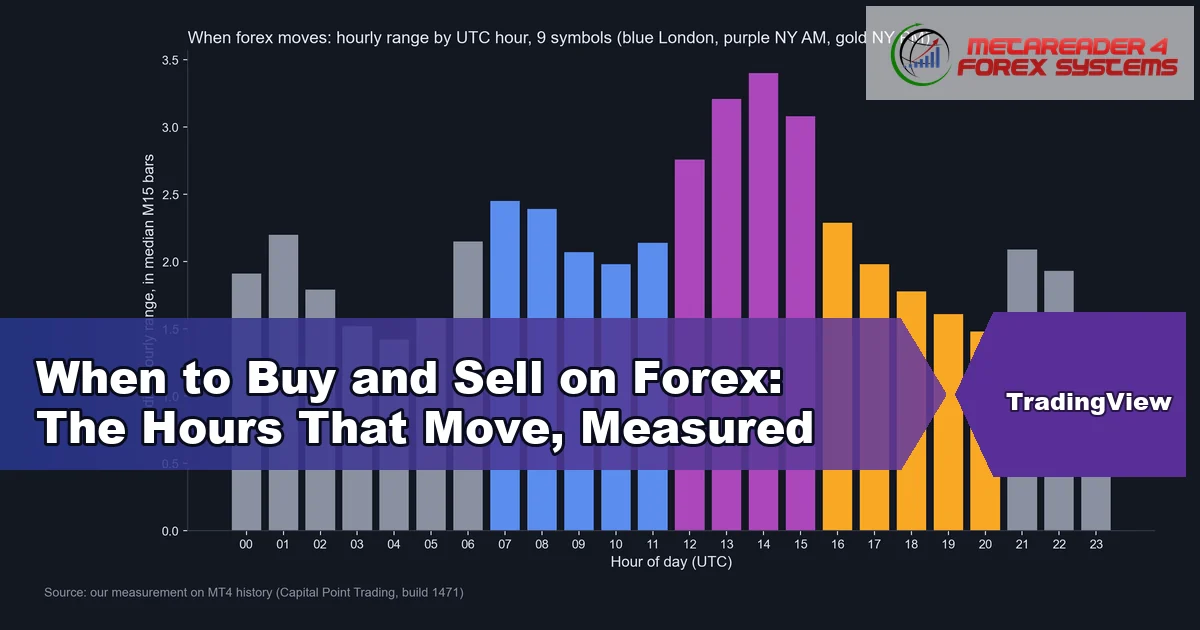
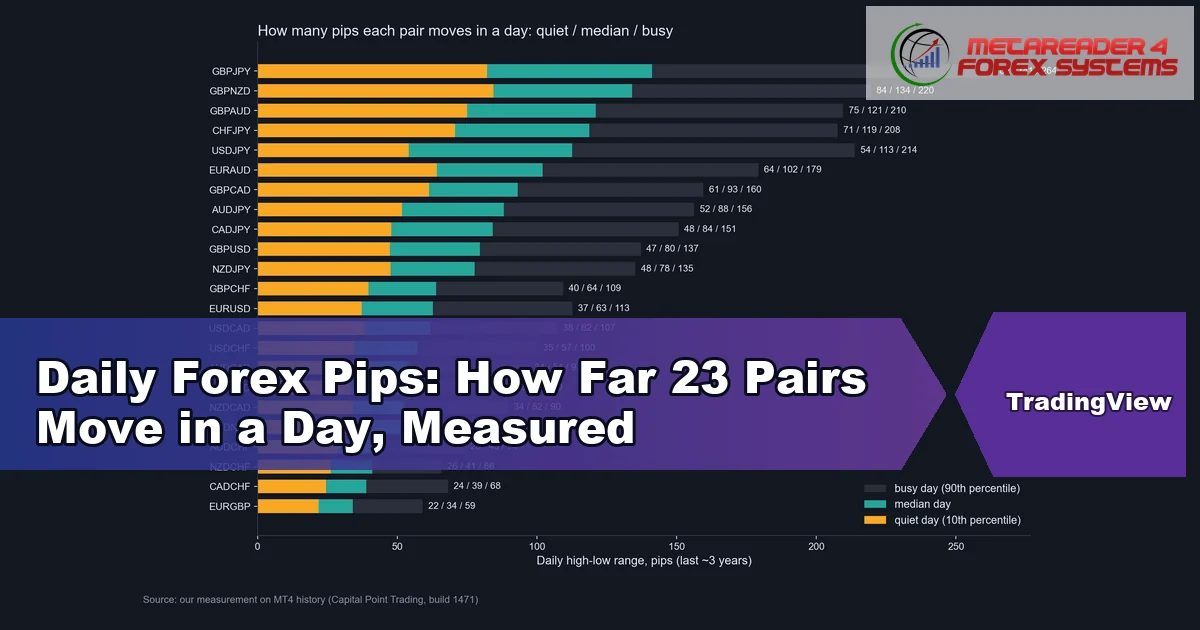
When to buy and sell on forex is really a question about time: which hours of the day the market actually moves, and which hours it mostly sits still. We …
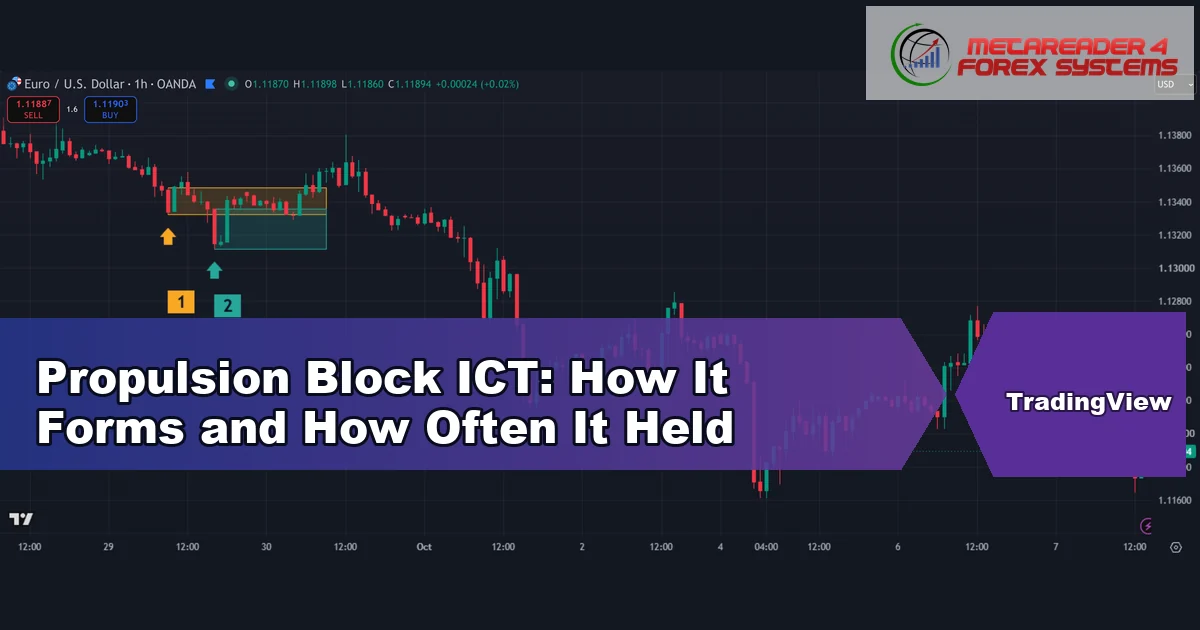
A propulsion block ICT setup is an order block that forms inside an earlier order block and then launches price away. This guide settles three things: what the pattern looks …
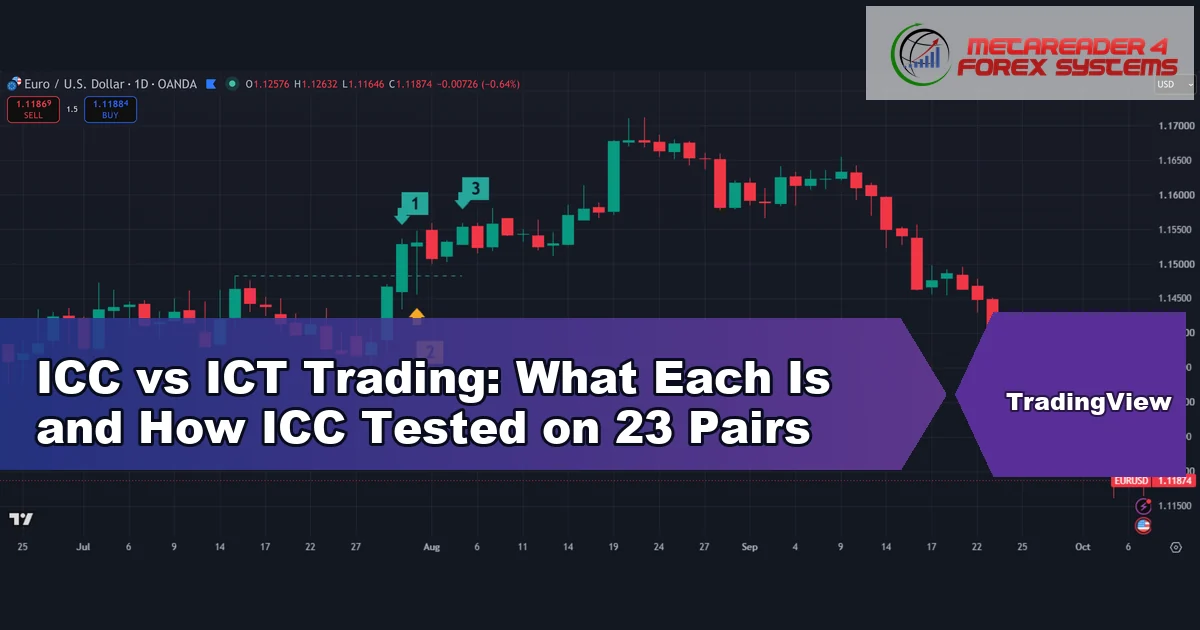
ICC vs ICT trading is a question about two very different things: ICC is a three-step entry pattern, while ICT is a whole vocabulary of price ideas. ICC stands for …
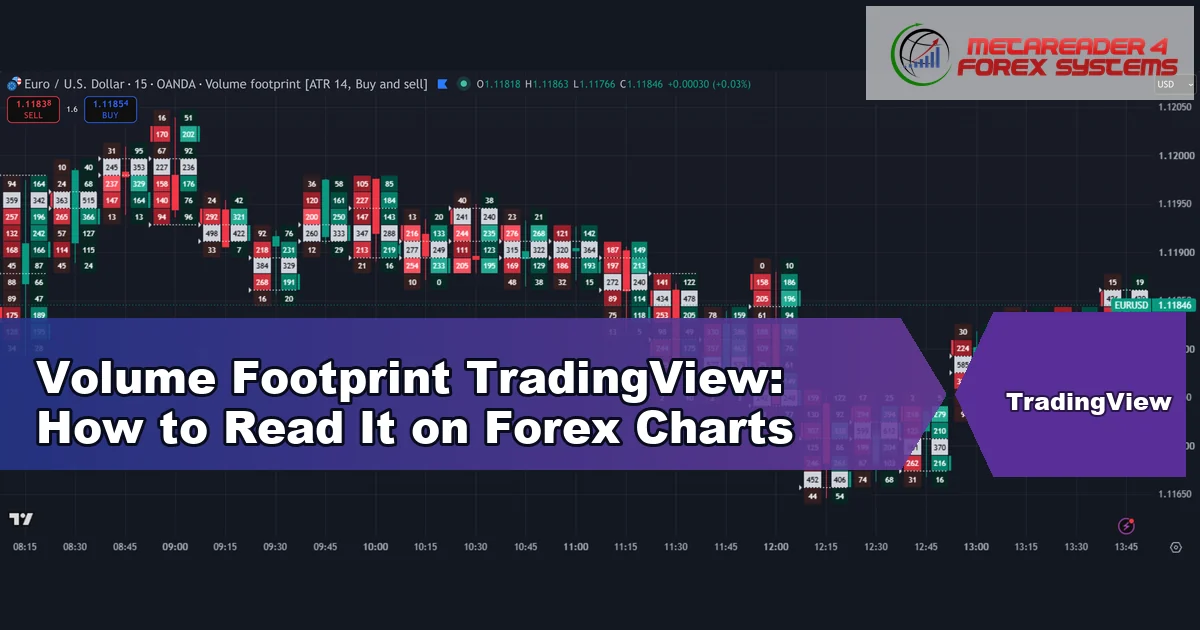
The volume footprint TradingView chart type splits every candle into price rows and prints how much volume traded at each row, divided into a buy side and a sell side. …
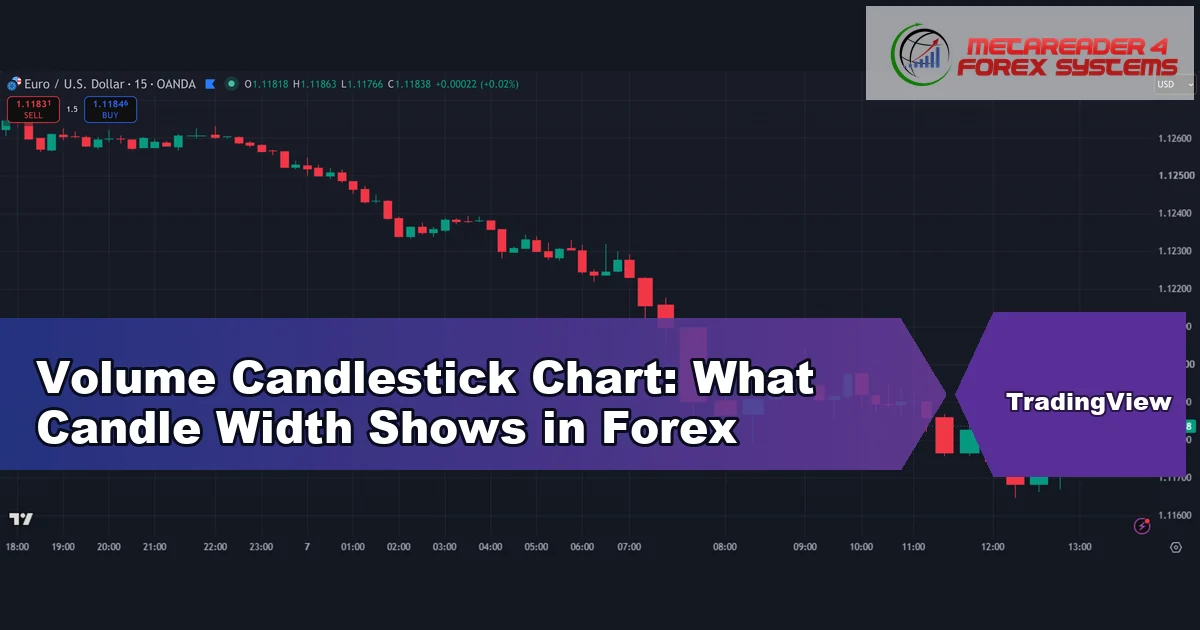
A volume candlestick chart draws each candle with a width that grows with the volume traded in that bar, so price and activity sit in one picture. This guide settles …
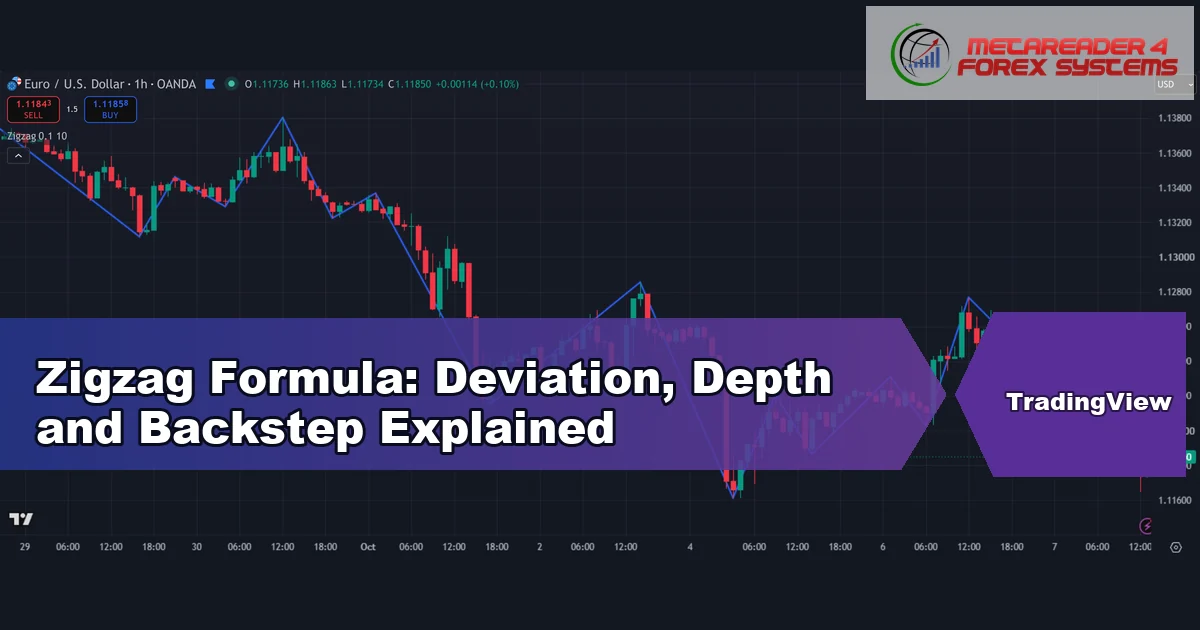
The zigzag formula is simple: a new swing starts only after price turns back by a set amount from the last high or low. This guide settles three things. First, …
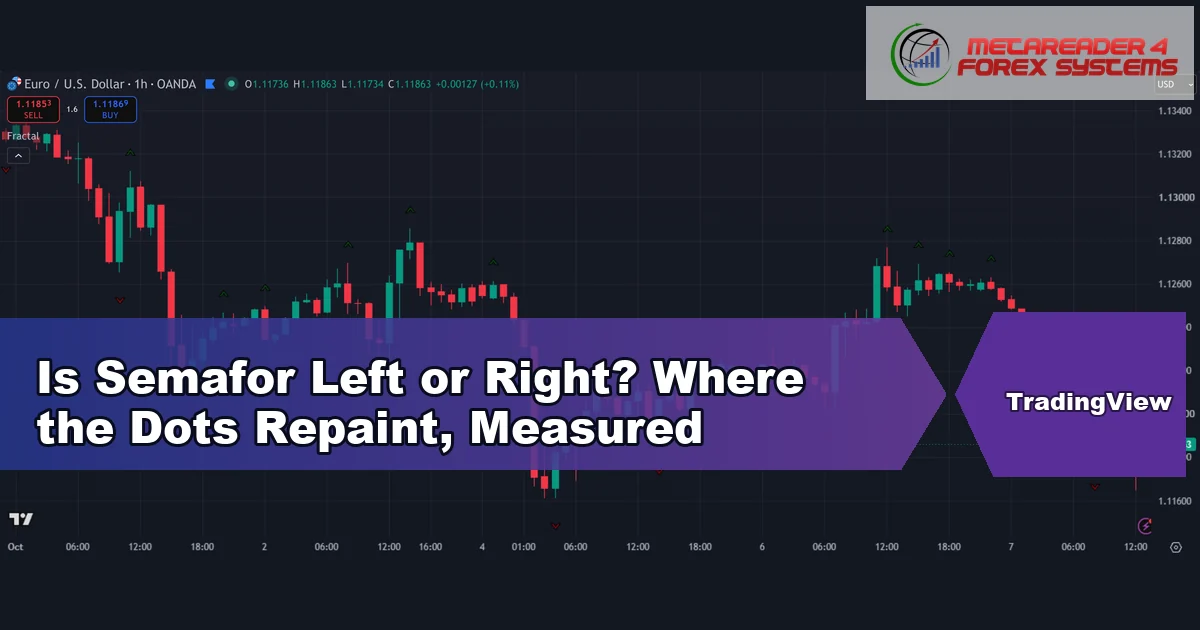
Is Semafor left or right when it repaints? The answer is right. A Semafor dot can move, vanish or reappear only on the newest bars at the right edge of …
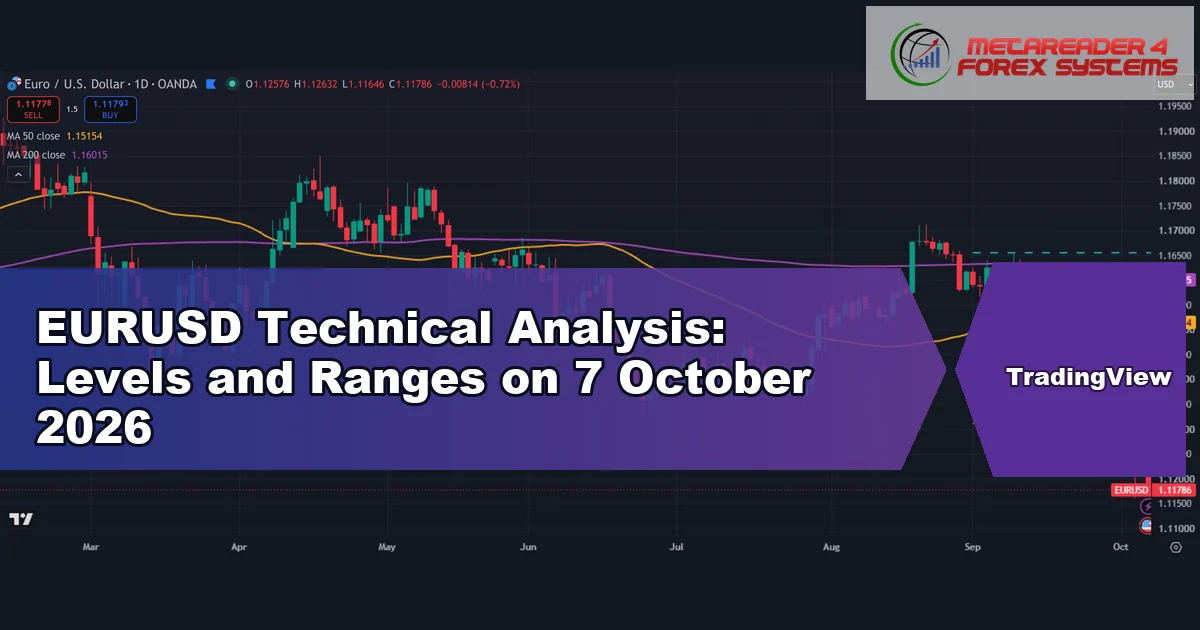
EURUSD technical analysis is a structured read of the euro-dollar chart: where price sits against its averages, its recent highs and lows, and its normal daily range. This guide settles …