
USOIL is the ticker charting platforms use for a West Texas Intermediate (WTI) crude oil price, but on TradingView it is a reference series, not a contract you can buy. This article settles what the symbol is and how it differs from the NYMEX future, Brent and a broker’s CFD. It also shows what its numbers looked like up to 3 November 2026. For chart setup, see our crude oil TradingView guide.
What USOIL actually is
On TradingView the full symbol is TVC:USOIL. The chart header calls it “CFDs on WTI Crude Oil”, and TradingView’s USOIL symbol page lists it under the TVC source. However, that name misleads. TVC:USOIL is a price line for charts. You cannot open a position in the line itself, and every daily bar in our download shows zero volume.
So three things share one idea. First comes the benchmark, the NYMEX WTI future. The CFTC staff report on the NYMEX WTI contract calls it the central benchmark for domestic crude. Each contract covers 1,000 barrels of deliverable oil, priced in US dollars, with delivery at Cushing, Oklahoma. Second comes TVC:USOIL, the chart series. Third comes any broker product with USOIL or WTI in its name: a CFD with the broker’s own size, costs and rules.
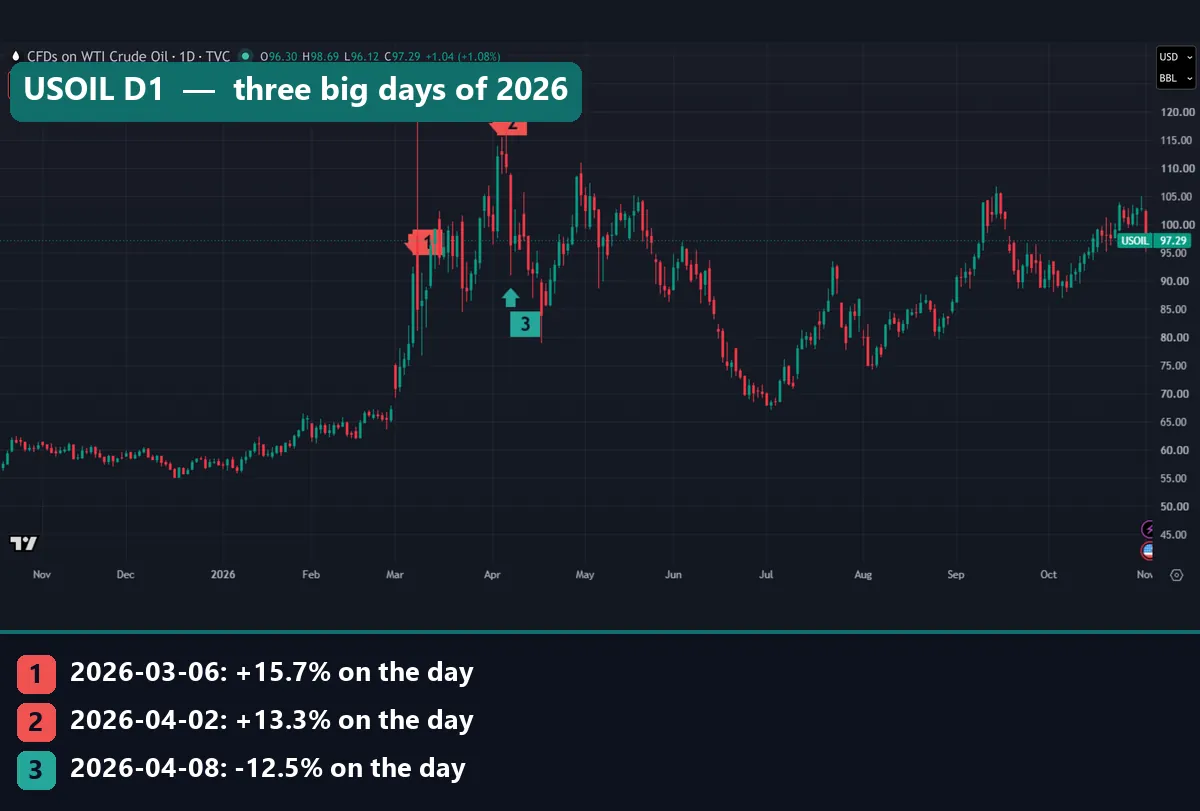
The first chart shows why the symbol gets attention this year. Marker 1 is 6 March 2026 (+15.7%), marker 2 is 2 April (+13.3%) and marker 3 is 8 April (-12.5%). The tall wick beside marker 1, near 120 on the axis, belongs to the next session. A fourth big day, 17 April (-9.9%), has no marker. We measured these moves, not their causes. Also, the SELL and BUY boxes belong to TradingView’s screen, not your broker.
How USOIL relates to the WTI future
A futures contract expires, so one contract cannot make a long chart. NYMEX:CL1! solves that by joining each front month into one line. USOIL also gives one unbroken WTI line, but the symbol page does not explain how TradingView builds it. So we treat it as a black box and measure it against CL1!.
The two stay close on most days. Since 2025, the median gap between their daily closes was $0.19, across 461 days. On 3 November 2026, the header rows on both charts read open 96.30, high 98.69 and low 96.12. Only the last price differed, 97.29 against 97.37, and we took those screenshots minutes apart.
Because the series tracks WTI, the contract arithmetic gives a handy yardstick:
value of a $1 move = 1,000 barrels x $1 = $1,000 per full contract
However, a broker CFD can use a different size, so check its specification first. Our page on the difference between forex and futures covers size and expiry across products.
How we tested
We pulled all bars from the TradingView web chart on 3 November 2026 and ran every figure ourselves. TVC:USOIL gave daily bars from 24 December 2002 and one-hour bars from 16 June 2023. Its 15-minute bars start on 30 November 2025. All three end on 3 November 2026. We also pulled TVC:UKOIL, NYMEX:CL1! and OANDA pairs for comparison.
Daily range means high minus low, as a percent of the close. The hour table groups one-hour bars by New York hour. For the weekly report slot, we compared the 15-minute bar at 10:30 New York on 48 Wednesdays with the same bar on 190 other weekdays. Correlations use daily returns since 2023, across 962 days (961 for Brent).
We placed no trades, so every figure is a price measurement before spread, swap and commission. The intraday screenshot shows UTC on its axis. We drew the two bar charts from these measurements. Our method follows the site’s editorial testing policy.
USOIL against the symbols it gets mixed up with
This table lines up the parameters that matter. We return to the 20 April 2020 row below.
| Parameter | TVC:USOIL | NYMEX:CL1! | TVC:UKOIL | Broker CFD |
|---|---|---|---|---|
| What it is | WTI chart series | WTI front-month future, rolled | Brent chart series | A contract with your broker |
| Can you hold it? | No | Yes, through a futures account | No | Yes, on that broker’s terms |
| Size | None | 1,000 barrels | None (the ICE future is 1,000 barrels) | Set by the broker |
| Expiry | None shown | Monthly, joined on the chart | None shown | Set by the broker |
| Exchange volume | None | Yes | None | Not exchange volume |
| 20 April 2020 low | 0.009 | -40.32 | Not in our test | Not in our test |
| Use it for | A long WTI price picture | Exchange levels and volume | The Brent comparison | Matching your own fills |
Reading USOIL on a chart
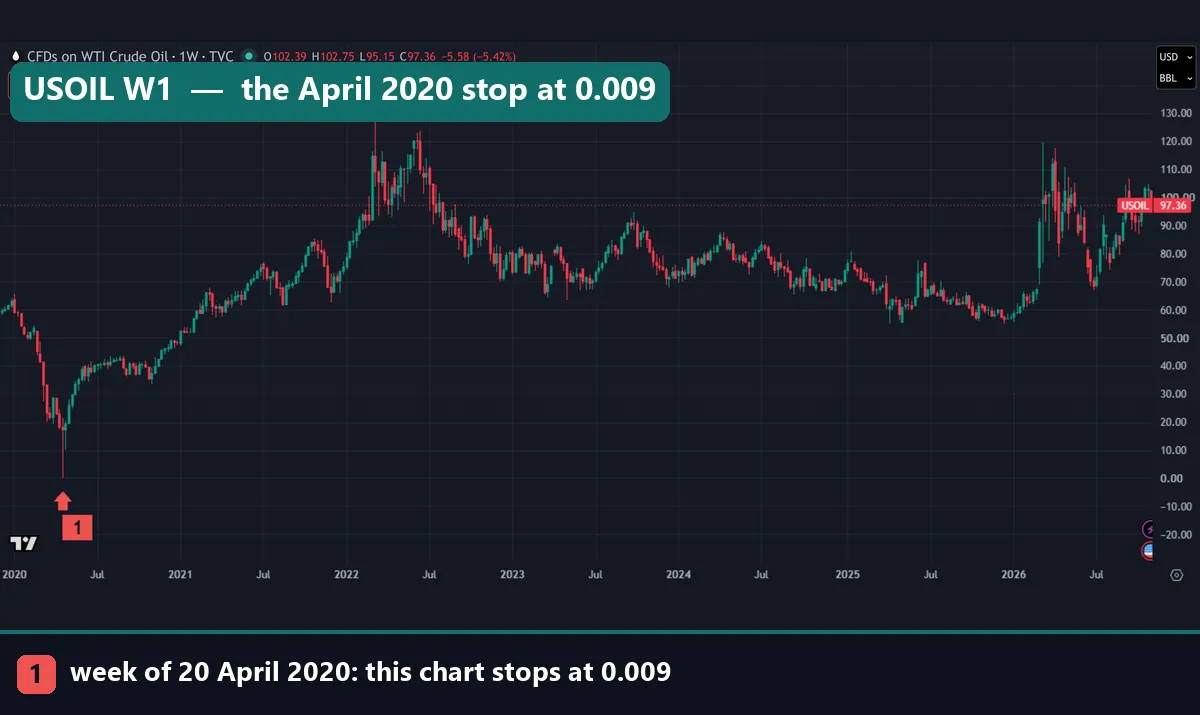
Start wide. The weekly chart runs from 2020 to November 2026. Marker 1 sits on the week of 20 April 2020, where the line stops at 0.009. It then climbs to a wick near 130 in early 2022 and spends 2023 to 2025 mostly between about 55 and 95. Early 2026 breaks that range with a wick near 120. Still, the high in our data is 147.27, on 11 July 2008, before this view begins.
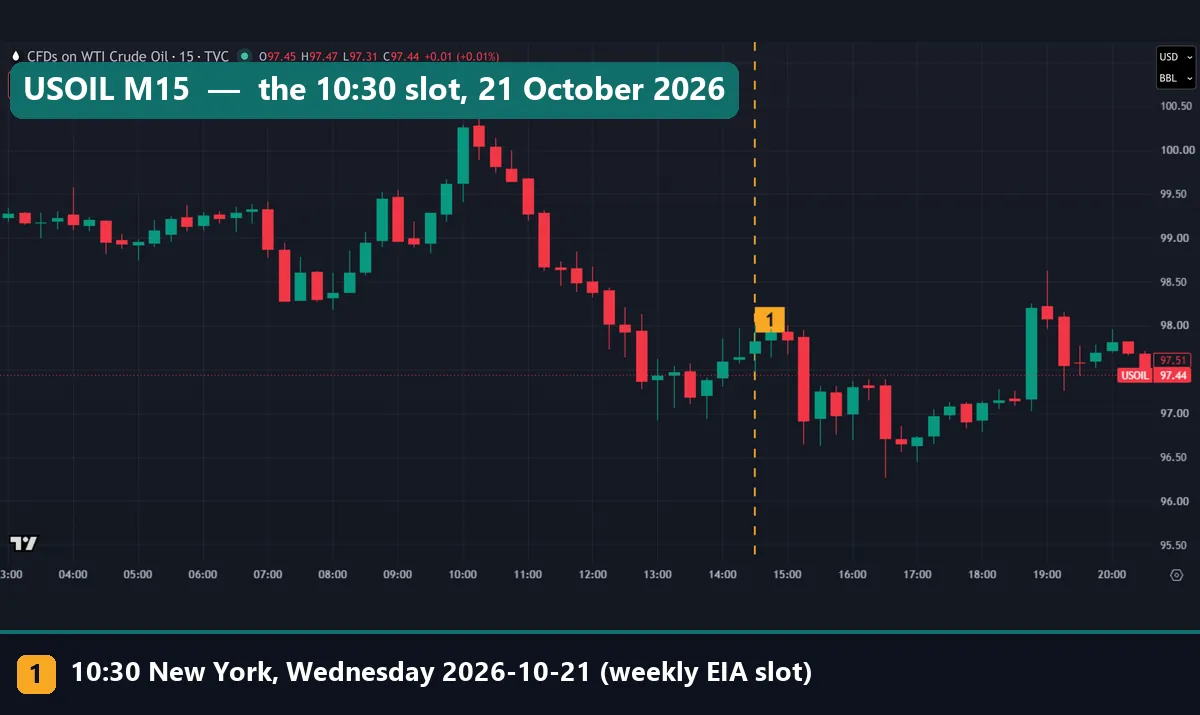
Now zoom in to 21 October 2026. The dashed line marks the 10:30 New York bar, the standard slot for the weekly US oil report. EIA’s Weekly Petroleum Status Report schedule sets that slot at 10:30 a.m. eastern on Wednesdays, with listed exceptions. The axis shows UTC, so the line sits at 14:30. New York changed its clocks on 1 November 2026, so the slot now falls at 15:30 UTC.
The marked bar opened at 97.69, touched 98.00 and 97.47, and closed at 97.82. That range of $0.53, about 0.54% of price, looks ordinary. The widest bar after the line comes 45 minutes later, about $1.30 from top to bottom. By 11:30 New York the close was 96.92. We cannot tie that bar to the report, so treat this as one day, not a rule.
Worked example: six USOIL Wednesdays, then dollars
Here is the report slot over the last six Wednesdays in our data. The last column compares the close one hour later with the 10:30 bar’s open.
| Wednesday | Open | High | Low | Range | Close 1h later | Change from open |
|---|---|---|---|---|---|---|
| 23 Sep 2026 | 92.11 | 92.19 | 91.54 | $0.65 | 92.66 | +0.55 |
| 30 Sep 2026 | 91.36 | 91.74 | 91.04 | $0.70 | 91.55 | +0.19 |
| 7 Oct 2026 | 89.87 | 89.90 | 89.40 | $0.50 | 89.39 | -0.48 |
| 14 Oct 2026 (no report) | 95.29 | 95.44 | 94.78 | $0.66 | 95.12 | -0.17 |
| 21 Oct 2026 | 97.69 | 98.00 | 97.47 | $0.53 | 96.92 | -0.77 |
| 28 Oct 2026 | 102.41 | 102.58 | 102.16 | $0.42 | 102.61 | +0.20 |
Three rows went up and three went down, so the slot gave no direction. Now look at 14 October. EIA’s schedule moved that week’s report to Thursday 15 October at 12:00 p.m., so that bar had no report. Yet its $0.66 range was the second widest of the six.
Next, convert percentages to dollars, using the last close in our data, 98.15. The 750-day median daily range of 2.87% is about $2.82. The 2026 median of 4.74% is about $4.65. On a full 1,000-barrel future, those are $2,820 and $4,650. Meanwhile, the Wednesday 10:30 bar has a median of 0.571%, about $0.56, against 0.553%, about $0.54, on other days. So at this price the slot adds about two cents to a typical bar.
These conversions fit today’s price only, since crude traded elsewhere in those months. To turn a range into a trade size, try our futures position size calculator.
When USOIL moves: the hours and the Wednesday slot
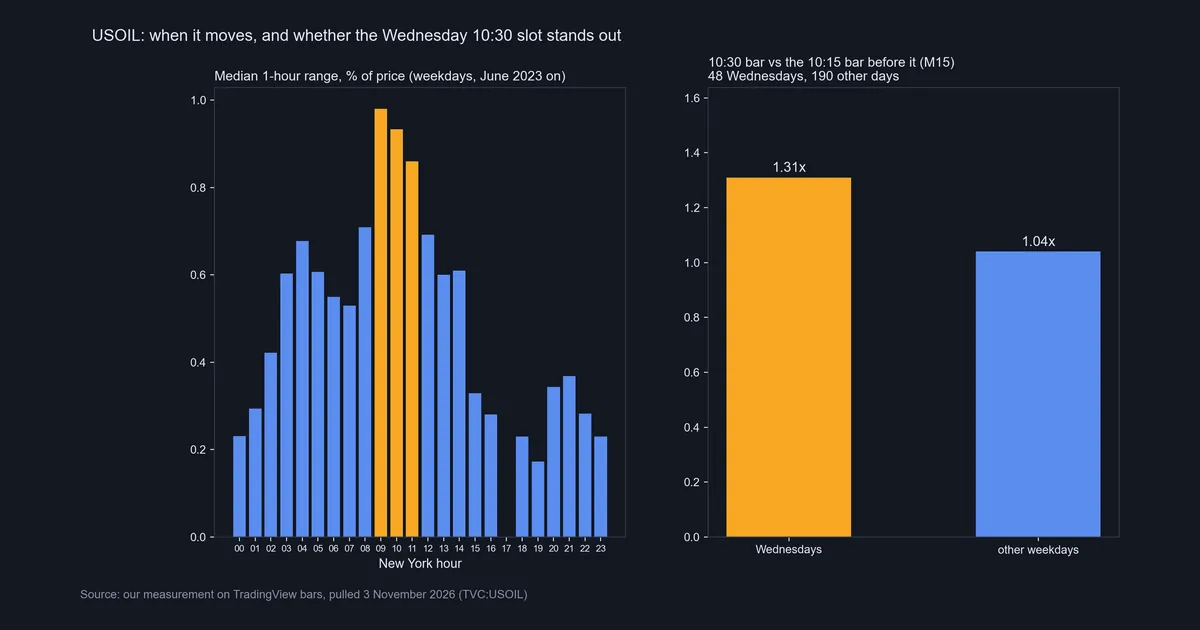
The left panel shows the median one-hour range by New York hour, from June 2023 on. The gold bars mark the busiest three: 09:00 at 0.98%, 10:00 at 0.93% and 11:00 at 0.86%. By contrast, the quietest hour is 19:00 at 0.17%, so the busiest runs more than five times wider. The 17:00 column stays empty because the series has no bars there. Our New York session guide covers those hours.
The right panel tests the report slot. Against the 10:15 bar just before it, the 10:30 bar ran 1.31x on Wednesdays and 1.04x on other weekdays. So there is a bump. But against the same bar on other days, Wednesday’s bar was only 1.03x. The next hour agrees: the median move from that bar’s open was 0.46% on Wednesdays and 0.47% on other days.
In short, the report shows up as a modest step inside a busy hour, not as a spike. Our older crude chart guide saw wide bars around the slot on three Wednesdays. With 48 Wednesdays, most of that fades.
Holiday weeks shift the report, and we did not remove them. EIA’s schedule lists six moved releases inside our window, so some of the 48 Wednesdays carried no report. The next exception is Thursday 12 November 2026 at 12:00 p.m. Our guide on how to read an economic calendar helps you catch these shifts.
What USOIL moves with, and how wide 2026 has been
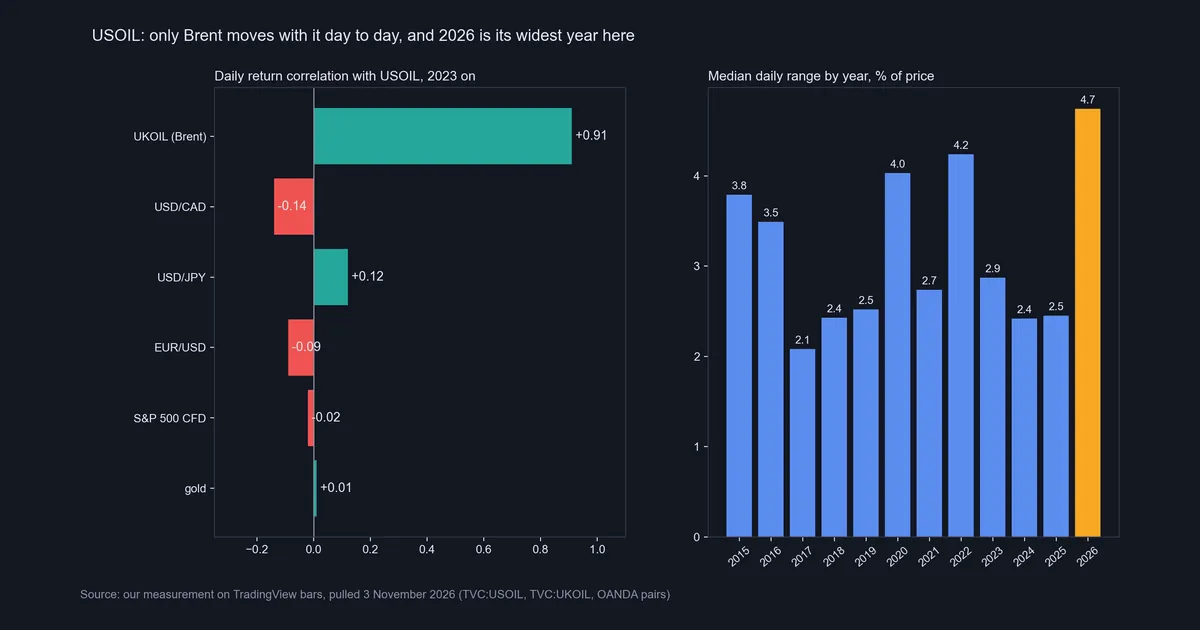
The left panel ranks daily return correlations with USOIL since 2023. Brent is the only close partner, at +0.91. USD/CAD sits at only -0.14. Then come USD/JPY at +0.12, EUR/USD at -0.09, the S&P 500 CFD at -0.02 and gold at +0.01.
The weak USD/CAD figure goes against a common teaching. Many traders expect the pair to fall when crude rises. Our guide to commodity currencies and our note on forex and commodity correlations explain that idea. Still, on daily data since 2023 the sign fits and the size is small. We did not test longer windows. To check your own pairs, start with our currency correlation guide.
The right panel shows median daily range by calendar year. 2024 printed 2.42% and 2025 printed 2.45%. Then 2026 jumped to 4.74%, the widest year in a table that starts in 2015. That year is not over yet. So the 750-day median of 2.87% understates this year.
Download the complete indicator database
Put these concepts on your charts. One email unlocks the full library of 1,380+ indicators with compiled MT4 and MT5 files, plus my TradingView scripts. No paywall, no spam, unsubscribe any time.
Get free access to my indicator database
One email unlocks 1,380+ free MT4, MT5 and TradingView indicators — the complete library. No single-tool download; you get the whole database.
Where it fails
- It is not a fill. TVC:USOIL is a chart line. Your broker’s price and roll dates can differ, spreads widen in thin hours, and holding costs apply, so read our page on swap in forex.
- It can hide extremes. The line stopped at 0.009 on 20 April 2020 while the future closed at -37.63. So a backtest on USOIL alone never sees that day’s real risk.
- It has no volume. Any volume study on this symbol reads nothing, so use the future for that work.
- Percent moves depend on the feed. Our +15.7% day uses USOIL’s own closes, and the same date on CL1! gives a different figure.
- Our Wednesday sample is short. It covers 48 Wednesdays in under a year, in an unusually wide year, and it still holds the holiday weeks.
Brent on the same months: the UKOIL chart
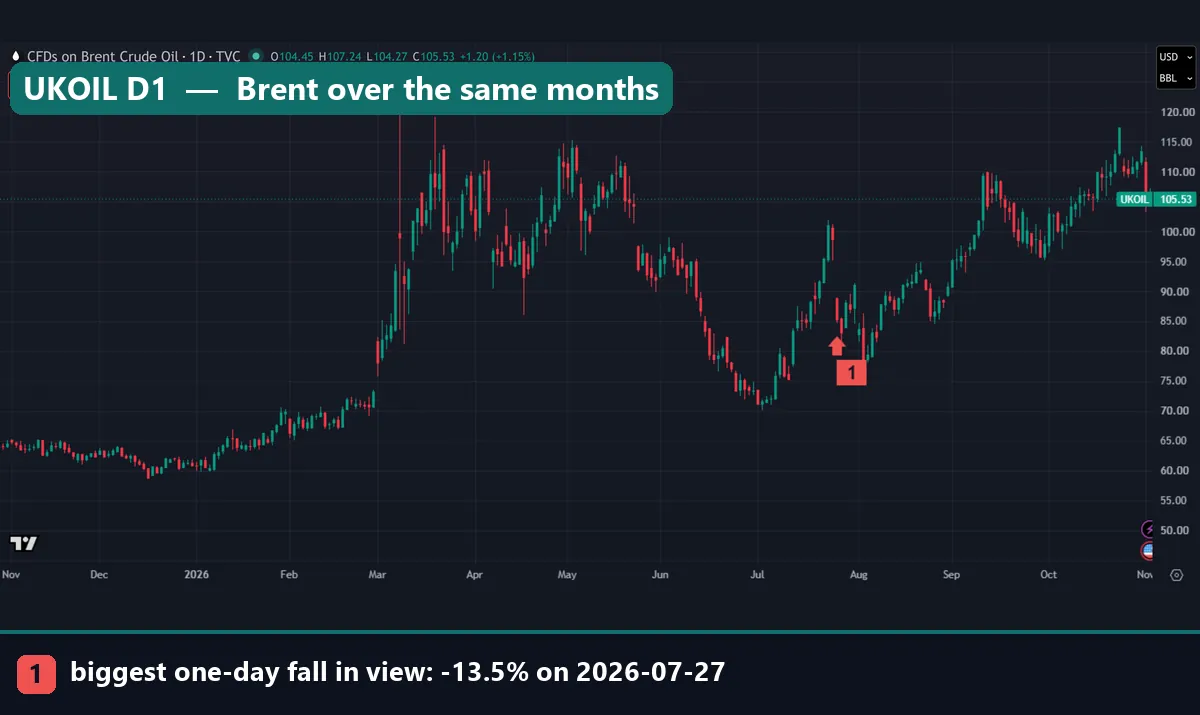
TVC:UKOIL is the Brent partner of USOIL. ICE’s Brent Crude Futures specs describe a 1,000-barrel deliverable contract based on EFP delivery, with an option to cash settle against the ICE Brent Index. They name the hub as the North Sea. WTI, by contrast, delivers inland at Cushing.
The two shapes look alike, which fits the +0.91 correlation. The gap between them does the moving. Since 2023, Brent minus WTI had a median of $4.02 across 961 days. It ranged from -6.90 to +13.94, and Brent closed below WTI only for a short stretch in April 2026. At our capture on 3 November, UKOIL showed 105.53 and USOIL 97.44. That gap of $8.09 is about twice the median.
Marker 1 flags the biggest one-day fall in view: -13.5% on 27 July 2026. USOIL’s list of biggest moves since 2022 has no entry for that day, and its smallest entry is 9.9%. So the two lines can split hard for a day. The Brent bar also opens well below the prior close and leaves a visible hole. A contract roll can do that as well as news can, and we did not test which applied here.
20 April 2020: where USOIL and the future split
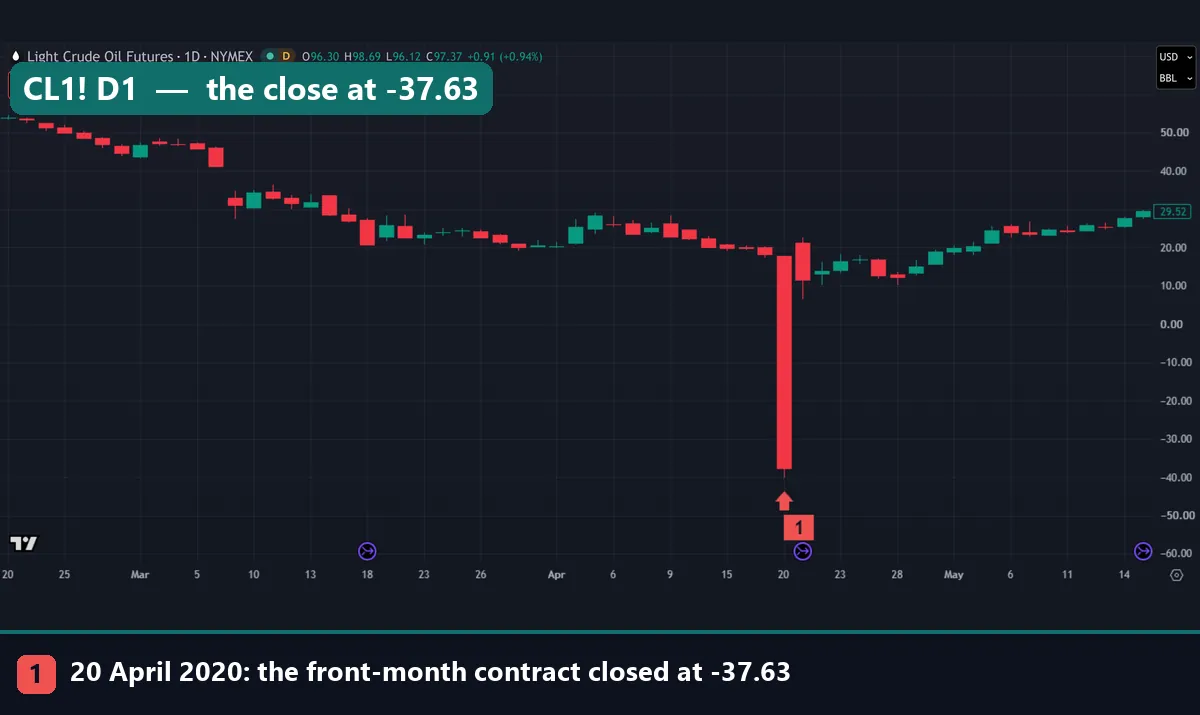
This is the clearest proof that USOIL is a reference line. At marker 1, the NYMEX:CL1! bar falls through zero and closes at -37.63, with a low of -40.32. On that same date, TVC:USOIL stops at 0.009 for both its low and its close. Ignore the header row here, because it shows the 3 November 2026 bar.
The CFTC staff report gives the context. The May contract opened that session at $17.73 and settled at -$37.63, on its second-to-last day. The report calls this the first negative price since the contract’s listing 37 years earlier. All other expirations settled above zero. It describes several factors coming together: oversupply, a sharp fall in demand during COVID-19 shutdowns, and storage at Cushing near capacity.
So a study on USOIL sees April 2020 as a dip to nearly zero, not a day when the future went below it. We did not test how broker CFDs behaved.
Common USOIL mistakes
- Calling USOIL a contract. It is a chart series. Before you size anything, find the product you will really hold and read its terms.
- Treating 10:30 Wednesday as a spike. Across 48 Wednesdays, the bar was only 1.03x the same bar on other days. Compare that with a true forex news spike, and plan for a busy hour instead.
- Trading USD/CAD off an oil chart. A daily correlation of -0.14 is too weak to act as a signal, so test the link on your own timeframe first.
- Sizing with last year’s range. The median daily range went from 2.45% in 2025 to 4.74% in 2026, nearly double. A stop that fit 2025 can sit inside a normal day now, so recheck the range and read our page on position sizing.
Where to go next
First, set up the chart with our crude oil TradingView guide, which covers symbols, rolls and ATR in more depth. If you plan to trade a broker product, read what CFDs are before anything else. Then check the primary sources linked above: EIA, the CFTC and ICE.
FAQ: USOIL questions answered
What is USOIL?
It is a ticker for a WTI crude oil price on charting platforms. On TradingView, TVC:USOIL is a reference series, not a contract you can buy.
Is USOIL the same as CL1!?
No. CL1! is the rolling front-month NYMEX future, and USOIL is a separate chart series. Their daily closes differed by a median of $0.19 since 2025.
Can I trade USOIL on TradingView?
You cannot hold the TVC line itself. Any trade happens in a future or a broker’s CFD, each with its own terms.
What is the difference between USOIL and UKOIL?
USOIL tracks WTI and UKOIL tracks Brent. Their daily returns correlated at +0.91 since 2023, and Brent minus WTI had a median of $4.02.
When does USOIL move the most?
Our hourly table puts the busiest New York hours at 09:00 to 11:00. The median one-hour range there runs from 0.86% to 0.98%.
Does the EIA report move USOIL?
A little. The Wednesday 10:30 bar ran 1.31x the bar before it, against 1.04x on other days. Yet it was only 1.03x the same bar on other days.
Did USOIL go negative in April 2020?
No. It stopped at 0.009 on 20 April 2020, while NYMEX:CL1! showed a low of -40.32 and a close of -37.63.
Does USOIL predict USD/CAD?
Not on our daily data, where the correlation since 2023 was only -0.14. Treat any rule built on it with care; results are not guaranteed; past performance is not indicative of future results.
Last updated: 3 November 2026.

About the author
Written by Dominic Walsh, a Forex trader and MT4/MT5 indicator, Expert Advisor and script developer. Every tool on forexmt4systems.com is tested on live charts before release and ships with ready-to-use compiled MT4 (.ex4) and MT5 (.ex5) files. Learn more about the trader and developer behind this site.
How we build, test and correct every tool: Editorial & Testing Policy. Trading carries risk; see the disclaimer.