
Some currencies rise and fall with the price of what their country digs up or grows. Traders call these commodity currencies, and the label explains a great deal while hiding a few things worth knowing.
This guide covers which names qualify and why. It also covers where the shorthand stops working, because it stops working more often than most write-ups let on.
What Commodity Currencies Are
The term covers currencies of countries that lean heavily on raw exports. Think oil, gas, metals, ore and farm goods rather than cars or software.
When those export prices rise, the country earns more for the same shipments. That extra income tends to reach the currency, though it takes a slow route to get there.
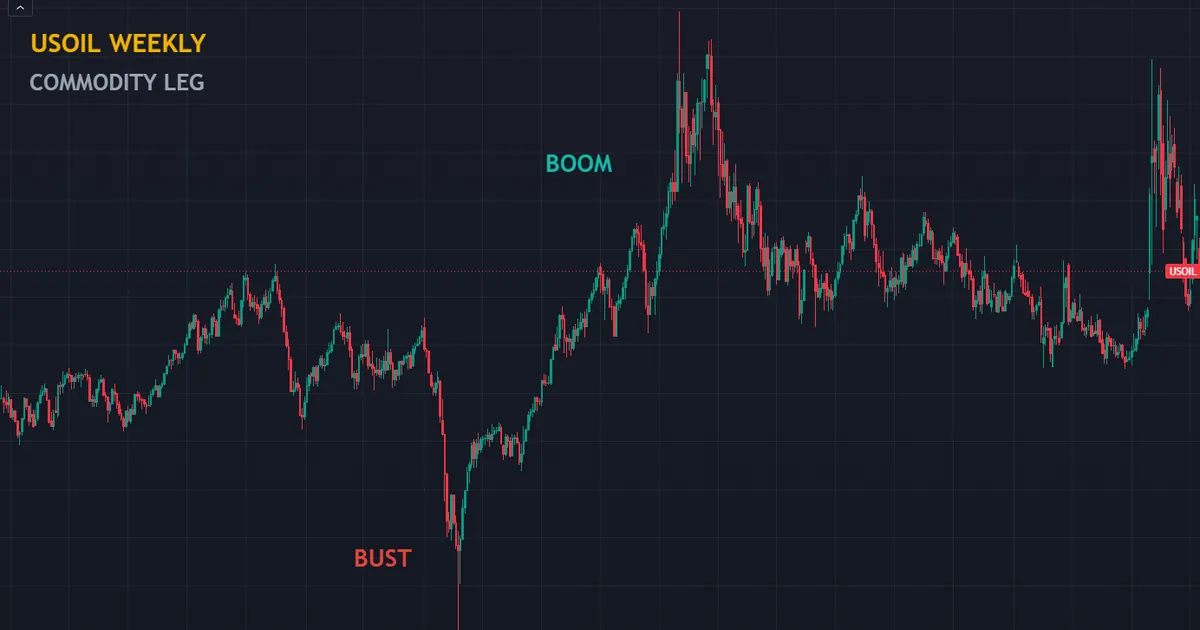
Above sits crude oil on a weekly chart, the export leg behind several of these names. Notice the long booms and the long busts, since that rhythm shapes the currencies tied to it.
The Short Definition
A currency earns the label when raw exports make up a large share of what the country sells abroad. No official list exists, and no threshold decides membership.
So the term describes a tendency rather than a category. Traders use it as shorthand, and shorthand always loses detail.
The Test That Matters
Ask one question about any candidate. What share of the country’s export earnings comes from a handful of raw goods?
A high share means the mechanism has something to work with. A low share means the label rests on habit rather than on trade data.
Run that check yourself now and then. Export mixes shift over decades, and a name that fitted the label in 2005 may fit it poorly today.
How Export Concentration Shapes a Currency
The chain runs through income and policy rather than through any direct wire. Five steps describe it.
- The export price rises. Iron ore, crude, copper or dairy moves higher on the world market.
- Export earnings climb. The country receives more money for the same volume of shipments.
- The domestic economy firms up. Mining wages, company profits and tax receipts all improve together.
- The central bank shifts its stance. A stronger economy lets policy makers hold rates higher than they otherwise would.
- Money follows the better outlook. Investors buy the currency for its growth and rate story, not for the ore itself.
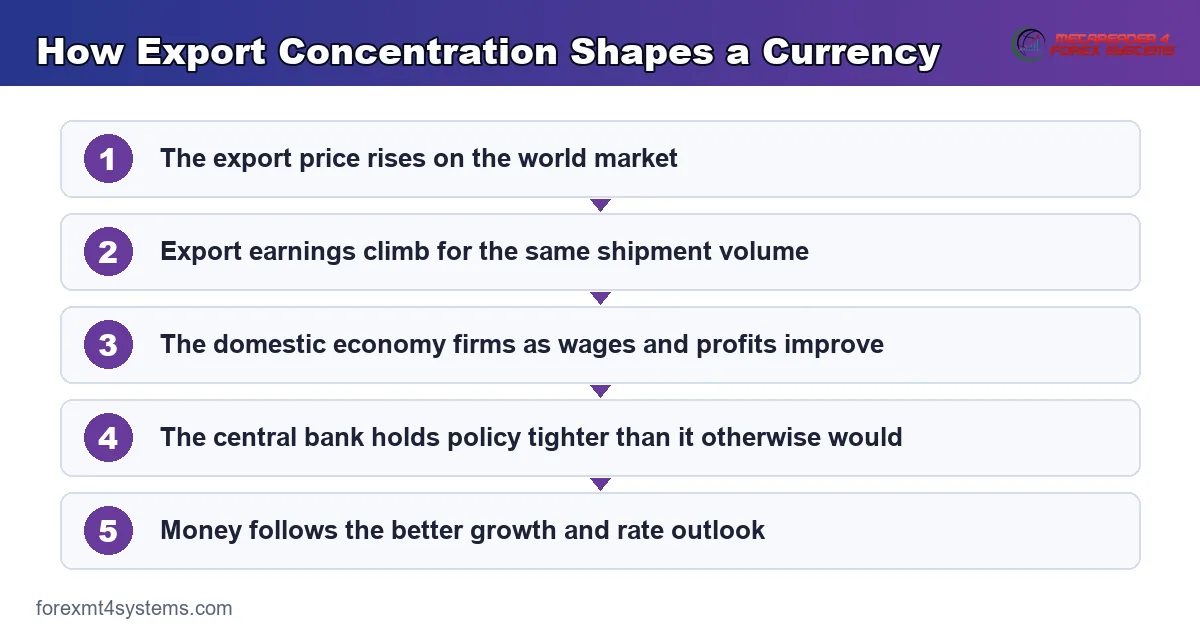
Notice how much sits between step one and step five. Each stage can stall, and any of them can pull the other way.
The Mirror Side Nobody Mentions
Every export has a buyer. A price rise that helps the seller hurts the country paying the bill.
Japan imports nearly all its energy, so a crude rally squeezes its trade balance. India and much of Europe sit in the same position.
So one commodity move creates two currency stories at once. Traders who watch only the seller’s side miss half the picture.
That mirror explains a familiar pattern. A crude rally can lift one dollar and weigh on a yen cross in the very same week, without either move contradicting the other.
Ask who pays the bill before you build a view. The answer often points at a cleaner trade than the obvious one.
The Main Names and Their Exports
Nine currencies come up most often. Each row below shows what actually leaves the country.
| Currency | Leading raw exports | Notes on how it trades |
|---|---|---|
| Australian dollar | Iron ore, coal, gas, gold | Deep and liquid, though it often trades as a China proxy |
| Canadian dollar | Crude oil, gas, lumber | Liquid, and tied tightly to the US economy next door |
| New Zealand dollar | Dairy, meat, wood, wine | Thinner, and quick to swing on global risk mood |
| Norwegian krone | Crude oil and natural gas | Thin, with export income routed into a state fund |
| South African rand | Gold, platinum group metals, coal | Volatile, with a heavy risk sentiment overlay |
| Chilean peso | Copper | One of the most export-concentrated names on the list |
| Brazilian real | Soybeans, iron ore, crude, sugar | High rates draw carry flows alongside the export story |
| Mexican peso | Crude, though manufacturing now leads | Traded far more for carry than for its oil link |
| Russian rouble | Crude oil and natural gas | Restricted at most brokers, so mostly of academic interest |
The first three carry most retail attention. All three trade in decent size, which keeps costs sensible.
Not Every Raw Export Behaves the Same
Lumping ore, crude and milk together hides real differences. Each one reaches a currency by its own route.
Energy Carries the Cleanest Income Story
Oil and gas earn large sums, and they price in dollars everywhere. So a move shows up in national income quickly and clearly.
Buyers cannot switch away in a hurry either. That stickiness makes the income effect firmer than for most other goods.
Gold Sends a Mixed Message
Gold trades as a store of value as much as a raw good. A rally in it often signals fear rather than growth.
So a gold-selling currency can face two opposite pulls at once. Higher export income supports it, while the fear lifting gold pushes traders out of risk.
Farm Goods Follow Weather and Season
Dairy, grain and sugar swing on rain, drought and planting cycles. Those shocks say very little about world demand.
They also fade as the next season arrives. A currency move built on one harvest rarely outlives it.
A Rough Guide to the Four Types
The table below sorts them. Use it to judge how much weight a price move deserves.
| Export type | What usually drives the price | How firmly it reaches the currency |
|---|---|---|
| Energy | Supply decisions and world growth | Firm, since earnings are large and priced in dollars |
| Industrial metals | Building and factory demand abroad | Firm when demand-led, weak when supply-led |
| Precious metals | Fear, real yields and the dollar | Mixed, because the driver can cut both ways |
| Farm goods | Weather, season and stock levels | Loose, and it fades with the next harvest |
A Worked Example: A Commodity-Linked Cross
One cross shows the idea better than any single pair. It sets an export-led currency against a funding one.

Two Opposite Roles
The chart above pairs an export-led currency with a low-yield funding currency. Those two roles pull in opposite directions during any shift in mood.
When traders feel confident, money leaves the funding side and buys the growth side. The cross climbs, sometimes for months at a stretch.
When fear arrives, that flow reverses hard. Traders repay what they borrowed, and the cross drops faster than it rose.
Why It Reads as a Risk Barometer
Because both legs respond to the same mood, the cross amplifies it. A modest shift in sentiment shows up clearly here.
Many desks watch it for exactly that reason. It offers a quick read on appetite without any extra tools.
Iron ore matters less to this chart than most people assume. Mood and rate spreads do more of the work than any single export price.
The Carry Angle and Its Costs
Holding a higher-yield currency against a lower-yield one earns a small daily credit. That credit reflects the gap between two interest rates.
Position risk usually dwarfs what the carry pays. A few days of adverse movement can wipe out months of accrued interest.
Rates also change, and each broker sets its own. Check yours on our swap calculator rather than assuming the figure from an old article still holds.
Download the complete indicator database
Put these concepts on your charts. One email unlocks the full library of 1,380+ indicators with compiled MT4 and MT5 files, plus my TradingView scripts. No paywall, no spam, unsubscribe any time.
Get free access to my indicator database
One email unlocks 1,380+ free MT4, MT5 and TradingView indicators — the complete library. No single-tool download; you get the whole database.
Common Mistakes and Their Fixes
Six habits turn a useful label into a costly one. The panel below sets out where the shorthand runs out of road.

Treating the Label as a Rule
These names respond to plenty besides export prices. Read the label as a hint about character, then check what actually moved the pair this week.
Trading the Ore Chart Instead of the Pair
A jump in iron ore tells you about iron ore. Any read-across runs through several slow steps, so trade the market you studied.
Forgetting the Services Side
Australia and New Zealand both earn heavily from tourism and foreign students. Those flows never appear in a commodity chart, and they move real money.
Ignoring the Buyer
Most of these exports head to one dominant customer. A slowdown there can sink the currency while export prices hold steady.
Stacking Three Versions of One Trade
The main names often move together. Check your open risk on our currency strength meter before adding a third position that echoes the first two.
Assuming Income Comes Home
Norway routes much of its oil revenue into a fund that buys foreign assets on purpose. So the flow story breaks entirely for that name.
A Quick Reference Checklist
Six lines cover the practical work. Each one takes under a minute.
| Check | What it means in practice |
|---|---|
| How concentrated are the exports | A high share of raw goods gives the link something to work with |
| Who buys them | One dominant customer means their slowdown matters most |
| Where do the earnings go | A state fund investing abroad breaks the flow story |
| What is the rate gap | Policy spreads often outweigh the export story outright |
| What is the mood today | Risk appetite drives these names hard on many days |
| How thin is the market | Smaller names move further and cost more to trade |
Run the list before the label shapes a trade, not afterwards. Order of operations does most of the filtering.
Where the Label Breaks Down
The shorthand fails in patterns you can learn. The panel below maps the group and its limits together.

Risk Mood Overrides Everything
These currencies fall in a scare regardless of export prices. Traders sell what carries risk, and this group carries plenty.
So a strong commodity backdrop offers no shelter during a broad sell-off. That fact surprises newcomers every single cycle.
Watch what the whole risk complex does before blaming the export story. Half the moves people credit to ore or crude were simply mood.
Rate Spreads Take Over for Months
When two central banks pull apart, the rate gap dominates. An export currency can slide through a commodity rally purely because its bank sits on hold.
Those stretches last longer than most traders expect. Anyone waiting for the export link to reassert itself waits a long time.
Our guide to forex commodity correlations covers how to measure that fade rather than guess at it.
Export Mixes Change Underneath You
Mexico shows this clearly. Oil once led its exports, and manufacturing has long since taken over that role.
The label stuck anyway. Plenty of articles still describe the peso as an oil currency, which the trade data no longer supports.
Check the current export mix before you rely on an old framing. Statistics agencies publish it, and the numbers take minutes to find.
The Dollar Sits Behind Both Sides
Most commodities price in dollars. So a dollar move shifts commodity prices and these currencies at the same time.
That shared driver creates a link where none may exist. Our note on the dollar index in forex covers how to separate the dollar leg from the story you think you see.
Risk-On and Risk-Off in Plain Terms
These names get called risk currencies as often as export currencies. Both labels point at the same behaviour.
What the Terms Mean
Risk-on describes a mood where traders buy growth and sell safety. Risk-off describes the reverse, when they rush back the other way.
Export-led currencies sit on the growth side of that split. So they climb in the first mood and drop in the second.
Why They Swing Harder Than Most
Two things stack up here. These economies lean on world demand, and several of them trade in fairly modest size.
Modest size means each unit of flow pushes price further. Add a growth story on top and the swings grow larger again.
Spotting the Mood Without Guessing
Look across markets rather than at one chart. Shares, credit, havens and these currencies usually agree during a real mood shift.
When they disagree, the move probably came from something local. That is exactly when the export story earns a second look.
What This Means for Position Size
Mood shifts arrive fast and travel far. Size these trades on the assumption that a quiet week can turn sharp without notice.
Wider stops need smaller lots rather than more hope. Work the size from the stop distance every time, and the swings stop being frightening.
How to Read the Export Data Yourself
Nobody needs a subscription for this. Every major economy publishes its trade figures for free.
Where to Look
Start with the national statistics office. Australia, Canada, New Zealand and Norway all post monthly trade releases in plain tables.
Central banks publish useful summaries too. Their quarterly reports usually spell out which exports drive the outlook that quarter.
What to Write Down
Five lines cover it. Keep them in one note per country.
- The top three goods by value. Names and shares, so you know what actually matters to the trade balance.
- Their combined share of exports. A high share means the link has real force behind it.
- The largest buyer. One dominant customer turns their slowdown into your problem.
- The direction of travel. Rising or falling share over five years, not just the newest figure.
- The services line. Tourism and foreign students rival goods for some of these economies.
What the Numbers Change
Sometimes they confirm what you assumed. More often they trim it, and that trimming carries the value.
A share that halved over a decade tells you the label has aged. Trade the current mix rather than the one you learned from an old article.
Related Concepts Worth Reading Next
This topic sits inside a wider macro picture. Two neighbouring pieces round it out.
Survey data gives an early read on the demand that drives export prices, so our explainer on what PMI means in forex covers the leading indicator side. Read it next if you want a heads-up before the trade numbers arrive.
Holding these positions overnight costs or pays something, and our guide to swap in forex covers that mechanism in full. Release timing matters too, so keep our economic calendar open on the days these economies report.
Building the Idea Into a Routine
Knowledge changes nothing without a habit attached. A short monthly pass keeps the framing current.
Monthly: Check the Export Mix
Pull the latest export breakdown for any country you trade. Note the top three goods and their share of the total.
Write the date beside it. A year of those notes shows you which labels still hold and which ones drifted.
Weekly: Rank the Group
Look at how the main names performed against each other. If they all moved together, mood drove the week rather than any export story.
If one broke away, ask what happened to its own economy. That question finds the real driver faster than a commodity chart does.
Before Any Trade: Name the Driver
Write one sentence saying why you expect the move. Export prices, rate spreads or risk mood covers nearly every case.
Then check whether your entry timeframe matches that driver. A story about export income cannot justify a fifteen-minute trade.
Traders who prefer an automated read can browse our currency strength indicators archive. Any such tool works as a spotter, and the judgement stays with you.
Keep the Language Careful
Watch how you describe these names to yourself. Saying the currency has an export lean keeps you honest, while saying it follows the ore price commits you to a claim the data may not support.
Precision costs nothing here. It also stops you holding a losing trade because a story about mines once sounded convincing.
FAQ
Which currencies count as commodity currencies?
The Australian dollar, the Canadian dollar and the New Zealand dollar lead the liquid group, with the Norwegian krone close behind. Beyond the majors, the South African rand, the Chilean peso and the Brazilian real all qualify on export concentration. No official list exists, so treat any published set as one person’s judgement rather than as a standard.
Why does the Australian dollar move with iron ore?
Iron ore leads Australian export earnings, so a price rise lifts national income, mining profits and tax receipts together. That improvement feeds into growth and rate expectations, which is where the currency actually responds. The link runs through several slow steps, and on many days risk mood or Chinese data explains the move far better than the ore price does.
Is the Canadian dollar just an oil currency?
Only in part. Energy leads Canadian goods exports, so the mechanism genuinely exists. What complicates it is proximity: roughly three-quarters of Canadian goods head to the United States, so US growth and the gap between the two central banks often matter more than the barrel price on any given week.
Do these currencies always fall in a crisis?
They usually weaken, because traders reduce risk by selling what carries it. Commodity exporters sit firmly in that bucket, and the smaller names fall hardest since they trade in thinner size. A commodity rally offers little protection during a broad sell-off, which catches out anyone treating the export link as a floor.
Can I trade commodity currencies without watching commodities?
Many traders do exactly that and manage fine. Structure, levels and risk rules carry most of the work, and the export backdrop mainly explains why a pair has a particular character. Watching the commodity adds context rather than signals, so use it to set expectations rather than to time entries.
Do these currencies pay a higher interest rate?
Some do and some do not, and the answer shifts with the cycle. Higher rates in a few of these economies reflect inflation and risk premiums rather than export strength. Both the Australian and Canadian dollars have spent long stretches yielding less than the US dollar, so keep the carry question separate from the export question. Broker swap rates vary and change, so check yours rather than trusting a figure from an old article.
Which of them is the most liquid?
The Australian dollar and the Canadian dollar trade in the largest size of the group, with tight spreads through the main sessions. The New Zealand dollar follows some way behind, while the Norwegian krone and the South African rand trade thinner still. Spreads on the thinner names widen sharply outside London and New York hours, which matters far more to a short-term trader than the export story does.
How much should the label influence my trading?
Treat it as one input on a list rather than as a reason on its own. The label tells you what kind of shocks a currency reacts to, which helps you interpret news and size positions sensibly. It does not tell you direction, and it fades or inverts for months at a time, so judge your process across many trades rather than any single one. Results are not guaranteed; past performance is not indicative of future results.
External references
- For background on this concept, see Terms of Trade at Investopedia.
- For broader market context, see Dutch Disease on Wikipedia.

About the author
Written by Dominic Walsh, a Forex trader and MT4/MT5 indicator, Expert Advisor and script developer. Every tool on forexmt4systems.com is tested on live charts before release and ships with ready-to-use compiled MT4 (.ex4) and MT5 (.ex5) files. Learn more about the trader and developer behind this site.
How we build, test and correct every tool: Editorial & Testing Policy. Trading carries risk; see the disclaimer.