
Search for how to learn fundamental analysis and you meet a reading list the length of a degree course. Most people quit somewhere around week three.
Order matters far more than volume. This guide sets out a sequence where each stage makes the next one easier, plus a weekly routine that survives a full-time job.
How to Learn Fundamental Analysis in the Right Order
Beginners usually start with definitions. They memorise what gross domestic product measures, then discover that knowing the definition explains nothing about the chart.
So invert the usual approach. Start with what moves, work back to why, and pick up the vocabulary along the way.
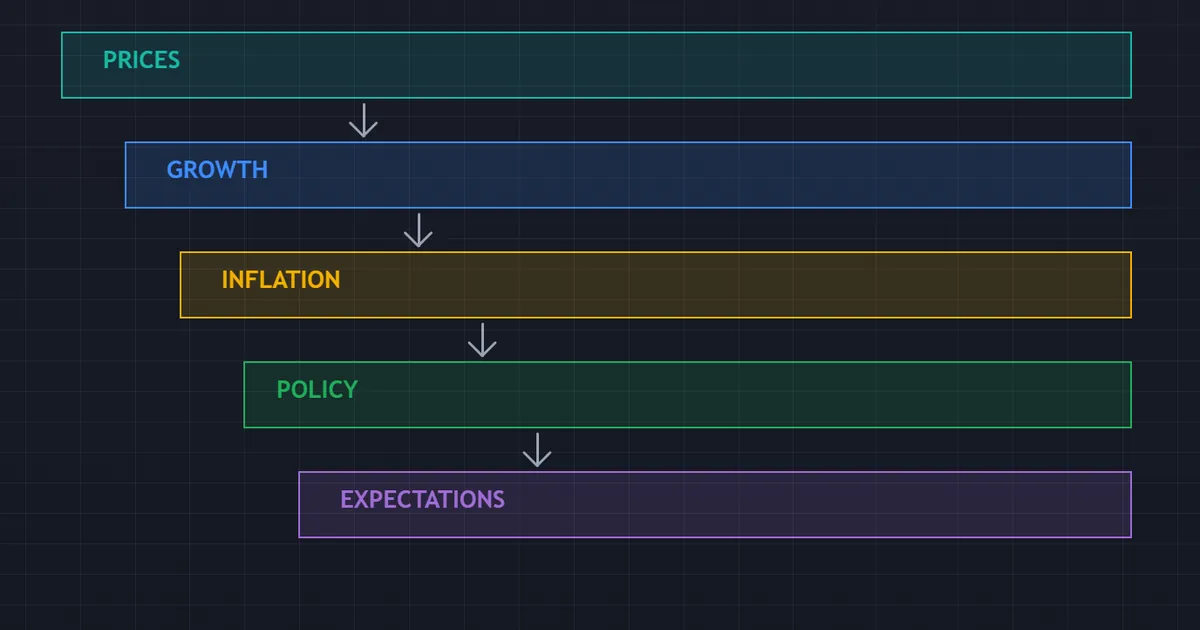
The panel above sets out the path stage by stage. Each stage rests on the one below it, which is why skipping ahead wastes time.
Start With Prices, Not Theory
Open a chart of a major currency and a chart of a government bond yield. Watch them for a fortnight without reading a single textbook chapter.
You will notice they move together often, and apart sometimes. That observation gives every later definition something to attach to.
Theory learned in the abstract evaporates. Theory learned as an explanation for something you already watched tends to stick.
The Dependency Chain
Growth data feeds inflation. Inflation feeds policy. Policy feeds rate expectations, and rate expectations feed the currency.
Learn the chain in that direction and each link explains the next. Learn it backwards and every stage arrives as a disconnected fact.
Keep the chain visible while you study. Whenever a release confuses you, ask which link it touches, then read only about that link.
Stage One: What the Numbers Actually Measure
Four families of data cover almost everything the calendar prints. Learn these and the rest becomes detail.
Growth Data
Gross domestic product measures the total output of an economy. It arrives late, gets revised heavily, and still anchors every long-term argument.
Retail sales and industrial production arrive sooner. They cover narrower ground, so treat them as early hints rather than conclusions.
Inflation Data
Consumer price indices track what households pay. Producer prices track what firms pay, which sometimes leads the consumer measure by a month or two.
Learn the difference between headline and core early. Energy and food swing the headline around, while the core reading shows the trend policymakers respond to.
Our explainer on what CPI means in forex covers that split in full.
Labour Data
Employment sits between growth and inflation. A tight labour market pushes wages up, and wages feed straight back into prices.
Payroll counts grab the headlines. Wage growth inside the same release often carries more weight for policy, and plenty of traders never read that line.
Sentiment Surveys
Purchasing managers’ surveys ask firms whether conditions improved. They arrive fast, which makes them useful even though they measure opinion rather than output.
Consumer confidence works the same way. Treat both as leading signals with a wide margin of error, and never as facts.
Trade and Money Flows
Trade data shows what a country buys and sells abroad. A country that sells more than it buys tends to see steady demand for its money.
The current account widens that view. It adds income and transfers, so it gives a fuller picture of money crossing the border.
These figures move slowly. Use them for the long view, not for the week ahead.
What Macro Work Is Not
Half the learning curve is unlearning. Three myths cause most of the trouble.
It Is Not a Signal Service
No release tells you to buy. The data shapes a lean, and the lean shapes how much risk you take.
Traders who want an entry from a print will wait a long time. The chart gives entries; the data gives context.
It Is Not About Being Right
You can read the data well and still lose the trade. Price moves for reasons no calendar lists.
So judge your notes on how well they explain, not on how often they call the turn. Explanation improves with practice, and calls do not.
It Is Not Slow to Matter
Some traders think macro work only helps long holds. Not so.
Knowing that a rate decision lands at two in the afternoon changes your size at noon. That is a same-day use of the same study.
Stage Two: What Central Banks Do With the Numbers
Data only matters through the decisions it shapes. That makes central banks the second stage rather than an advanced topic.
Read the Mandate First
Every bank publishes what it aims for. Some target inflation alone, while others balance inflation against employment.
The mandate tells you which release the bank cares about most. A bank with a dual mandate reacts to jobs data that a single-mandate bank would largely ignore.
Spend an hour on the mandates of the banks behind your pairs. That hour explains more reactions than a month of general reading.
The Statement Beats the Decision
Most rate decisions surprise nobody. Traders knew the number days earlier, so the currency barely twitches when it lands.
The language moves price instead. A changed adjective, a removed sentence or a new risk assessment can shift expectations for the next six months.
Our guide to central bank rate decisions shows how to read a statement line by line.
Go to the Source Documents
Commentary compresses a policy statement into one sentence, and the compression loses the interesting part. Read the original at least once a month.
Statements run to a page or two. Minutes run longer, and they show where the committee disagreed, which often predicts the next change in tone.
Reading sources feels slow at first. After three months the format becomes familiar, and you skim to the two paragraphs that changed.
Stage Three: Expectations, and Why They Rule
Stage three explains almost every reaction that looks wrong. Skip it and fundamentals will seem random for years.
The Market Trades the Gap
Price already reflects the outcome most participants expect. Only the difference between that expectation and the result carries force.
So a strong number can weaken a currency. Everyone forecast the strength, the buying happened days earlier, and the print simply released those traders from their positions.
Once that idea lands, whole years of confusing charts start making sense. Nothing else in this field pays back study time so quickly.
How to See the Expectation
Calendars publish a consensus figure beside every release. That figure aggregates surveyed forecasts, and it acts as a rough proxy for what price already holds.
Interest rate futures show the same thing for policy. They imply the probability of a cut or a hike at each upcoming meeting, and those probabilities move daily.
Check both before any major event. Our economic calendar puts the consensus and the previous reading beside each row.
Why the First Move Often Reverses
Fast systems trade the number in the first second. They react to the print alone.
People read the detail next. They check the revision, the wage line, the sub-indices, and they often reach a different view.
So the first spike and the settled price can point opposite ways. Watch both, and write down which one your pair tends to respect.
Learn One Event Deeply
Pick a single monthly release and follow it for half a year. Note the consensus, the print, the first move and the close.
Six notes on one event beat sixty scattered notes. Patterns only show up when the sample shares a shape.
A Repeatable Study Loop
Passive reading builds vocabulary, not skill. This loop turns each release into a small, honest experiment.
- Pick one release a week. Choose something scheduled for a currency you actually trade.
- Write your expectation down. Note the consensus and whether you lean above or below it.
- Watch the reaction live, without trading. Record the first move and the move an hour later.
- Explain the gap. Ask why the market responded as it did, given what it already held.
- File the note. One paragraph, dated, in a place you will read again.
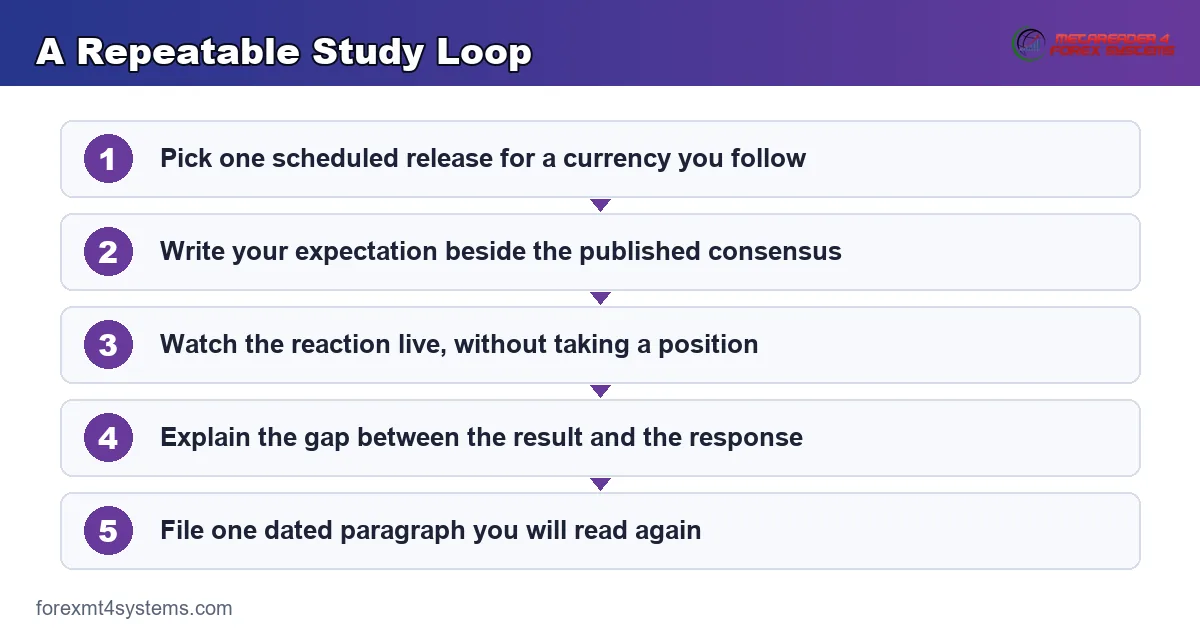
Twenty of those notes teach more than twenty books. They also build a personal record of how your chosen pairs behave.
Keep them somewhere searchable. Our free trade journal handles the filing without any spreadsheet work.
Yields: The Anchor Most Beginners Skip
Currency traders often ignore bonds entirely. That gap explains a surprising share of the confusion beginners report.
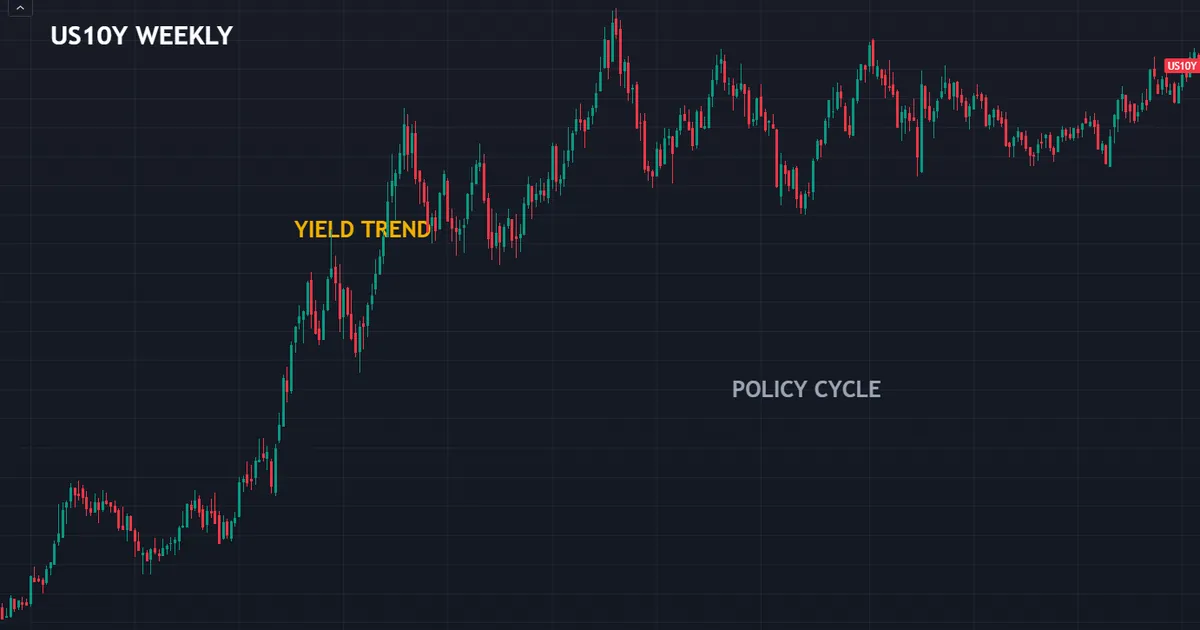
Above sits the United States ten-year yield on weekly bars. One chart of that kind covers several policy cycles, which makes it a compact history of expectations.
Why Yields Lead the Story
A government bond yield reflects what buyers demand for lending to a state over years. It therefore bundles growth, inflation and policy into one number.
Currencies chase those numbers. When the yield on one country’s debt rises relative to another’s, capital tends to follow, though never on a fixed schedule.
Watch the two-year yield as well. It tracks expected policy more tightly than the ten-year, so it often moves first around a decision.
How to Study a Yield Chart
Look at direction and pace rather than level. A yield climbing quickly says something different from a yield sitting high and flat.
Then compare two countries. The gap between their yields, not the absolute level, drives the flow between their currencies.
Add the currency pair beneath the yield gap. Some months the two track each other neatly, and other months they separate entirely, which itself teaches you something.
Download the complete indicator database
Put these concepts on your charts. One email unlocks the full library of 1,380+ indicators with compiled MT4 and MT5 files, plus my TradingView scripts. No paywall, no spam, unsubscribe any time.
Get free access to my indicator database
One email unlocks 1,380+ free MT4, MT5 and TradingView indicators — the complete library. No single-tool download; you get the whole database.
Common Mistakes While Learning
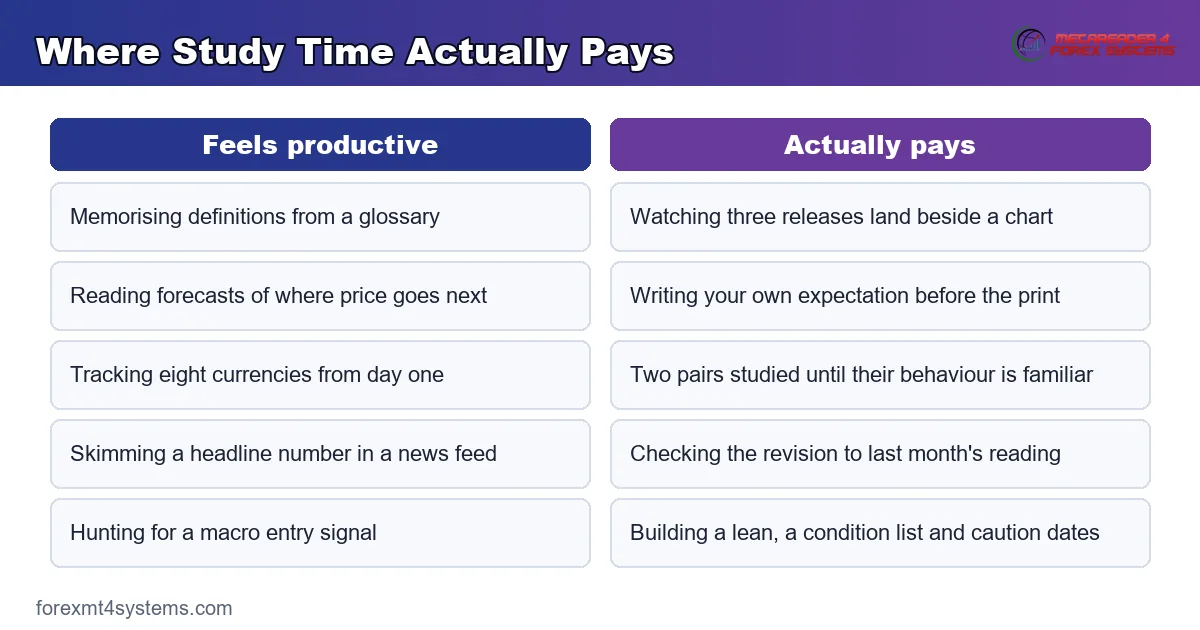
Six habits stretch a six-month curriculum into three years. The panel below separates the study time that pays from the study time that only feels productive.
Collecting Definitions Without Charts
Knowing what a purchasing managers’ index measures helps very little on its own. Watching three of them land beside a chart teaches far more.
So pair every definition with an observation. The definition tells you what the number counts; the chart tells you whether anyone cared.
Reading Forecasts Instead of Data
Commentary predicting where a currency goes next feels satisfying. It also removes the thinking you needed to practise.
Read the release, form your own view, then read the commentary. Doing it in that order turns other people’s opinions into a check rather than a crutch.
Studying Every Economy at Once
Beginners often track eight currencies from day one. Depth on two beats a shallow survey of eight, because reactions only make sense against a history you remember.
Pick one major pair for the first three months. Add a second once the first feels familiar.
Ignoring the Revisions
Learners fixate on the headline print and never check what happened to last month’s figure. Revisions frequently move markets more than the new number does.
Add the revision to your weekly note. Two months of that habit changes how you read every release.
Treating It as a Signal Generator
Fundamentals rarely produce an entry. They produce a lean, a set of conditions and a list of dates that deserve caution.
Expecting a buy signal from macro work leads straight to disappointment. Our note on how to use fundamental analysis shows what the output actually looks like.
Skipping the Calendar Mechanics
Plenty of students study economics and never learn the calendar itself. Then a routine release catches them mid-position because the impact rating went unread.
Learn the layout properly, once. Our walkthrough on how to read the economic calendar takes about ten minutes.
Sources Worth Keeping Close
A short shelf beats a long one. Four kinds of source cover the job.
The Central Bank Itself
Policy statements, minutes and meeting calendars all come free from the bank. They carry no spin, because the bank wrote them to be quoted.
Bookmark the calendar page for the two banks behind your main pair. Check it once a month so no decision date surprises you.
The Statistics Agency
Each release has an official page with the full report. Headlines quote one line from it, and the rest often matters more.
Open the source report once per data family. After that you will know which table to jump to.
A Calendar With Consensus Figures
You need the expected number, not just the time. A calendar without a consensus column leaves out the part that moves price.
Check the impact rating too. It sorts a crowded week into three or four rows that deserve real attention.
Your Own Notes
The fourth source outranks the other three within a year. Nobody else records how your pairs behaved around the events you watched.
Keep them short and dated. A file of one-paragraph notes becomes the reference you actually reach for.
A Ninety-Day Study Plan
Three months covers the ground if the effort stays consistent. Roughly four hours a week does it.
| Weeks | Focus | Weekly output |
|---|---|---|
| 1 to 4 | Data families: growth, inflation, labour, sentiment | One release note per week |
| 5 to 8 | Central bank mandates, statements and minutes | One statement read in full |
| 9 to 10 | Expectations: consensus figures and rate futures | A pre-event expectation, written down |
| 11 to 12 | Yields and the differential between two countries | A yield gap chart beside your pair |
| 13 | Review every note written so far | A one-page summary of what surprised you |
Notice what the plan leaves out. No trading appears anywhere in it, because learning to read and learning to risk money are separate skills.
Miss a week and simply carry on. The plan measures ground covered, not attendance.
At the end, repeat weeks nine and ten with a second pair. Expectations are the stage that rewards a second pass more than any other.
A Study Routine That Survives a Busy Week
Ambitious schedules collapse. A small routine you actually keep beats a large one you abandon in month two.
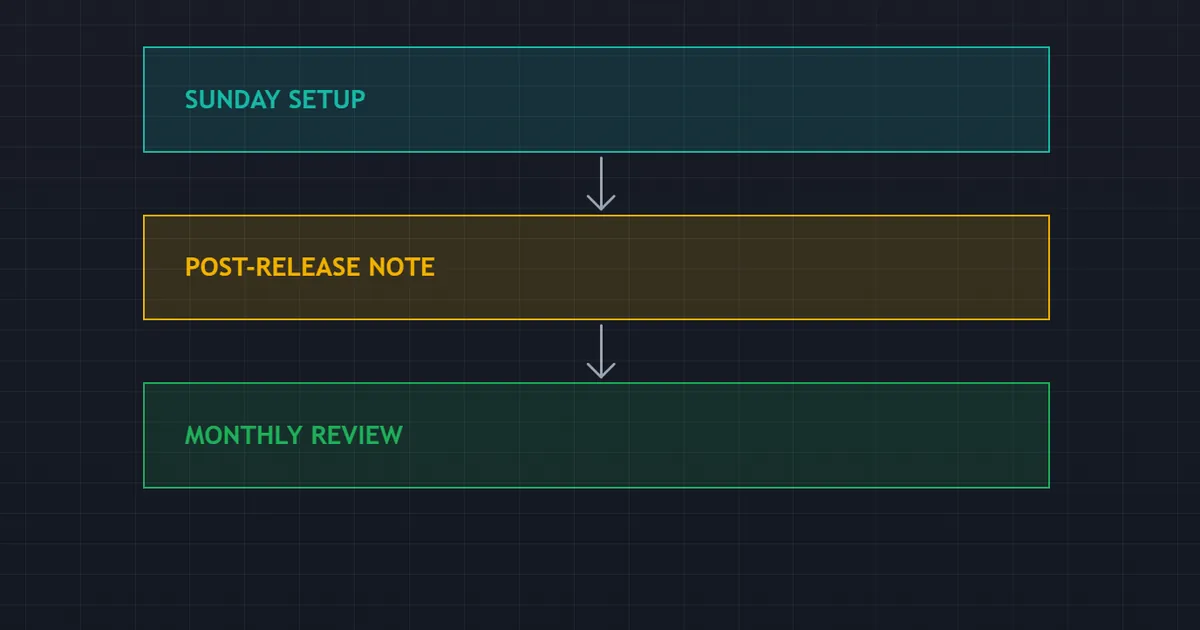
Twenty Minutes on Sunday
Mark the week’s high-impact events for your two currencies. Note the consensus for each and convert the times into your own clock.
Then write one line on where policy currently points for both. That line becomes your reference when the week gets noisy.
Five Minutes After Each Release
Record the actual figure, the consensus and the first reaction. Add one sentence explaining what the market seemed to care about.
Nothing longer than that. Short entries survive busy weeks; long ones stop appearing after a fortnight.
An Hour Each Month
Read your notes end to end. Count how often the direction followed the surprise and how often it ignored it.
That ratio, tracked over a year, teaches you which releases your pairs actually respond to. It also stops you giving every calendar row the same weight.
What Slows People Down
Three obstacles come up in almost every learning story. None of them requires more reading.
Wanting Certainty From an Uncertain Field
Macro analysis produces leans, not answers. Students who expect a definite conclusion keep searching for a better source, and the search never ends.
Accept the ambiguity early and progress speeds up. The skill lies in ranking possibilities, not in eliminating them.
Confusing Correlation With Mechanism
Two series that moved together for six months can separate without warning. Relationships in macro hold loosely and break often.
So keep asking why a link should exist. A relationship with no plausible mechanism behind it usually fails at the worst moment.
Quitting Before the Notes Add Up
The first ten notes feel useless. They record events with no pattern behind them yet.
Around note thirty, the picture changes. You start recognising a reaction before it finishes, because you saw its shape before.
So the payoff sits behind a dull stretch. Most people stop just short of it.
Studying in Isolation From the Chart
Fundamentals decide the lean, and the chart decides the price. Students who never combine them end up with strong opinions and no way to act on them.
Pair your macro study with basic chart work. Our guide to multi-timeframe analysis gives the structure side of that pairing.
Related Guides Worth Reading Next
Two follow-ups slot in naturally once the sequence above feels comfortable. Choose whichever gap looks widest.
New traders should start with forex trading explained, since macro reading assumes you already know how a currency pair quotes. Cover that first and the rest reads faster.
After that, browse our MetaTrader indicators library for tools that display macro context on the chart itself. Any such tool works as a display layer, and the judgement stays with you.
FAQ
How long does it take to learn fundamental analysis?
Around three months of consistent effort gets you to a working level, at roughly four hours a week. That covers the data families, central bank behaviour and expectations. Depth keeps building for years after that, mostly through the notes you write around real releases rather than through further reading.
Do I need an economics degree?
No. The trading application uses a small slice of economics, and the slice stays fairly stable. Understanding what a handful of releases measure, how a central bank responds and why expectations dominate covers most of the practical ground. Formal study helps with depth, though it rarely helps with timing.
What should I read first?
Start with a central bank’s own policy statement for a currency you trade. It runs to about two pages, uses plain language, and shows exactly which data the committee weighs. After a few months, add the minutes, since those reveal the disagreements that shape future changes in tone.
How do I practise without risking money?
Write your expectation before each release, then record what happened afterwards. No position is needed. The skill you want is explaining reactions, and that skill improves through written prediction and review rather than through exposure.
Should I learn charts or fundamentals first?
Learn basic chart reading first, because it takes less time and gives you somewhere to put macro observations. Support, resistance and timeframes take a few weeks. Macro study then has a canvas, and every release note gets attached to a price you watched. Running the two together from the start also works, provided the chart side stays simple while the macro side grows.
Can fundamentals tell me where a currency will go?
Not reliably, and any source promising that overstates its case. Fundamentals tell you which currency carries a policy tailwind and which scheduled dates deserve smaller positions. Direction over days depends on positioning and expectations that shift constantly, so treat every macro view as provisional and size it accordingly. Results are not guaranteed; past performance is not indicative of future results.
External references
- For background on this concept, see Fundamental Analysis at Investopedia.
- For broader market context, see Monetary Policy at the Federal Reserve.
- A live example of the kind of statement that step asks you to open is the ECB’s Monetary policy statement (with Q&A) at the European Central Bank.

About the author
Written by Dominic Walsh, a Forex trader and MT4/MT5 indicator, Expert Advisor and script developer. Every tool on forexmt4systems.com is tested on live charts before release and ships with ready-to-use compiled MT4 (.ex4) and MT5 (.ex5) files. Learn more about the trader and developer behind this site.
How we build, test and correct every tool: Editorial & Testing Policy. Trading carries risk; see the disclaimer.