
Most traders learn how to read the economic calendar by ignoring it until something expensive happens. A routine position meets a routine release, and the fill arrives nowhere near the screen price.
The calendar itself takes ten minutes to learn. What takes longer is accepting that a strong number does not reliably lift a currency.
How to Read the Economic Calendar, Column by Column
A calendar row holds five or six fields. Each one answers a different question, and skipping any of them costs you something specific.
Start with a real example rather than a definition. Below sits a four-hour chart of EURCAD covering the United States payrolls day on 5 June 2026.
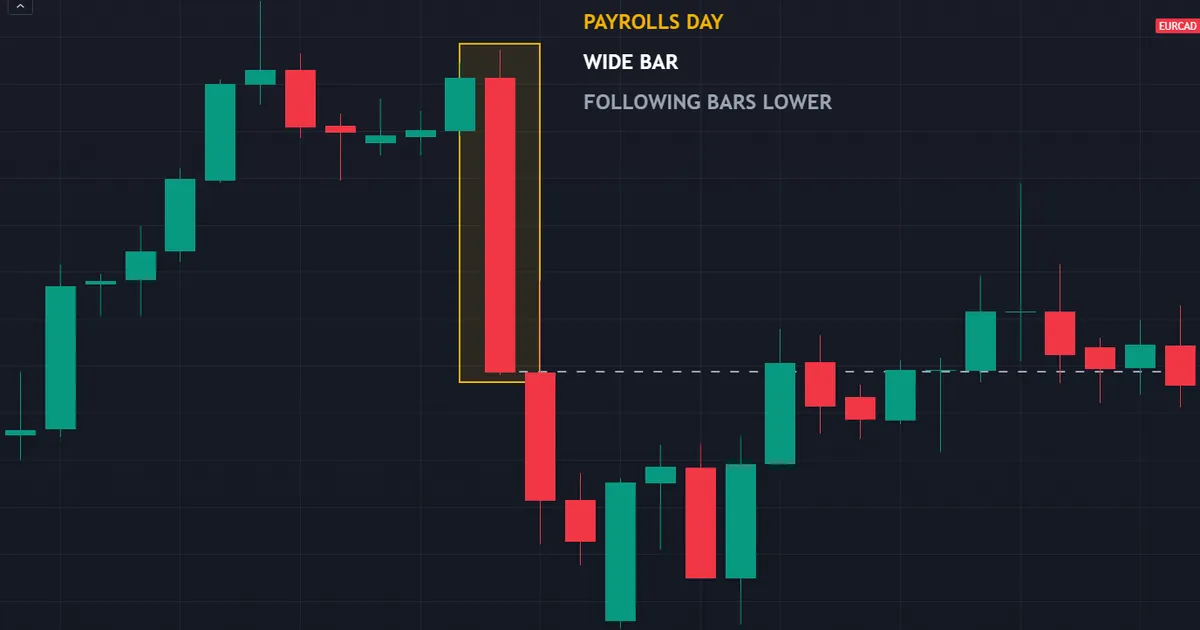
What the Payrolls Bar Shows
The bar spanned about 3.5 times the recent average range. That counts as a wide bar, though far from the widest a major pair produces.
Notice what the number really measures. It compares one bar against normal conditions for that pair, which makes it a risk figure rather than a direction.
Over the bars that followed, price netted about 2.2 times the average range lower. So the day carried a second move after the first one finished.
Why the Bar Alone Misleads
Looking at that chart afterwards, the move seems obvious. Anyone could have taken it, apparently.
Live, the same bar offered a widened spread, a fast tape and no clarity about which way the settled price would land. Hindsight removes every part that made it hard.
So treat these charts as lessons about range, never as evidence that a trade was available. The two things differ completely.
The Columns and What Each One Means
Five columns carry the useful information. Read them in the order below.
Time
Calendars publish times in a zone you choose. Set that zone once, then check it after any clock change.
Time-zone errors cause more accidental exposure than bad analysis does. A trader watching for a release at nine finds it already happened at eight.
Pair the calendar with a session view. Our forex market hours tool shows which centres are open when a release lands, which changes how much liquidity meets it.
Currency
Each row names the currency the data belongs to. Both legs of your pair matter, so filter for two currencies rather than one.
Traders often watch only the base currency. Then a quote-currency release moves the pair and the reaction looks inexplicable.
Impact Rating
Ratings sort the noise. High-impact rows usually cover rate decisions, inflation, employment and headline growth.
Treat the rating as a rough filter rather than a law. A medium-rated release can matter enormously when the market currently obsesses over that theme.
Conversely, a high-rated release lands flat when everyone already knows the answer. Ratings describe typical behaviour, not this week’s behaviour.
Actual, Consensus and Previous
Three figures sit side by side once the data lands. Reading them as a group takes practice, because the useful signal lives in the differences.
| Field | What it holds | What it tells you |
|---|---|---|
| Previous | Last period’s published reading | The trend the market already knows about |
| Consensus | An average of surveyed forecasts | A rough proxy for what price already reflects |
| Actual | The figure the agency publishes | Only matters through its gap to consensus |
| Revised | A correction applied to an earlier reading | Can outweigh the new headline entirely |
Revisions
Statistics agencies update earlier readings as more responses arrive. Calendars usually show the change quietly, in brackets or small type.
Early prints rest on partial survey responses. Later versions gather more of the sample, which is exactly why the figure moves.
Treat the first print as a draft, then. Building a whole view on one flash estimate means rebuilding it a month later.
That small type moves markets. A soft new print alongside a large upward revision tells a completely different story from the headline alone.
So read the revision before you judge the release. Plenty of reactions that look backwards trace straight to a number nobody checked.
The Releases Worth Knowing by Name
A busy week lists forty rows. Four families cover almost everything that moves a major pair.
Rate Decisions and Statements
Central bank meetings sit at the top of any week. The rate itself often surprises nobody, because traders priced it weeks earlier.
The statement carries the move instead. A changed phrase or a new risk assessment can shift expectations across the next several meetings.
Press conferences add a second wave. Price frequently reverses during them, since the tone can contradict the written text.
Inflation Reports
Consumer price data drives policy expectations more directly than anything else. Read the core figure beside the headline.
Energy and food swing the headline around. The core measure tracks the underlying trend that a committee actually responds to.
Employment Data
Jobs reports bundle several numbers into one release. Payroll counts grab the headline, while wage growth often matters more for policy.
United States payrolls land on the first Friday of each month. That fixed schedule makes it the easiest major event to plan around.
Growth and Survey Data
Gross domestic product arrives late and gets revised heavily. Markets often shrug, because newer data already told the story.
Purchasing managers’ surveys arrive far sooner. They measure opinion rather than output, yet their timeliness gives them real weight.
Reading One Row in Order
Six steps cover any row on any calendar. Run them the same way each time.
- Check the currency and the impact rating. Skip anything that touches neither leg of your pair.
- Convert the time into your own clock. Note whether you will sit at the screen or not.
- Read the previous figure. Establish the trend the market already knows.
- Read the consensus. That approximates what price currently holds.
- After the print, compare actual with consensus. The gap, not the level, carries the force.
- Check for a revision. Adjust your reading of the previous figure before drawing any conclusion.
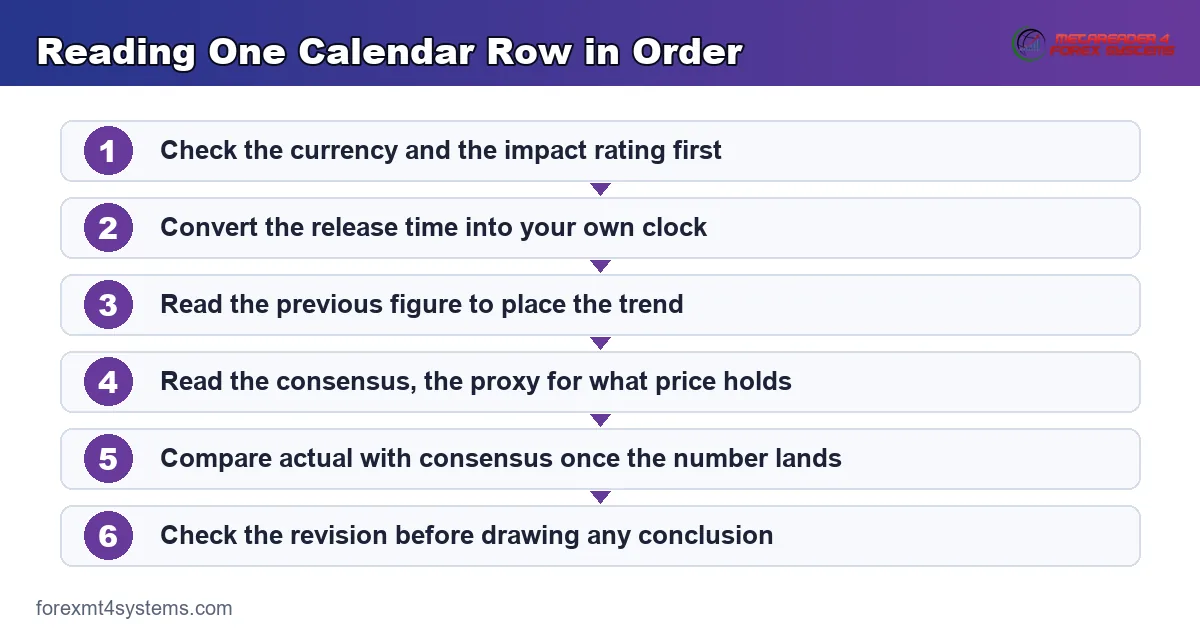
Steps four and six catch most of the errors. Both take seconds, and both get skipped constantly.
Our economic calendar lays the fields out in that order, which makes the routine quicker to build.
Why Beating the Consensus Does Not Mean the Currency Rises
This section matters more than the rest combined. Traders lose money for years without absorbing it.
Priced In, Briefly
Markets trade expectations rather than facts. By the time a number lands, participants already hold the positions they wanted for the outcome they expected.
Only the surprise carries force. A print that matches the consensus changes little, because nobody needs to adjust anything.
That single idea explains most reactions that look wrong on the chart. Nothing else in this topic repays study so quickly.
Three Reasons a Strong Number Sells Off
First, the strength was expected, so traders bought days earlier and now take profit. The flow runs opposite to the headline.
Second, the detail contradicts the headline. A good top-line figure with weak internals gives analysts an immediate reason to fade it.
Third, the market cares about something else entirely this month. An inflation beat lands flat when the theme rotated to growth two weeks ago.
Read the Reaction, Not the Number
The most useful information arrives after the print. How a currency responds tells you what the market currently weighs.
A muted response to a big surprise says the theme moved on. A large response to a small surprise says the market sits nervously positioned.
Record both. Over a few months those notes teach you which releases your pairs actually respect.
How Big Does a Surprise Need to Be
Small deviations rarely register. A figure a whisker above consensus sits well inside forecast error, so nobody repositions.
Larger gaps change the arithmetic. When a print lands far outside the range of surveyed forecasts, the market must adjust its policy expectations, and that adjustment moves the currency.
Watch the forecast range where your calendar shows it. The spread between the highest and lowest estimate tells you how much room a surprise really had.
Turning the Calendar Into a Plan
Reading rows achieves nothing on its own. The value appears when the calendar changes what you do.

Shortlist Before the Week Starts
Pull the week’s high-impact rows for your currencies. Three to five rows usually survive that filter.
Write them somewhere visible, in your own time zone. A list you must go and find is a list you will not check.
Decide Before, Never During
Choose your response while nothing is happening. Flat into the release, reduced size through it, or a position held with a wider stop.
All three answers are defensible. Deciding in the thirty seconds before a print, with a live position, is not.
Our note on how to use a stop loss covers the sizing side of that choice.
Write the Response Down
One line per event covers it. Name the event, the time, and what you do about any open position.
That line removes improvisation. It also gives you something to review afterwards, which turns each event into data rather than a memory.
Rank the Week Rather Than Listing It
Not every high-impact row deserves the same caution. One event usually dominates a week, and the rest sit well below it.
Mark that one clearly. Everything else can share a single line, since your response to them will be identical.
Ranking also protects your attention. A flat list of twelve rows gets ignored by Wednesday, while a ranked list of three survives.
Note What Already Sits in the Price
Beside each shortlisted event, write one clause about market expectation. Something as short as a widely expected hold does the job.
That clause turns the row into context. Without it you record a date, and dates alone change nothing about your sizing.
Download the complete indicator database
Put these concepts on your charts. One email unlocks the full library of 1,380+ indicators with compiled MT4 and MT5 files, plus my TradingView scripts. No paywall, no spam, unsubscribe any time.
Get free access to my indicator database
One email unlocks 1,380+ free MT4, MT5 and TradingView indicators — the complete library. No single-tool download; you get the whole database.
Common Mistakes on Calendar Days
Six habits account for most of the damage. The panel below collects them with the fix for each.
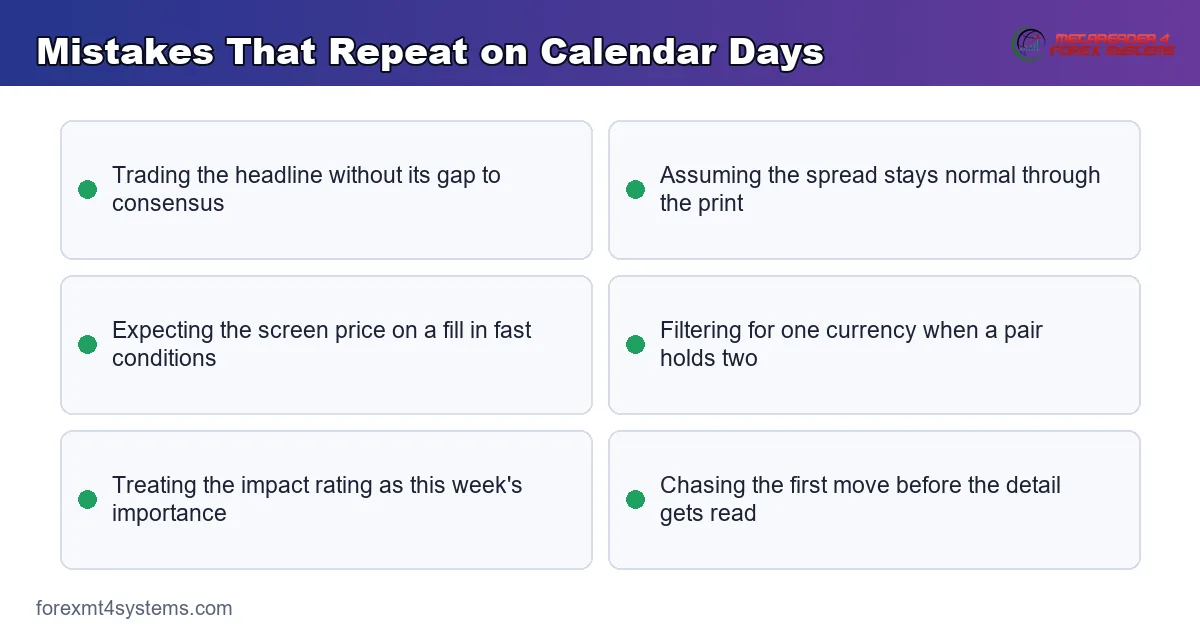
Trading the Headline Instead of the Gap
A strong figure means nothing without its consensus. Write the expected number beside your chart before the release, so the comparison happens automatically.
Assuming the Spread Stays Normal
Quoted spreads widen sharply in the seconds around a release. A pair costing one pip at midday can cost several for a short window.
Our explainer on why spreads widen covers the mechanics. Budget for the widening before you commit, rather than complaining afterwards.
Expecting the Screen Price on the Fill
Orders around releases fill at whatever the market offers. Stops jump levels, and limits sit untouched while price races past them.
Nobody promises a specific fill in fast conditions. Plan for a worse one and the surprise disappears.
Watching One Currency Only
A pair contains two currencies, so filter the calendar for both. Half the unexplained moves traders report come from the leg they ignored.
The habit spreads further than people notice. Traders holding three pairs often track four currencies instead of six.
Treating the Impact Rating as Fixed
Ratings reflect typical importance, not current attention. Check which theme the market has traded recently, then weight the rows accordingly.
A simple test works well. Look at how your pair moved on the last two releases of that type, and let that behaviour override the star count.
Forgetting That Liquidity Varies by Hour
The same release lands differently at seven in the morning and at three in the afternoon. Depth changes with the session, so the reaction changes too.
Check which centres are open. A release into a thin hour produces wider spreads and larger gaps than the identical print during an overlap.
Chasing the First Move
The first print draws fast systems that trade the number alone. People read the detail afterwards and often reach a different view.
So the opening spike frequently reverses. Waiting for the second reaction costs a few pips of the move and removes most of the guesswork.
What the Calendar Cannot Tell You
The calendar handles timing beautifully and direction not at all. Three limits deserve stating plainly.
It Cannot Tell You Which Way Price Goes
No column predicts direction. The rating tells you a release usually matters, and the consensus tells you what price roughly holds.
Direction depends on positioning nobody publishes. A crowded trade unwinds on a mild surprise, while a lightly held one shrugs off a large one.
So anyone offering a directional call from a calendar row has added an assumption. Ask what that assumption is before believing it.
It Cannot Tell You How Big the Move Will Be
Two releases with identical ratings produce wildly different ranges. The market’s current attention decides that, and attention rotates.
Historical range around an event helps a little. Use it for sizing rather than for expectation, since the average hides enormous variation.
It Cannot Cover Unscheduled Events
Interventions, political shocks and emergency meetings appear on no calendar. Those moves run furthest, precisely because nobody positioned for them.
Leave room for that. A plan built entirely around scheduled risk still meets the unscheduled kind a few times a year.
A Quick-Reference Checklist
Run this before any week that contains a high-impact release.
- Calendar time zone set to your own, and rechecked after any clock change
- Filter applied to both currencies in every pair you hold
- High-impact rows for the week copied into one visible list
- Consensus and previous figures noted for each of those rows
- A written response per event: flat, reduced, or held with a wider stop
- Revision line checked as soon as the number lands
- The reaction recorded afterwards, in one sentence
Seven lines. None of them asks you to predict a number.
Work through the list on Sunday and the week costs you nothing further. Most of it stays valid until the next clock change.
Skip it and you outsource your position sizing to luck. That trade-off makes the ten minutes fairly easy to justify.
When a Weak Close Still Runs
The bar closed weakly, yet the move ran anyway: it finished near the middle of its own span, and the next five hours travelled more than three times that span below it. That sentence describes an hourly bar on CADJPY from 30 July 2026, and it explains why a mid-range close settles nothing on a busy calendar day.

What the Bar Actually Did
The bar spanned roughly 6.4 times the recent average range. Its body covered only about half of that range, so it closed near the middle rather than at an extreme.
A close like that reads as indecision. Buyers and sellers both showed up, and neither finished the hour in control.
Yet indecision inside one hour predicted nothing about the next five. Sellers returned, and price left that whole range far behind.
Why the First Print Is Not the Settled Price
Fast systems react within a second. They trade the headline figure and nothing else.
People arrive next, reading the detail, the revision and the sub-components. That second wave often disagrees with the first.
The gap between those two reactions creates the wick. Anyone chasing the initial move often buys precisely the part the market gives back.
What to Do With That
Let the first minutes pass. The settled price after the dust clears tells you far more than the extreme did.
Volatility tools help you size for these conditions. Our volatility indicators archive collects tools that measure typical range, which is exactly what you need before an event.
Above all, stop reading a spike as a verdict. It records a disagreement, and disagreements resolve slowly.
The Honest Summary
Releases move price, and direction is frequently counter-intuitive. What happens next depends on what the market already held.
Nobody should call this easy. Spreads widen, slippage grows, and fills arrive at prices nobody quoted a second earlier.
Use the calendar for the job it does well. It tells you when to carry less risk, and that alone justifies the ten minutes a week.
Related Guides Worth Reading Next
Two follow-ups fit naturally here. Both build directly on the calendar routine above.
Our guide to what NFP means in trading takes the single most watched recurring release and shows how a whole week bends around it. Read it alongside this one and the payrolls example above makes more sense.
Then check forex news release times for the schedule itself, and our overview of how to use fundamental analysis for the wider framework the calendar sits inside.
FAQ
Which economic calendar should I use?
Any calendar showing time, currency, impact rating, actual, consensus and previous will do. The consensus column matters most, since a calendar without it leaves out the figure that drives the reaction. Set your own time zone before anything else, and check that setting after seasonal clock changes.
What do the impact ratings actually mean?
They rank how much a release typically moves markets, based on history rather than this week’s conditions. High usually covers rate decisions, inflation, employment and headline growth. Treat the rating as a first filter, then adjust it for whichever theme the market currently trades.
If the actual beats the consensus, will the currency rise?
Often, but far from reliably. Price already reflects the outcome most traders expected, so a beat that everyone forecast can trigger profit-taking instead of buying. Weak internals, a downward revision or a rotation in market theme can all turn a strong headline into a lower currency.
Should I close positions before a release?
That depends on your horizon and your size. Short-term traders commonly stand aside, while longer-term positions often ride through with a wider stop and reduced exposure. The important part is deciding in advance, because a decision made seconds before a print rarely reflects your actual plan.
Why did my stop fill worse than the level I set?
Because a stop becomes a market order when touched, and around releases the next available price can sit some distance away. Liquidity thins as market makers pull quotes, so orders fill at whatever remains. That behaviour is normal execution in fast conditions rather than a fault with your broker.
How long before the calendar becomes useful?
The mechanics take one session to learn. Reading reactions well takes a few months of written notes, because you need a record of how your own pairs respond to different sizes of surprise. Keep the notes short, review them monthly, and judge the routine over a long run rather than after any single event. Results are not guaranteed; past performance is not indicative of future results.
External references
- For background on this concept, see Consensus Forecast on Wikipedia.
- For broader market context, see Meeting and Event Calendar at the Federal Reserve.

About the author
Written by Dominic Walsh, a Forex trader and MT4/MT5 indicator, Expert Advisor and script developer. Every tool on forexmt4systems.com is tested on live charts before release and ships with ready-to-use compiled MT4 (.ex4) and MT5 (.ex5) files. Learn more about the trader and developer behind this site.
How we build, test and correct every tool: Editorial & Testing Policy. Trading carries risk; see the disclaimer.