
Ask what is NFP in trading and you get two answers. One is a monthly American jobs report, and the other is the reason your spread triples for ten minutes on the first Friday of every month.
Both answers matter. This guide covers the report itself, what the market actually reacts to, and why the direction so often surprises the people who read the number correctly.
What Is NFP in Trading
NFP stands for nonfarm payrolls. It counts the change in the number of paid workers in the United States, excluding farms, over the previous month.
The Bureau of Labor Statistics publishes it. Release time is 8:30 in the morning, New York time, usually on the first Friday of the month.
That schedule is the useful part. Unlike most market-moving events, you know the exact minute weeks in advance.

The chart above shows USDCHF four-hour bars around the June 2026 release. The bar carrying the payrolls reaction spanned 3.43 times the recent average range, and it closed at its own high.
What the Report Contains
Three figures arrive together and all three matter. The payroll change grabs the headline, though it rarely acts alone.
The unemployment rate lands at the same moment. It comes from a separate household survey, so it can move in a direction the payroll figure seems to contradict.
Average hourly earnings complete the set. Wage growth feeds into inflation expectations, and in some months it moves markets more than the jobs count does.
What Nonfarm Excludes
The name is literal about farms and quietly broad about everything else. Agricultural workers sit outside the count, as do private household employees.
Non-profit staff and the self-employed also fall outside it. Active military personnel are excluded too, which surprises people the first time they check.
Even so, the survey still covers the large majority of American paid employment. That coverage is why one number carries so much weight.
Revisions Arrive With Every Release
Each report revises the previous two months. Those revisions frequently run into the tens of thousands of jobs in either direction.
Markets sometimes react more to a revision than to the headline. A strong current month sitting beside a heavy downward revision tells a mixed story.
So read the whole release rather than the first line. Traders who act on the headline alone act on a third of the information.
Why Traders Care So Much
Jobs data shapes what the central bank does next. Rate policy then moves the currency, so the link runs through rates rather than through jobs.
The dollar sits on one side of most forex trades. So a US number reaches almost every chart you might trade.
Timing helps as well. You know the date and the minute, which makes the event easy to plan around.
A Simple Routine for the First Friday
You do not need a clever system for this day. You need a plan you wrote before the number landed.
The Night Before
Check the date and time on the calendar. The first Friday is the norm, and holidays or shutdowns shift it now and then.
Note the consensus for all three figures. Write them down, since you will not have time to look them up later.
Then decide what you hold into the release. An open trade you forgot about is the worst way to meet a wide spread.
The Hour Before
Mark the levels that matter on your chart. Yesterday’s high and low, the week’s range, and any level price has respected lately.
Cut your normal size well before the print. Range on these bars runs several times its usual width, so the same lot risks far more money.
Then step back from the mouse. Nothing useful happens in the last ten minutes.
After the Print
Let the first bar close before you form a view. The spread is wide, the book is thin, and the first move often reverses.
Compare each figure with the consensus you wrote down. Then look at where the bar closed inside its own range.
Log what you saw whether you traded or not. Twelve of these notes a year build a picture nobody can hand you.
How an NFP Release Reaches Your Chart
The sequence repeats every month. Knowing it stops the first thirty seconds from feeling like chaos.
- Publication at 8:30 New York time. Headline, unemployment rate and earnings all appear at once.
- Algorithms react first. The initial move happens in milliseconds, far faster than any manual order.
- Spreads widen sharply. Liquidity providers pull quotes, and the book thins for a period.
- The surprise gets measured. Traders compare each figure against consensus rather than against zero.
- Revisions reset the picture. A changed prior month can flip the reading entirely.
- Liquidity returns. Direction settles once normal participants come back into the market.
Step four is where most retail losses begin. Because the consensus already sits in the price, the absolute number tells you almost nothing on its own.
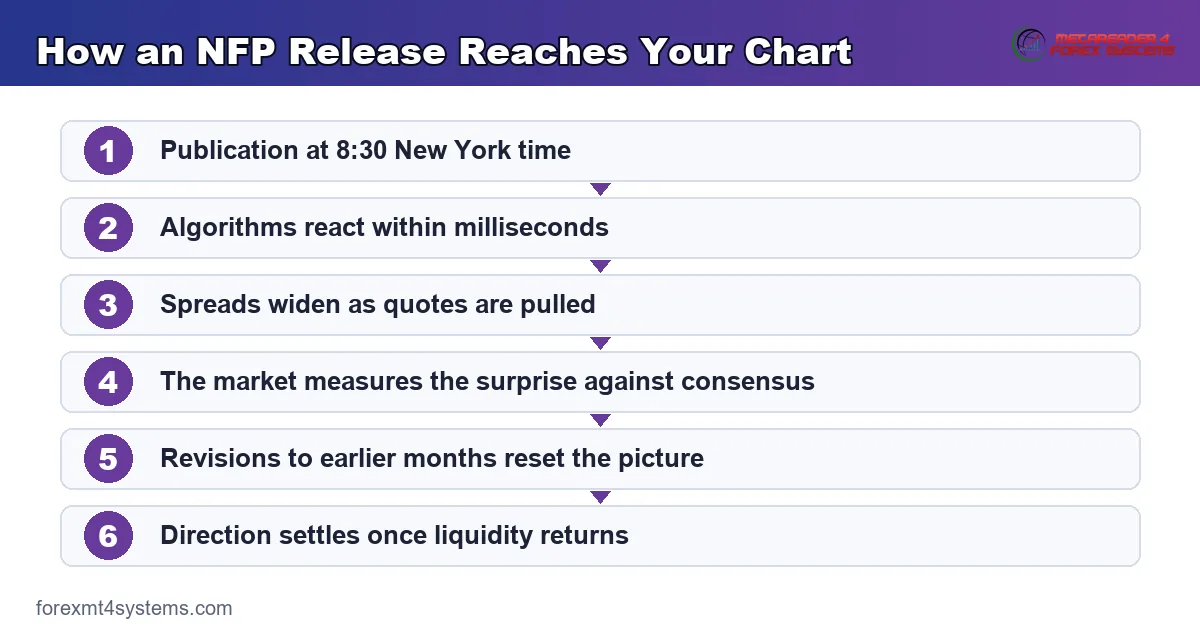
Keep that order in mind on the day. Our economic calendar shows the consensus alongside the previous reading for every scheduled release.
The Same Release on Two Instruments
One release, two majors, two very different aftermaths. Comparing them teaches more than either chart does alone.
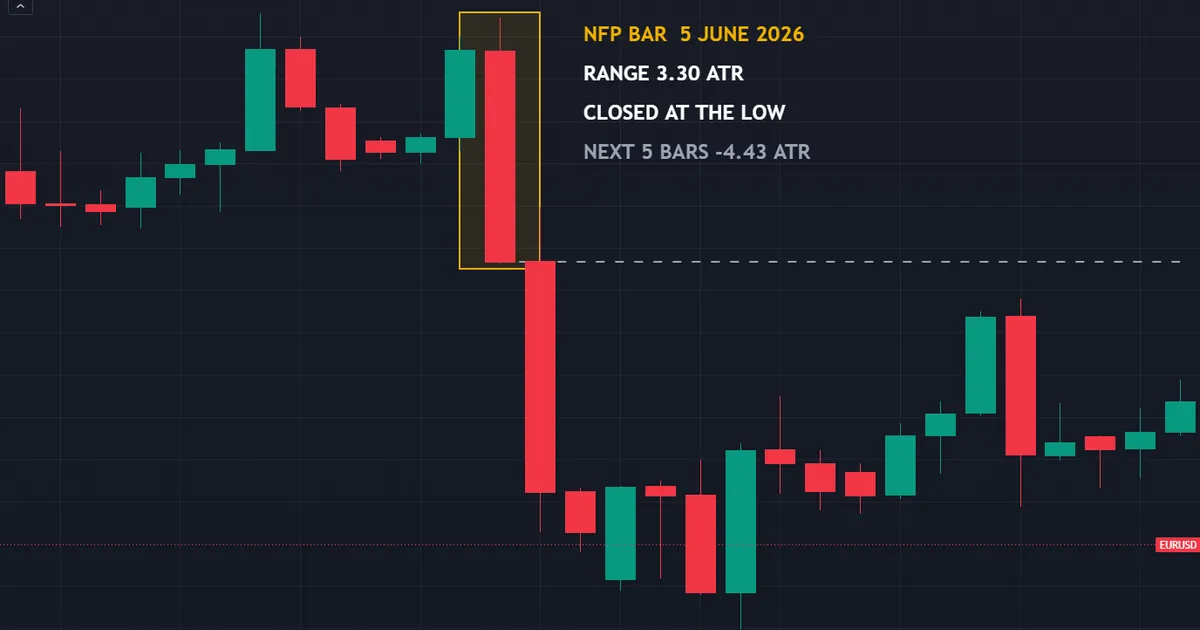
Reading the EURUSD Bar
The chart above shows EURUSD four-hour bars from the same June 2026 release. The bar carrying the reaction spanned 3.30 times the recent average range, opening at 1.16366 and closing at 1.15866.
So the euro finished lower against the dollar. It closed within a fraction of a pip of its own low, which says the move held rather than fading within the session.
Then the next five bars carried price a further 4.43 ranges lower. In short, the aftermath covered more ground than the payrolls bar itself.
Comparing With the Franc
USDCHF produced a bar of almost identical size. Its range measured 3.43 average ranges against the euro pair’s 3.30, so the two charts started from much the same place.
Then the aftermath split them. The next five bars added 2.88 ranges of further dollar strength on the franc, against 4.43 ranges on the euro.
Both charts showed the dollar higher, and both extended rather than faded. The size of that extension still differed by more than half, on exactly the same information.
What the Comparison Teaches
Instrument choice changes the trade more than the number does. One release lands on every dollar pair at once, and each pair digests it at its own pace.
Costs vary the same way. A pair carrying a wider normal spread widens further at the release, so an identical bar size arrives with a heavier toll.
Neither outcome repeats reliably. Next month the same two instruments can swap roles entirely, which is precisely why no rule survives here.
What Actually Happens in the First Minutes
Retail coverage of news trading skips the execution reality. That reality decides whether any of this is workable.
Spreads Widen, Sometimes Enormously
A major pair quoting under a pip can quote several pips at 8:30. Exotic pairs widen far more than that.
Our guide to why spreads widen explains the mechanism in full. The short version: liquidity providers stop quoting tightly when they cannot price the risk.
Budget for the widening rather than hoping it stays away. A strategy that only works at normal spreads does not work here.
Slippage and Uncertain Fills
Price moves between your click and the broker’s execution. That difference is slippage, and around a release it can run into many pips.
Slippage is not misconduct by default. It reflects a market where the price you saw has already gone by the time your order arrives.
Stop orders suffer the same way. A stop becomes a market order when touched, so it fills at whatever price exists rather than at your level.
Why the First Direction Often Reverses
The opening move reflects the fastest readers of a single line. Deeper readings arrive over the following minutes.
Earnings, revisions and the household survey all take longer to digest. When they contradict the headline, the initial move unwinds.
So a spike is not a signal. Our guide to using news to trade forex covers the approaches that survive this problem.
Download the complete indicator database
Put these concepts on your charts. One email unlocks the full library of 1,380+ indicators with compiled MT4 and MT5 files, plus my TradingView scripts. No paywall, no spam, unsubscribe any time.
Get free access to my indicator database
One email unlocks 1,380+ free MT4, MT5 and TradingView indicators — the complete library. No single-tool download; you get the whole database.
Why Priced In Decides Everything
This single idea explains most confused reactions to data. Markets trade expectations, and the expectation already sits in the price.
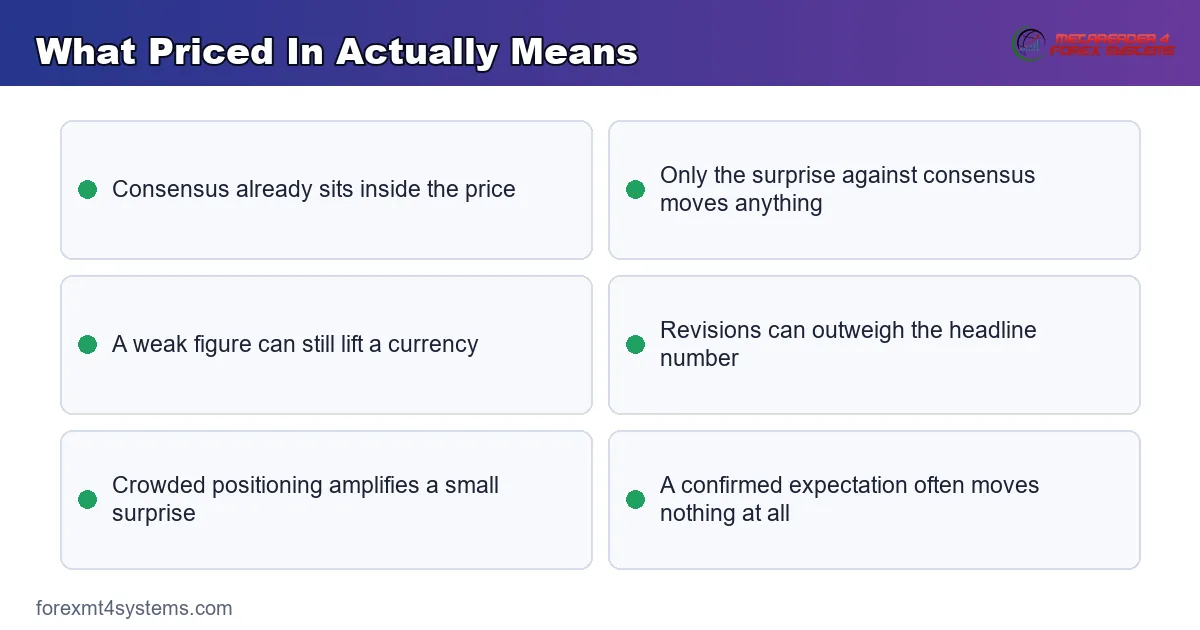
The Surprise Is the Only Input
Before the release, analysts publish a consensus figure. Traders position for that figure, so the price already reflects it.
When the actual number matches, very little should happen. Movement comes from the gap between the print and the expectation.
A weak number can therefore lift a currency. If the market braced for something worse, the release counts as good news relative to the fear.
Where to Find the Consensus
Most calendars publish a forecast beside each release. That figure is the market’s rough expectation, and your print gets compared against it.
Forecasts differ a little between providers. Pick one source and stay with it, so your notes stay comparable from month to month.
Write the number down before the release. Reading it afterwards is far too easy to do with hindsight attached.
Positioning Amplifies or Mutes It
Crowded positioning turns a small surprise into a large move. Everyone leaning one way has to unwind at once when the print goes the other way.
Light positioning does the opposite. A genuine shock can land with a shrug because nobody had much to adjust.
You cannot see positioning directly. You can, however, notice when a view has become the consensus story across every commentary you read.
Why the Reaction Sometimes Reverses Twice
The first move reads the headline. The second reads the detail, and the two often disagree.
A strong payroll count beside weak wage growth splits the story. Traders who bought the first line then sell into the second.
So a double reversal is normal rather than strange. It shows a market working through three figures in sequence.
The Rate Path Does the Real Work
Employment data matters mainly through what it implies for interest rates. That transmission is the whole reason currency traders watch it.
Our guide to how interest rates affect forex covers the chain in detail. Inflation data sits alongside it, which our guide to CPI in forex explains.
Rate expectations can already reflect the jobs picture. In those months payrolls barely register, and traders who expected fireworks sit through a quiet Friday.
Common NFP Trading Mistakes and the Fixes
Most damage on release day comes from a short list of habits. Each has a fix that costs nothing beyond patience.
Trading the First Ten Seconds
Spreads are widest and fills are least reliable in that window. Wait for liquidity to return, then trade the settled move instead of the spike.
The cost of waiting is a few pips. The cost of not waiting can be the whole trade.
Predicting the Direction From the Number
A strong print does not reliably lift the dollar. Compare the figure with consensus, then watch what the market does rather than deciding what it should do.
Your job is to read the reaction. It is not to be right about the economy.
Holding a Position Through the Release Unplanned
A trade opened for technical reasons can meet an event it never accounted for. Check the calendar before entering, then either close, hedge or size for the volatility deliberately.
A stop does not protect you inside a fast move. It fills at the next price the market offers.
Using Normal Position Size
Range expands by several multiples on release bars. Our guide to position sizing covers scaling the position to the volatility rather than to habit.
Halve the size and you halve the damage. That one change fixes more release-day problems than any entry rule.
Ignoring the Rest of the Report
Earnings and revisions regularly override the headline. Read all three figures before forming any view, because the market certainly does.
The headline is one line of a long release. Treat it as a summary rather than the news.
Forgetting Account Rules
Many funded accounts restrict trading around scheduled releases. Our guide to prop firm news trading rules covers the restrictions that catch traders out.
Some rules ban the trade, others just void the profit. Read yours before the first Friday, not after it.
NFP Quick Reference
Keep this table beside the chart on the first Friday. Each row states a condition rather than an outcome.
| Element | What to check | Common practice |
|---|---|---|
| Timing | First Friday, 8:30 New York time | Confirmed on the calendar, since exceptions happen |
| Publisher | US Bureau of Labor Statistics | Read the release, not a headline summary |
| Headline | Payroll change against consensus | The surprise matters, not the level |
| Unemployment rate | From a separate household survey | Can disagree with the payroll figure |
| Average hourly earnings | Wage growth feeding inflation views | Sometimes the biggest mover of the three |
| Revisions | Changes to the prior two months | Read before reacting to the headline |
| Execution | Spread, slippage, stop behaviour | Assume the worst case, not the average |
Notice what the table refuses to include. No column suggests which way price will go, because the same figure produces opposite reactions in different months.
Our guide to reading the economic calendar covers how to prepare for the whole month rather than one Friday.
When the Spike Does Not Hold
The spike did not hold: the bar closed well off its extreme, and the following bars recovered about 1.11 ATR back up, so the initial move faded. That single sentence describes the most common disappointment around volatile data bars.

Reading the Bar Honestly
The chart above shows an outsized AUDJPY four-hour bar, which we are deliberately not attributing to any named release. It spanned 9.28 times the recent average range.
Price opened at 113.659 and fell as far as 110.904. Then it closed at 112.114, well above that low.
That close is the tell. A bar covering enormous ground yet finishing far from its extreme shows the move meeting real resistance.
Why the Fade Catches People
Traders who sold near the low bought the story the bar told at its worst moment. The following bars then recovered another 1.11 ranges against them.
Momentum entries suffer most here. Chasing a bar that has already travelled nine ranges leaves almost no room between entry and any sensible stop.
Waiting for the close costs you the fastest part of the move. It also removes the trades where the fastest part was the whole move.
Why We Do Not Name the Cause
Attributing a bar to a specific release requires proof, not a plausible story. Several things move a currency pair at once, and month-end flows alone can produce bars like this.
NFP is the rare exception worth naming. Its schedule is fixed and public, so the bar covering 8:30 on the first Friday genuinely contains that release.
Everything else deserves caution. A confident explanation invented after the fact teaches you nothing you can use next time.
Building a Rule From It
Measure the close against the bar range before acting. A bar closing near its extreme carries a different message from one closing halfway back.
Record both numbers each month. After a year you hold a genuine sample of how your instruments behave on release days.
Compare the three charts in this guide. Both payrolls bars closed at an extreme and then extended, while this one closed mid-range and handed ground back.
Resist the urge to call that a rule. Three bars line up neatly here, and three bars settle nothing at all.
What to Do Instead
Trade the second move rather than the first. Once the spread narrows and a bar has closed, you have a level to work with.
Use the release bar itself as your boundary. Its high and low mark the range the market considered on the day.
Skip the month if nothing clean appears. Twelve releases a year means you can afford to sit out most of them.
Related Topics to Study Next
Inflation data sits alongside employment in importance. Both feed the rate expectations that actually drive currencies, and each has months where it dominates the other.
Calendar discipline underpins all of it. Knowing which releases carry weight, and which are noise dressed up as events, saves more money than any entry technique.
Volatility measurement completes the picture. Expressing every release bar as a multiple of the recent average range lets you compare a franc reaction with a euro one sensibly.
Central bank meetings deserve the same preparation. They follow a published schedule too, and they move rate expectations more directly than any single data print.
One habit outranks the rest. Recording each release you trade, including the ones you sit out, builds the only evidence base that applies to your instruments and your broker.
Start that log this month. Note the three figures, the consensus, the bar range and where the bar closed, and the pattern shows itself within a year.
FAQ
What is NFP in trading?
NFP means nonfarm payrolls, a monthly count of the change in paid American employment excluding farms. The Bureau of Labor Statistics publishes it at 8:30 New York time, usually on the first Friday of each month.
Why does NFP move currency prices?
Employment data shapes expectations for interest rates, and rate expectations drive currencies. A release that changes the expected rate path changes the currency, while one that confirms existing views often passes quietly.
Can I predict the direction from the number?
No, and trying to is the most common mistake around this release. The consensus already sits in the price, so only the surprise matters, and revisions or wage growth can reverse the headline reading entirely.
What happens to spreads during NFP?
They widen sharply, often to several times their normal level, and they stay wide for some minutes. Slippage grows at the same time, so the price you see may differ considerably from the price you get.
Does NFP always land on the first Friday?
Almost always, though exceptions happen. A public holiday or a government shutdown can shift the date, so confirm it on a calendar each month rather than assuming the pattern holds.
Should I hold positions through the release?
That depends on your plan rather than on the event. Check the calendar before entering any trade, then decide deliberately whether to close, reduce or accept the volatility, and never let the decision happen by accident.
Is trading NFP a good idea for beginners?
The fixed schedule makes it tempting, and the execution conditions make it demanding. Wider spreads, uncertain fills and rapid reversals all punish inexperience, so many traders spend several months simply observing the release before risking anything on it. Log what you see, size small when you do trade it, and treat every month as one data point rather than a pattern. Results are not guaranteed; past performance is not indicative of future results.
External references
- For background on this concept, see Employment-to-Population Ratio on Wikipedia.
- For broader market context, see Bureau of Labor Statistics at Investopedia.

About the author
Written by Dominic Walsh, a Forex trader and MT4/MT5 indicator, Expert Advisor and script developer. Every tool on forexmt4systems.com is tested on live charts before release and ships with ready-to-use compiled MT4 (.ex4) and MT5 (.ex5) files. Learn more about the trader and developer behind this site.
How we build, test and correct every tool: Editorial & Testing Policy. Trading carries risk; see the disclaimer.