
How do interest rates affect forex? Money tends to travel toward the currency that pays more to hold it, so every shift in policy rates changes where that money wants to sit.
That answer covers the first layer only. This guide adds the layer most articles skip, because the market prices the next decision long before it lands, and that timing explains why so many reactions look backwards.
How Do Interest Rates Affect Forex in Plain Terms
A currency pays a return simply for holding it. That return comes from the interest attached to deposits in that currency.
Raise the rate and holding the currency pays better. Cut it and the reward shrinks, so some holders look elsewhere.
Capital chases the better return across borders. Buying one currency to earn that return means selling another, and the exchange rate carries the pressure.

The chart above tracks the United States ten-year yield on daily bars. Long stretches of quiet drift give way to sharp repricing whenever the outlook for policy shifts.
Policy Rates Set the Floor
Each central bank picks a short-term rate. Banks lend to each other around that level, so it anchors everything above it.
Mortgages, business loans and deposit accounts all take their cue from that anchor. So do the money market rates your broker uses to price overnight positions.
One decision therefore ripples a long way. That single number touches every price with a maturity attached to it.
Bond Yields Do the Heavy Lifting
Currency traders watch yields more closely than policy rates. A yield moves every day, while a policy rate changes eight times a year at most.
Because yields update constantly, they carry the market’s running view of where policy heads next. A two-year yield tells you what traders expect over the next couple of years.
So a rising ten-year yield often precedes any policy change at all. Our guide to central bank rate decisions covers what happens on the day itself.
Curve Shape Adds the Timing
Yields exist at many maturities at once. Plot them together and you get a curve, which carries information no single rate can.
Short maturities react to the next few meetings. Long maturities carry views on growth and inflation years ahead.
So a curve that steepens tells a different story from one that flattens. Traders read the shape for timing, then read the gap against another country for direction.
The Gap Matters More Than the Level
A single rate tells you very little. Currencies trade in pairs, so what counts is one country’s rate against another’s.
Five per cent looks generous next to one per cent. It looks poor next to eight per cent, and the pair reflects the comparison rather than the headline.
That comparison has a name and its own arithmetic. Our explainer on the interest rate differential in forex works through the sums.
The Route From a Decision to a Currency Move
Six links connect a meeting room to your chart. Follow them in order and the reaction stops looking random.
- A central bank sets the policy rate. The decision arrives with a statement and, at some banks, a forecast.
- Money market rates adjust immediately. Overnight lending reprices within minutes of the release.
- Bond yields reprice along the curve. Short maturities move most, long maturities move least.
- The gap against other countries changes. Traders compare the new yield with the yield available elsewhere.
- Cross-border flows follow the wider gap. Funds shift deposits, hedges and bond holdings toward the better return.
- The exchange rate moves, then expectations reset. Attention turns to the next meeting almost at once.
Step six deserves the most attention. Each decision resets the starting point for the following one, so the cycle never really pauses.
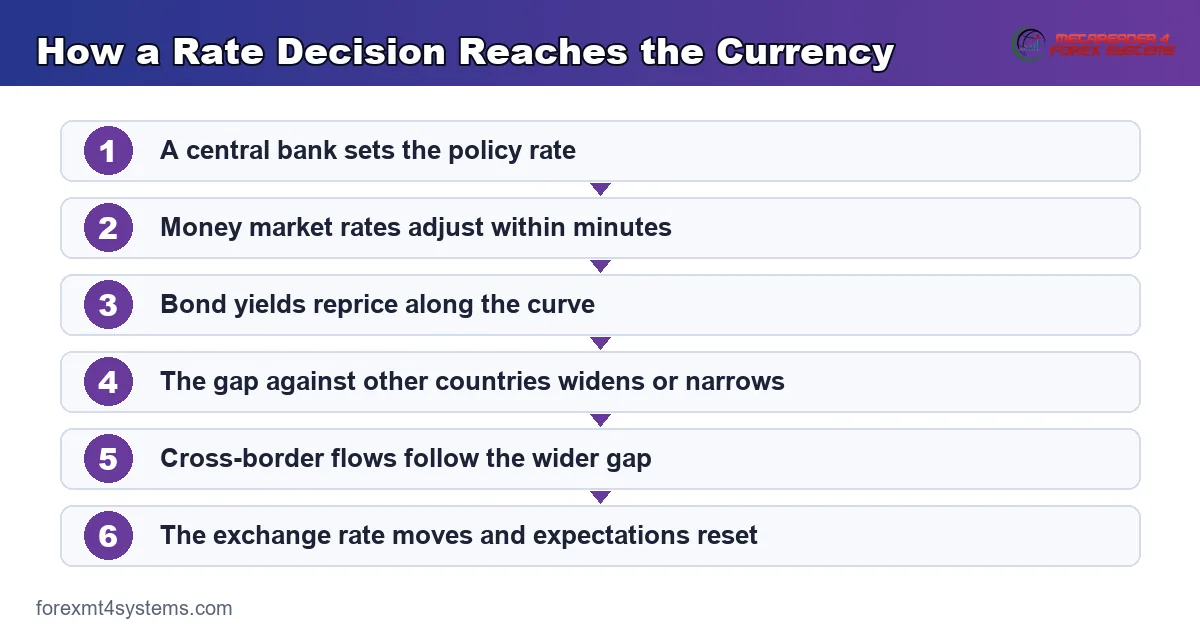
Notice what the chain leaves out. Nothing in it promises a direction, because two of the six steps depend on what traders already expected.
Expectations Move First, So the Print Often Disappoints
Here sits the idea that separates a useful read from a naive one. Markets trade the future, not the present.
What Priced In Actually Means
Traders form a view weeks ahead of any meeting. They buy and sell on that view, so today’s exchange rate already reflects the outcome they consider likely.
Suppose everyone expects a quarter-point rise. Positions shift toward that outcome long before the day arrives.
Then the rise lands exactly as forecast. Nothing new reached the market, so the currency may barely twitch or even slide as traders take profit.
Why a Cut Can Lift a Currency
Now take the counter-intuitive case. A central bank cuts, and the currency climbs.
That looks wrong until you check what the market feared. If traders had positioned for a larger cut, a smaller one lands as relatively hawkish news.
The reaction measures the gap against expectations. It never measures the direction of the change on its own.
Where the Expectation Lives
You can read the market’s view before the event. Short-dated yields and interest rate futures both carry an implied path for policy.
Forecast columns in a calendar do a rougher version of the same job. Our economic calendar lists the consensus beside each release so you can see the bar the print has to clear.
Check that bar first, every time. A trader who knows only the actual number knows half the story.
Who Actually Moves the Money
Flows do the work, not opinions. Three groups act on a rate gap, and each moves at a different speed and size.
Bond Investors Move First and in Size
Pension funds and reserve managers hold enormous bond portfolios. A wider yield gap makes one country’s government debt look better than another’s.
Buying that debt means buying the currency first. So a shift in relative yields turns into currency demand almost mechanically.
Many of those buyers hedge the currency leg, which mutes the effect. Their hedging decision therefore matters as much as the purchase itself.
Companies Hedge Their Future Revenue
An exporter knows roughly what it will receive in six months. Locking that amount in today removes the uncertainty from a budget.
Forward contracts price off the rate gap directly. Change the gap and you change the cost of every hedge a company rolls over.
Corporate flow rarely makes headlines. It runs steadily in the background, and it explains plenty of moves that no news story covers.
Leveraged Traders Move Last and Loudest
Speculators chase the same gap with borrowed money. Their positions build slowly while conditions stay calm.
Leverage magnifies both the flow and the eventual reversal. When that crowd exits together, the move looks nothing like the underlying rate story.
So a quiet fundamental picture can still produce a violent week. Positioning, not policy, causes most of those episodes.
Reading the Yield Chart Beside the Currency Chart
Two charts teach more than one. Put a yield beside a currency index and the relationship shows its own limits.

What the Currency Leg Shows
The chart above tracks the dollar index over the same window as the yield chart. Broad trends run for months at a time rather than reversing weekly.
Stretches of the two charts clearly rhyme. Yields climb, the index climbs, and the story looks tidy.
Other stretches part company completely. That divergence carries the real lesson, so study it rather than skipping past it.
Why the Link Loosens
Rates never act alone. Growth, trade balances, commodity prices and plain risk appetite all pull on the same exchange rate.
Safe-haven demand overrides the rate story regularly. During a scare, money runs toward the dollar, the yen and the franc whatever the yield gap says.
Positioning adds another layer. A crowded trade unwinds violently even when nothing in the rate picture changed, as our guide to the carry trade unwind shows in detail.
Use the Relationship as a Backdrop
Treat the yield gap as context rather than a trigger. It tells you which way the tide runs, and it says nothing about the next hundred pips.
Traders who demand a tick-by-tick match give up quickly. Those who use it to frame a bias tend to keep it for years.
A practical version takes one line in a notebook. Note which side of the pair currently pays more, then let your technical work choose the entries within that bias.
Download the complete indicator database
Put these concepts on your charts. One email unlocks the full library of 1,380+ indicators with compiled MT4 and MT5 files, plus my TradingView scripts. No paywall, no spam, unsubscribe any time.
Get free access to my indicator database
One email unlocks 1,380+ free MT4, MT5 and TradingView indicators — the complete library. No single-tool download; you get the whole database.
Real Rates Beat Headline Rates
One refinement improves the read a great deal. Subtract inflation from the nominal rate and you get the real rate.
Why the Adjustment Matters
A ten per cent rate sounds attractive. Sitting beside twelve per cent inflation, it delivers a loss in purchasing power.
Investors care about what the money buys later. So a high nominal rate in a high-inflation country attracts far less capital than the headline suggests.
Countries with low inflation and modest rates can therefore out-attract them. That mismatch explains many currency moves that make no sense on nominal numbers alone.
How Traders Approximate It
Take the policy rate and subtract the latest annual inflation print. Rough, quick, and good enough for a bias.
Bond markets do a cleaner version. Inflation-protected bonds trade against ordinary ones, and the difference gives a market-implied inflation rate.
Either method beats reading the nominal rate on its own. Pair it with our note on hawkish versus dovish language for the qualitative half.
Not Every Currency Responds the Same Way
Rates matter everywhere, though not equally. Three broad groups behave differently enough to deserve separate handling.
Reserve and Haven Currencies
The dollar, the yen and the franc carry a second job. Investors buy them during a scare regardless of what the yield gap says.
That dual role muddies any simple rate read. A haven currency can rally on falling yields, purely because fear outweighed the return on offer.
Watch volatility gauges alongside the rate picture. When fear dominates, park the rate argument until conditions calm down.
Commodity-Linked Currencies
The Australian, Canadian and New Zealand dollars follow export prices too. Iron ore, oil and dairy all pull on those exchange rates.
Rates still matter, yet they compete with a second driver. A rate cut alongside a commodity rally can leave the currency flat or higher.
Track both inputs before forming a view. Otherwise you will keep blaming the central bank for moves the commodity market caused.
High-Yield Emerging Currencies
Some countries offer double-digit rates. That headline looks tempting until you check inflation and political risk beside it.
Those currencies attract capital in calm periods and lose it violently in scares. The higher return compensates holders for exactly that pattern.
Trading them demands smaller size and wider stops. Costs run higher too, since spreads and financing charges both widen away from the majors.
A Weekly Routine That Keeps the Picture Current
Rate work rewards consistency over intensity. Twenty minutes each weekend keeps the whole picture fresh.
Update the Rate Table
List the currencies you trade and note the current policy rate beside each. Add the latest annual inflation print in the next column.
Subtract one from the other for a rough real rate. Rank the list, and the strong and weak candidates separate themselves.
Keep the same table week after week. Changes stand out immediately when the format never varies.
Mark the Calendar Before the Week Starts
Note every rate decision and inflation release in the week ahead. Flag the ones affecting pairs you already hold.
Decide in advance how each event changes your plan. A position you would not open before a decision probably should not stay open through it either.
Write the consensus forecast beside each entry. That number, not the eventual print, sets the bar for any reaction.
Review What the Market Already Believes
Glance at two-year yields for your main currencies. Compare them with where they sat a month ago.
Rising short yields signal that traders expect tighter policy ahead. Falling ones signal the opposite, and both often move well before any official statement.
Then read one central bank statement in full. Skimming summaries teaches you far less than one careful pass through the primary text.
Common Mistakes When Trading Rate Moves
Most losses around policy trace to a handful of habits. Each has a fix that costs nothing but patience.

Treating a Hike as an Automatic Buy
A rise with no surprise attached moves very little. Compare the decision with the forecast before forming any view, and skip the trade when the two match.
Ignoring the Statement and the Forecasts
The number grabs headlines, while the guidance often does the damage. Read the statement wording and any published projection path, because those shape the next six months.
Trading the First Spike
Spreads widen sharply around a release and slippage becomes ordinary rather than exceptional. Wait for the dust to settle, or size down so a wide fill cannot hurt much.
Using One Country’s Rate in Isolation
A pair reflects two economies at once. Track both legs, since a currency can weaken on strong domestic data if the other side improved faster.
Forgetting the Cost of Holding
Positions accrue or pay a financing charge every night. Check the swap on any trade you plan to hold for weeks, because the drip adds up quietly.
Assuming the Relationship Never Breaks
Yield gaps and exchange rates part company for months at a time. Size positions so a long divergence costs you patience rather than your account, and keep risk per trade constant while you wait.
Rates and Currencies Quick Reference
Keep this table beside your calendar. Each row states a condition rather than a prediction.
| Input | What to check | Why it matters |
|---|---|---|
| Policy rate | The level and the direction of the last change | Anchors every other rate in the economy |
| Two-year yield | Where it sits against three months ago | Carries the market’s view of the next policy moves |
| Rate gap | The difference between the two countries in the pair | Drives cross-border flows and the overnight swap |
| Inflation | The latest annual print for each country | Converts a nominal rate into a real one |
| Consensus forecast | What the market expects before the release | Sets the bar the actual number must clear |
| Guidance | Statement wording and projection paths | Often moves the currency more than the decision |
| Risk appetite | Volatility gauges and equity behaviour | Overrides the rate story during a scare |
Notice the absence of any strike rate or reliability figure. No fixed relationship exists between a rate change and a currency move, so no honest table can supply one.
What Goes Wrong in Practice
Theory reads cleanly, and live markets rarely cooperate. Four failure modes account for most of the frustration.
The Move Happened Before You Read About It
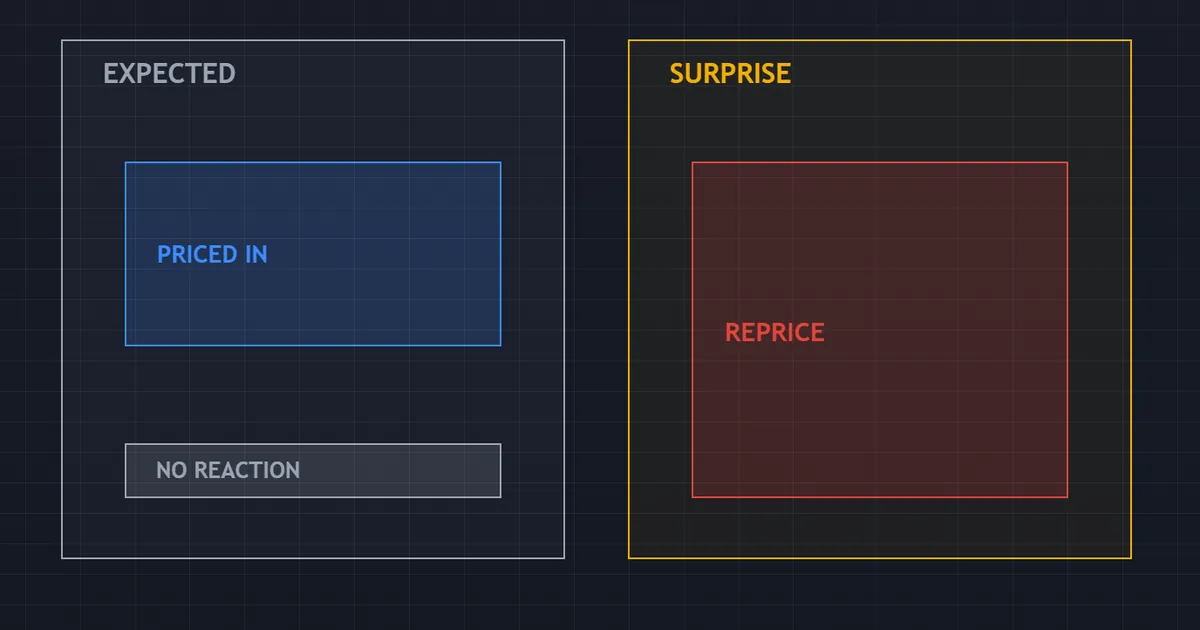
By the time a rate change reaches the news, positioning already shifted. Traders who enter on the headline buy the end of a move rather than the start.
The panel above contrasts a fully anticipated decision with a genuine surprise. Only the second one leaves room for a fresh trade.
The Currency Moved the Wrong Way
A strong economy can produce a weaker currency for weeks. Flows respond to relative changes, and the other side of the pair may have improved faster.
Nothing about that outcome breaks the theory. It simply shows that one variable never explains a two-sided price.
The Spread Ate the Edge
Costs jump around releases and fills drift away from the screen price. A five pip idea disappears entirely when the spread triples for a minute.
So the honest fix reduces size rather than sharpening the entry. Our note on swap in forex covers the second cost that builds while you hold.
The Rate Story Reversed Mid-Trade
One soft inflation print can flip an entire policy outlook. A position built on a widening gap now faces a narrowing one, and the chart turns before any official change arrives.
Plan the exit before that happens. A written invalidation level saves you from arguing with the market about who was right.
Related Ideas Worth Studying Next
Rate differences pay a daily amount to one side of every trade. Our guide to the carry trade meaning explains how traders try to collect it and what it costs them in risk.
Relative strength across many pairs sharpens the picture too. The currency strength indicators archive collects tools that rank currencies against each other rather than in pairs.
One habit outranks all this reading. Track two or three rate stories properly rather than skimming twenty, because depth on a handful of currencies beats a shallow view of everything.
FAQ
How do interest rates affect forex on a practical level?
Higher rates pay more for holding a currency, which draws capital toward it and supports the exchange rate. The effect works through bond yields and cross-border flows rather than through the headline decision alone, and it competes with growth, risk appetite and positioning.
Why did the currency fall after a rate rise?
Most likely because the market already expected that rise. Traders reprice against the forecast, so a decision that simply matches the consensus removes uncertainty instead of adding new information.
Which rate should I actually watch?
Watch the two-year government bond yield for each country in the pair. It updates daily and carries the market’s implied path for policy, which the fixed policy rate cannot do between meetings. Compare the two legs against each other rather than watching one in isolation.
Does the size of a rate change matter?
Less than most traders assume. A half-point move that everyone saw coming can pass with barely a ripple, while a quarter-point move nobody had pencilled in causes a scramble. Size the reaction by the distance from consensus, and treat the statement wording as part of the same message.
Do real rates matter more than nominal rates?
For medium-term flows, yes. A high nominal rate paired with higher inflation leaves a negative real return, and investors chase what the money buys later rather than the headline percentage.
How long does a rate story take to play out?
Months, usually, with plenty of counter-moves along the way. Yield gaps and exchange rates diverge for long stretches, so size any position built on the relationship to survive that divergence.
Can I trade a rate decision directly?
You can, though the conditions punish careless execution. Spreads widen, slippage becomes routine and fills land away from the screen price, so reduce size or wait for the first burst to pass. Compare the outcome with the consensus rather than reacting to the number alone, and log every attempt so your own record teaches you what the reaction really looks like. Results are not guaranteed; past performance is not indicative of future results.
External references
- For background on this concept, see Interest Rate on Wikipedia.
- For broader market context, see Open Market Operations at the Federal Reserve.

About the author
Written by Dominic Walsh, a Forex trader and MT4/MT5 indicator, Expert Advisor and script developer. Every tool on forexmt4systems.com is tested on live charts before release and ships with ready-to-use compiled MT4 (.ex4) and MT5 (.ex5) files. Learn more about the trader and developer behind this site.
How we build, test and correct every tool: Editorial & Testing Policy. Trading carries risk; see the disclaimer.