
The interest rate differential in forex is the gap between the two rates attached to the currencies in a pair. Hold that pair overnight and the gap turns into a small credit or a small charge on your account.
That single number sits behind carry trades, swap tables and a good share of medium-term currency flow. This guide covers the arithmetic, the way brokers apply it, and the places where the theory and your statement disagree.
Interest Rate Differential in Forex, Defined
Every currency carries a rate of interest. Deposits in that currency earn it, and loans in that currency pay it.
A forex position holds two currencies at once. You go long one and short the other, so you earn on one leg and pay on the other.
Net those two amounts and you get the differential. Positive means the market credits you, negative means it charges you.
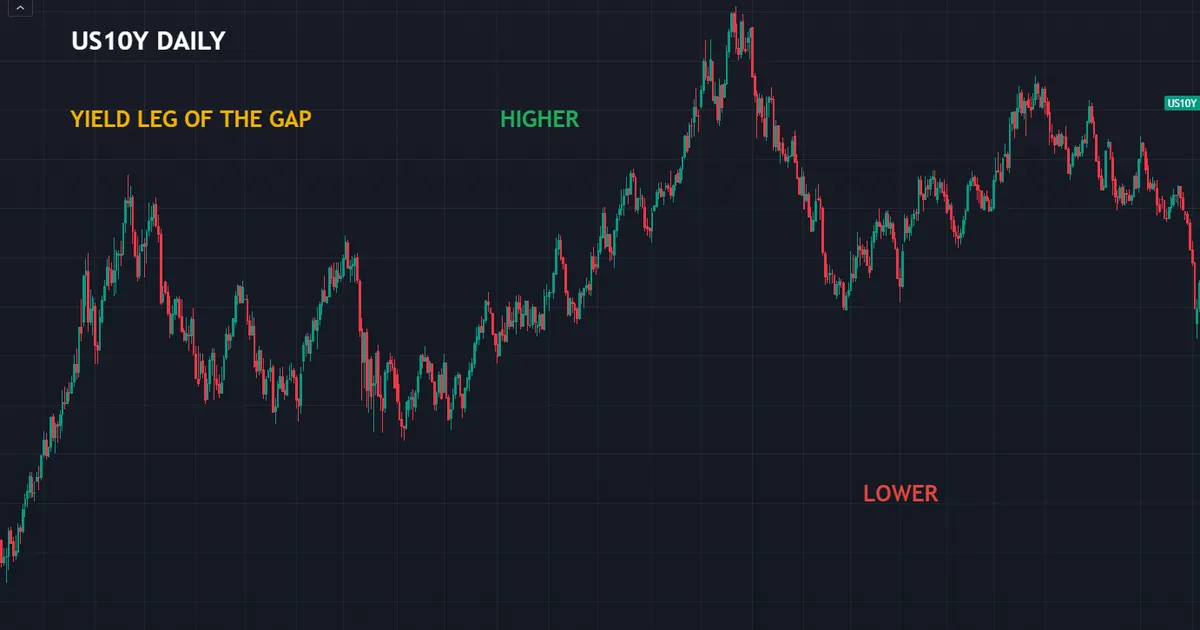
The chart above tracks the United States ten-year yield on daily bars. One leg of many popular differentials moves with that line, so its trend shapes how attractive dollar exposure looks.
The Two Rates You Compare
Take a pair such as the Australian dollar against the yen. Australia has one policy rate and Japan has another.
Buying that pair means holding Australian dollars and borrowing yen. The Australian side pays you, and the yen side costs you.
Subtract the second from the first and the gap appears. Sell the pair instead and the sign flips, so the same gap now works against you.
Which Rate Belongs in the Sum
Textbooks use the headline policy rate. Reality uses short-term money market rates, which sit close to policy but not exactly on it.
Brokers price from the interbank market rather than the central bank announcement. Credit conditions, quarter-end pressure and demand for a currency all nudge those rates around.
So treat the policy gap as an estimate. Our guide to how interest rates affect forex covers where those market rates come from.
The Sign Tells You Who Pays
Sign matters more than size at the start. A positive differential means holding the position accrues a credit each night.
Negative means the opposite, and the charge lands whether the trade wins or loses. Long-term holders feel that drip far more than day traders do.
Check the sign before you plan any multi-week position. Discovering it after three weeks of accruals wastes money for no reason.
Working the Differential Out, Step by Step
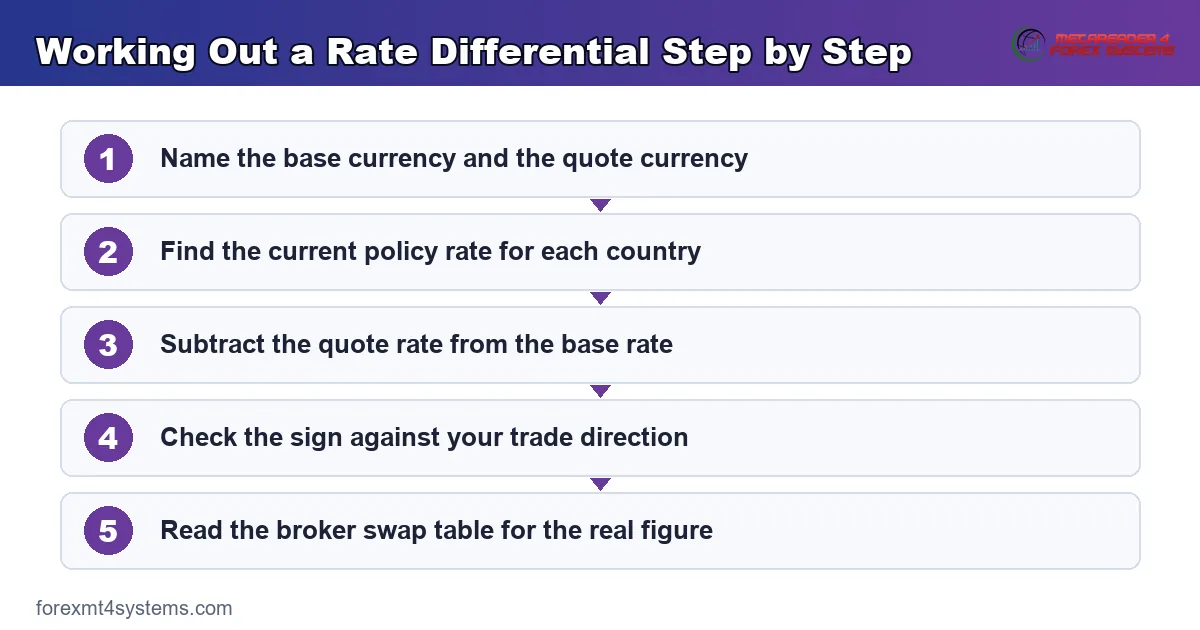
Five steps take you from two published rates to a usable number. Run them in order and nothing gets lost.
- Identify the base and the quote currency. In AUDJPY, the Australian dollar is the base and the yen is the quote.
- Find the policy rate for each country. Central bank websites publish the current level and the date it changed.
- Subtract the quote rate from the base rate. A four per cent base against a half per cent quote gives a gap of three and a half per cent.
- Check the sign against your direction. Long the pair earns that gap, short the pair pays it.
- Read your broker’s swap table for the real number. The published figure includes a markup and rarely matches the theoretical gap.
Step five decides what actually reaches your account. Everything before it explains the mechanism, and only the swap table tells you the price you pay.
Run the sum once per pair, then keep the result in a note. Rates change a few times a year, so the number stays useful for months.
Where the Gap Comes From in the First Place
Rates do not appear at random. Each country sets one for reasons rooted in its own economy.
Central Banks Set the Anchor
A central bank picks a short-term rate to steer inflation and employment. Raise it and borrowing costs climb across the whole economy.
Countries face different pressures at the same moment. One fights rising prices while another worries about weak growth, so their rates drift apart.
Those diverging paths create the gaps traders track. A wide differential usually means the two economies sit at opposite points in their cycles.
Money Markets Fill In the Detail
Banks lend to each other at rates that hover near policy without matching it. Demand for a currency, credit conditions and quarter-end reporting all shift those levels.
Forward prices then build on top of that layer. The forward market embeds the rate gap directly, which is where your broker’s financing ultimately comes from.
So the number moves between meetings. Waiting for a central bank announcement to explain a change in your swap misses most of the story.
Expectations Get There Ahead of Everyone
Short-dated yields shift as traders revise their view of future policy. Those shifts feed into forwards long before any decision arrives.
A differential can therefore narrow while both policy rates sit unchanged. Nothing official happened, yet the cost of holding your position moved anyway.
Track two-year yields alongside policy rates for that reason. The pair of numbers tells you where the gap sits and where it appears to be heading.
How the Differential Reaches Your Account
Theory becomes cash through a process called rollover. Brokers use it to settle the financing on every open position.
Rollover Happens Once a Day
Spot forex settles two business days after the trade date. Holding a position past the daily cut-off means rolling that settlement forward another day.
Brokers do this automatically. They close and reopen the value date, then credit or debit the financing difference to your balance.
Most platforms run the cut-off at five in the afternoon New York time. Our note on swap in forex walks through what appears on the statement.
Triple Charges Cover the Weekend
Markets close for two days, yet financing still accrues. Brokers solve this by applying three days of swap on one weekday.
Wednesday usually carries that triple charge on currency pairs. Settlement conventions put the weekend inside that roll, so the day follows the calendar rather than any broker preference.
Other instruments use a different day entirely. Check your broker’s specification table rather than assuming the currency convention applies everywhere.
Your Broker’s Number Will Not Match the Theory
Swap rates vary by broker, and they change without notice. Two accounts holding the same pair on the same night can accrue noticeably different amounts.
Markup explains most of the gap. Brokers take a slice of the financing on both sides, so the credit shrinks and the charge grows.
On some pairs both directions show a debit. Our swap calculator turns a published rate into a figure per lot per night so the comparison stops being abstract.
Reading the Differential Against a Real Pair
Numbers land better beside a chart. A pair with a long-standing rate gap makes the point quickly.
What the Weekly Chart Shows
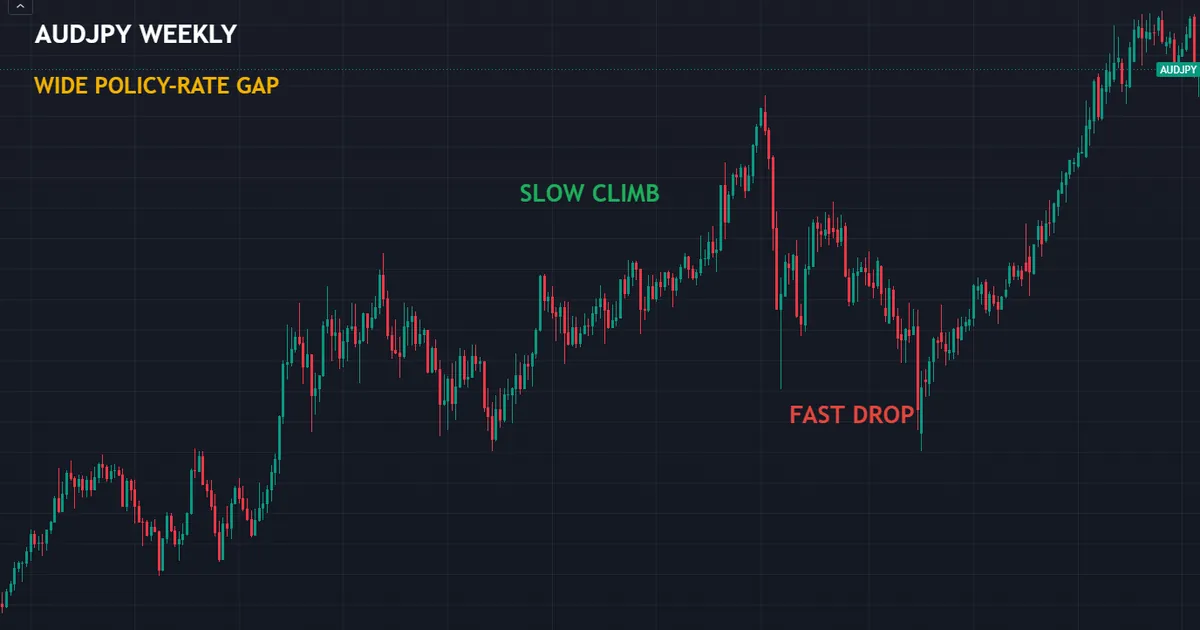
The chart above tracks AUDJPY on weekly bars. Australia and Japan have run very different policy rates for years, which makes this pair a standing example of a wide gap.
Long uptrends appear during calm periods. Sharp declines interrupt them, and those declines take back ground far faster than the advances built it.
That rhythm matters more than any level on the chart. It shows what a positive differential looks like when risk appetite turns.
Why the Chart and the Gap Diverge
A wide gap does not push a pair higher on its own. Growth, commodity prices and global risk appetite all pull on the same exchange rate.
Periods arrive where the gap widens and the pair falls anyway. Nothing broke, because the differential was only ever one input among several.
So use it as a tilt rather than a trigger. A tilt survives contradiction, while a trigger gets abandoned after two bad weeks.
Download the complete indicator database
Put these concepts on your charts. One email unlocks the full library of 1,380+ indicators with compiled MT4 and MT5 files, plus my TradingView scripts. No paywall, no spam, unsubscribe any time.
Get free access to my indicator database
One email unlocks 1,380+ free MT4, MT5 and TradingView indicators — the complete library. No single-tool download; you get the whole database.
What the Differential Does Not Tell You
Plenty of writing treats a wide gap as free money. Three ideas explain why that framing misleads people.
It Carries No Direction
A rate gap says which side collects financing. It says nothing about where the exchange rate travels next.
Currency moves dwarf financing in almost every window that matters. One ordinary day of price movement can erase a month of accrued credit.
Treat the credit as a small tailwind. Building a position around it, and ignoring the price risk, gets the proportions badly wrong.
Theory Says the Gap Should Cancel Out
Interest rate parity argues that a higher-yielding currency should weaken by roughly the size of the gap. The financing you collect would then vanish in the exchange rate.
Decades of testing show that relationship failing more often than holding. Researchers call the anomaly the forward premium puzzle, and explanations still differ.
Either way, the honest reading stays modest. Nobody should treat a wide gap as a dependable source of return.
Scale Beats Sign Every Time
Suppose a pair pays roughly three per cent a year. That works out near a hundredth of a per cent a day on your notional.
Now compare it with a typical daily range of half a per cent or more. The price risk runs many times larger than the daily accrual.
Position sizing therefore matters far more than the swap number. Our note on forex trading costs puts financing beside spread and commission.
Comparing Brokers on Financing
Two accounts can hold identical positions and accrue very different amounts. A short comparison protects long-term holders.
Read the Contract Specification
Every broker publishes a table of long and short swap values per lot. Find it before opening an account rather than after your first monthly statement.
Units differ between platforms. Some quote points, some quote the account currency, and mixing the two produces nonsense.
Convert everything to one measure before comparing. A figure per lot per night makes rival tables directly comparable.
Check the Pairs You Actually Trade
Competitive financing on the majors tells you little about the crosses. Brokers price each instrument separately, and the exotic pairs often carry the widest markup.
List your five most-held instruments and compare only those. A headline claim about tight financing rarely covers the whole board.
Repeat the check twice a year. Tables drift, and the account that looked best in January may not lead in July.
Weigh Financing Against Spread
Cheap financing sometimes accompanies a wider spread. Day traders pay the spread constantly, while position traders pay the financing instead.
Match the account to your holding period. Someone holding for months should weight financing heavily, and someone holding for minutes should almost ignore it.
Run the total cost over a realistic month. That single figure settles the argument faster than any feature list.
Turning the Gap Into a Figure Per Lot
Percentages stay abstract until you convert them. A short calculation makes the scale obvious.
Start With the Notional Amount
One standard lot equals one hundred thousand units of the base currency. Ten mini lots come to the same total, so the arithmetic works either way.
Financing applies to that full notional, not to your margin. A trader with a small deposit still accrues on the whole position.
Leverage therefore multiplies the financing alongside the price risk. Both grow together, which people often forget when they raise size.
Spread the Annual Rate Across the Year
Divide the annual gap by three hundred and sixty-five. A three and a half per cent differential comes to roughly a hundredth of a per cent per night.
Apply that to one hundred thousand units and the daily amount lands near ten units of the base currency. Modest, steady and easy to overlook.
Multiply by a realistic holding period next. Sixty nights turns that trickle into six hundred units, which starts to matter.
Compare It With the Daily Range
Now measure what the pair typically moves in a session. Half a per cent of the same notional comes to five hundred units.
One ordinary day therefore swamps fifty nights of accrual. That ratio, not the sign of the swap, should shape how you size the trade.
Run the comparison before every long hold. Seeing both numbers side by side keeps the financing in proportion.
Where Traders Go Wrong With the Differential
Six habits cause most of the trouble. Each has a straightforward fix.
Using Policy Rates Instead of the Swap Table
The theoretical gap and the credited amount often differ by half or more. Read the broker specification for the pair, then plan around the figure that will actually appear.
Assuming the Number Stays Put
Brokers revise swap rates whenever funding conditions shift, and they rarely announce it. Check the table monthly if you hold positions for weeks at a time.
Holding a Negative Carry Position Indefinitely
A small nightly charge compounds into real money across a quarter. Set a review date for any long-hold position that pays rather than collects.
Chasing the Widest Gap Available
The largest differentials belong to currencies with the highest risk attached. Higher volatility, wider spreads and political surprises come as part of the same package.
Forgetting the Triple Charge
A position opened on Tuesday night collects three days of financing on Wednesday. Note which weekday your instrument uses, because the amount surprises traders who expect a single charge.
Ignoring the Sign on the Short Side
Selling a high-yield pair turns a credit into a charge automatically. Check both directions before committing, since the cost of a short can double the cost of the equivalent long.
Interest Rate Differential Quick Reference
Keep this table beside your platform. Each row states a check rather than a forecast.
| Item | What to check | Why it matters |
|---|---|---|
| Base rate | Current policy rate for the base currency | The leg that pays you on a long position |
| Quote rate | Current policy rate for the quote currency | The leg you effectively borrow |
| Theoretical gap | Base rate minus quote rate | Gives the sign and a rough scale |
| Broker swap | Published long and short values per lot | The number that reaches your account |
| Markup | Difference between theory and the swap table | Shrinks credits and widens charges |
| Triple day | The weekday carrying three days of financing | Explains a charge three times the usual size |
| Holding period | Nights you expect to stay in the trade | Turns a nightly figure into a total |
| Daily range | Typical movement over the same period | Shows how small the accrual really is |
Notice that no row promises a return. The differential describes a cash flow attached to a position, and the position itself carries the risk.
What Goes Wrong in Practice
Live accounts throw up problems no formula predicts. Four of them account for most complaints.
The Credit Turned Into a Charge
Brokers adjust swap tables as funding costs move. A pair that paid a small credit last quarter can charge you this quarter without any central bank changing anything.
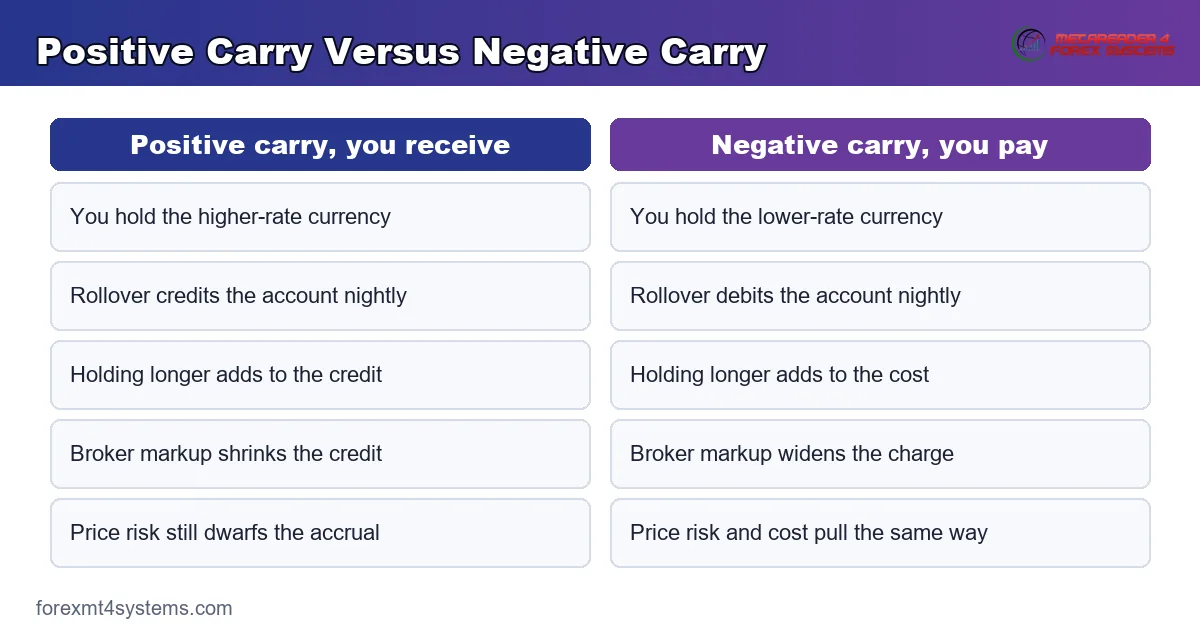
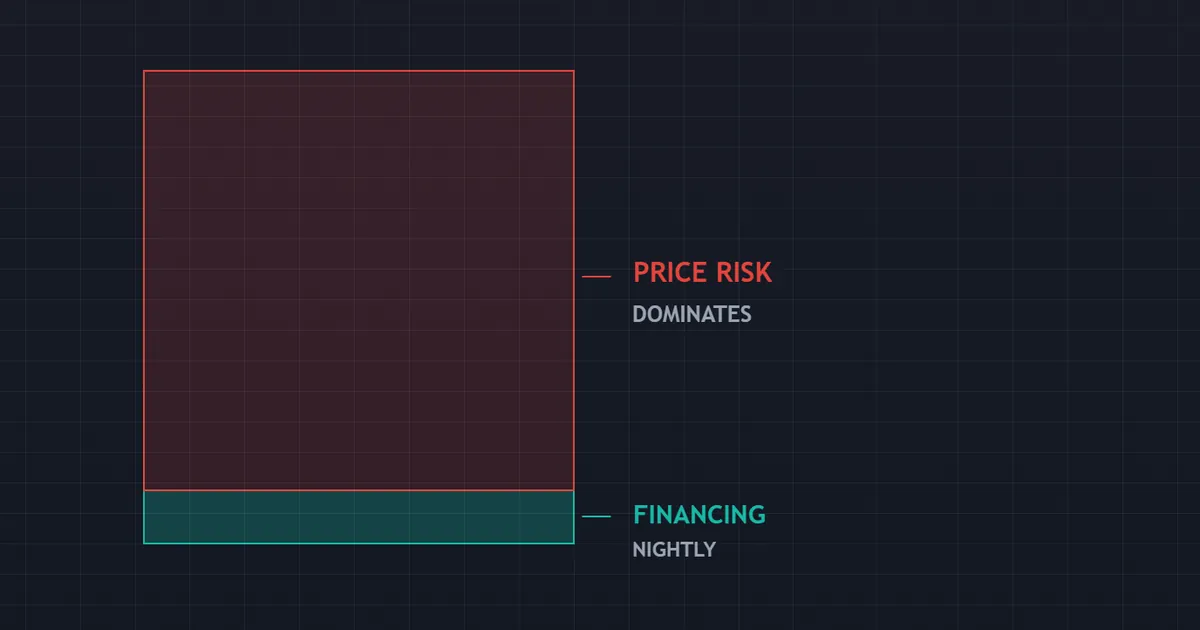
The panel above breaks a carry position into its two parts. Financing sits on one side and price movement on the other, and the second part dominates.
Both Sides Showed a Debit
Markup can push both directions negative on the same pair. Long pays and short pays, which surprises anyone expecting the two to mirror each other.
Nothing has gone wrong with your account. It simply means the broker’s slice exceeds the underlying gap, so no direction collects.
The Accrual Vanished in One Session
Three months of credit disappears in a single volatile day. Financing accrues slowly, while exchange rates move in jumps.
Plan for that asymmetry from the start. Our guide to the carry trade unwind covers the sharpest version of the problem.
A Swap-Free Account Charged Something Else
Accounts offered without overnight financing usually replace it with an administration fee. That fee can exceed the swap it replaced on long holds.
Read the fee schedule rather than the marketing page. Compare the total holding cost across a realistic period before switching account types.
Related Ideas Worth Studying Next
Collecting the gap deliberately has its own name and its own literature. Our explainer on the carry trade meaning covers the strategy built around a positive differential.
Rate expectations shift ahead of every meeting, which moves the gap before any decision lands. Our economic calendar lists those meetings so nothing arrives unannounced.
Comparing many currencies at once helps too. The currency strength indicators archive ranks currencies against each other rather than one pair at a time.
One habit outranks the rest. Record the swap you actually receive for a month, because your own statement teaches you more than any published table.
FAQ
What is the interest rate differential in forex?
It is the gap between the interest rates of the two currencies in a pair. Holding the pair overnight turns that gap into a small credit or charge, applied through the daily rollover process.
How do I calculate it?
Subtract the quote currency’s rate from the base currency’s rate. A long position earns the result and a short position pays it, though your broker’s swap table gives the number that will actually reach your account.
Why does my swap differ from the published rate gap?
Brokers add a markup to both sides of the financing. That slice shrinks any credit and enlarges any charge, and on some pairs it turns both directions into a debit.
Do swap rates change?
Yes, and often without notice. They shift with funding conditions, quarter-end pressure and broker policy, so check the specification table regularly if you hold positions for weeks.
Which day carries the triple charge?
Wednesday, for most currency pairs, because settlement conventions place the weekend inside that roll. Other instruments use a different weekday, so confirm the detail in your broker’s contract specification.
Can I trade purely on the differential?
Traders do try, and the approach carries far more price risk than financing reward. A wide gap accrues a fraction of a per cent a day, while an ordinary session can move the pair many times that amount in either direction. Treat the gap as a small tilt inside a plan that manages position size properly, and log every accrual so you can see the true proportions. Results are not guaranteed; past performance is not indicative of future results.
External references
- For background on this concept, see Interest Rate Differential at BabyPips Forexpedia.
- For broader market context, see Interest Rate Parity at Corporate Finance Institute.
- The overnight money-market rate that funding is actually priced from, rather than the policy announcement, is published as SONIA interest rate benchmark at the Bank of England.

About the author
Written by Dominic Walsh, a Forex trader and MT4/MT5 indicator, Expert Advisor and script developer. Every tool on forexmt4systems.com is tested on live charts before release and ships with ready-to-use compiled MT4 (.ex4) and MT5 (.ex5) files. Learn more about the trader and developer behind this site.
How we build, test and correct every tool: Editorial & Testing Policy. Trading carries risk; see the disclaimer.