
Most explanations of how inflation affects forex stop at one line: higher inflation lifts the currency. That line fails more often than it works, and traders lose money believing it.
Inflation reaches an exchange rate through a chain, not a switch. Each link can hold or snap, so the same print can send a currency either way.
How Inflation Affects Forex: The Short Version
Rising prices do not buy or sell currency. Traders do that, and they trade one thing above all: the interest rate they expect next.
So inflation matters because a central bank reacts to it. Remove the reaction and the link to the exchange rate breaks entirely.
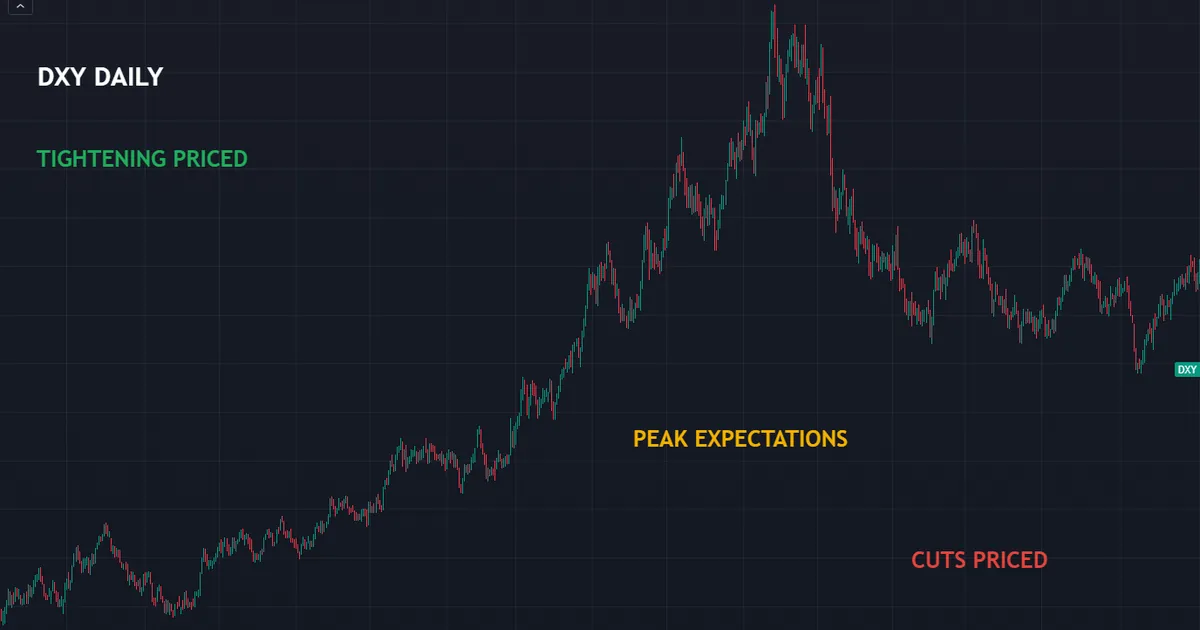
Above sits the US Dollar Index on a daily scale, spanning a full inflation cycle. Read the shape rather than the numbers.
A long climb builds while the market prices a tighter policy path. The advance flattens as those expectations top out, then drifts lower once traders start pricing cuts.
The Chain in One Line
Say it out loud until it sticks. Data surprise, then rate expectations, then currency.
Every fundamental article on this site returns to that order. Skip a link and the reasoning collapses.
Why the Order Matters
Traders often jump from step one to step three. Hot print, buy the currency, done.
That shortcut works only when the middle link cooperates. When rate expectations refuse to move, the currency does not move either.
Which Prints Feed the Chain
Several releases carry inflation information. Traders watch the whole set, not just the famous one.
- Consumer price index. The headline monthly gauge, split into a full basket reading and a core reading.
- Producer prices. Costs at the factory gate, which often reach consumers a few months later.
- Wage growth. The closest thing to a leading indicator for services inflation.
- Inflation expectation surveys. What households and firms think prices will do over the coming year.
- Breakeven rates. The gap between ordinary and inflation-linked bond yields, priced live by the market.
Breakevens deserve special attention. They update every second, so they show the market changing its mind long before any survey does.
Why Inflation Itself Moves Nothing
An index sitting at four per cent has no buying power. It cannot place an order.
Prices Crawl, Currencies Sprint
Consumer prices change monthly and get published weeks late. Exchange rates change every second of every trading day.
Those two clocks never sync. By the time a price index confirms a trend, the currency market has traded that trend for months.
The Market Trades the Response
Think of inflation as evidence in a case. The central bank acts as the judge, and the ruling moves money.
A judge who ignores strong evidence produces no verdict. Traders watch the judge, not the evidence.
Our guide to how interest rates affect forex covers the ruling itself in detail.
The Chain, Step by Step
Five links carry a price print into an exchange rate. Trace them in order every time.
- Prices rise faster than expected. A monthly print lands above consensus, and the surprise carries the information rather than the level.
- Rate expectations shift. Traders raise the number of hikes they expect, or push the first cut further out.
- Short-dated yields reprice. Two-year government bond yields track the expected policy path more closely than any other market.
- Capital chases the return. Money flows toward the currency offering the better expected real return.
- The exchange rate adjusts. The move sticks only while the new expected path stands.
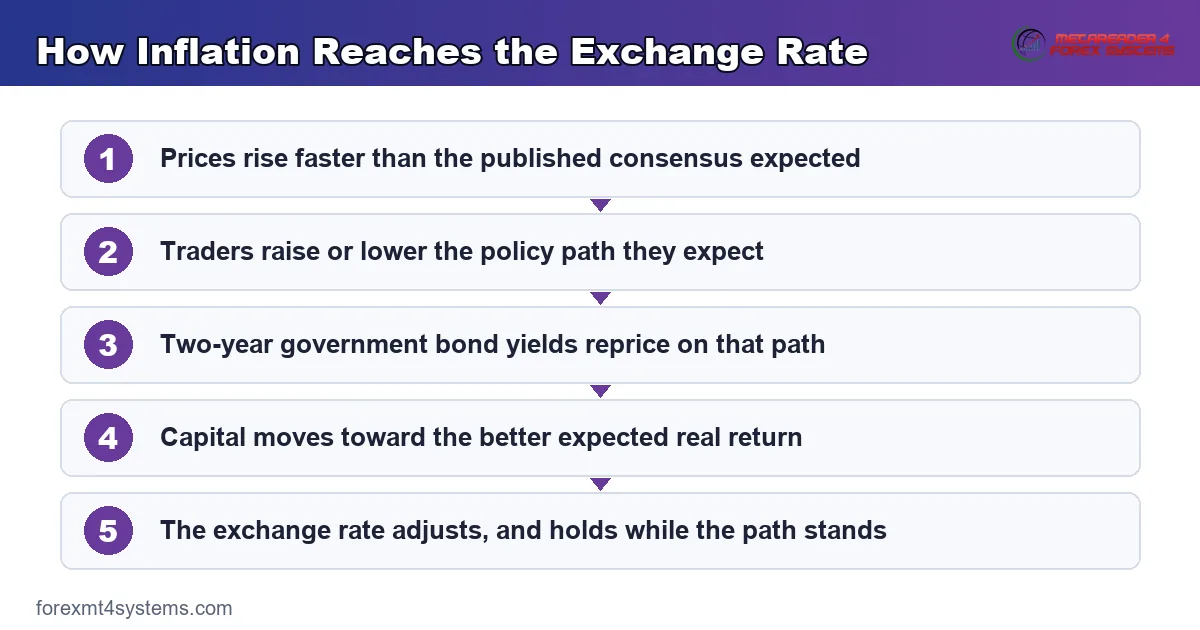
Break any single link and the chain stops. Most confusing currency reactions trace back to one broken link, usually the second.
Real Rates: The Number That Actually Matters
Nominal rates make headlines. Real rates move capital.
Nominal Minus Inflation
A real rate takes the nominal interest rate and subtracts inflation. It answers a simple question: does this money grow in buying power, or shrink?
Six per cent interest with eight per cent inflation loses value every year. Two per cent interest with zero inflation gains it.
Global capital chases the second one. So a country with high nominal rates and higher inflation attracts far less flow than the headline suggests.
Why a Rate Rise Can Weaken a Currency
Here lies the trap that catches most beginners. A central bank hikes, the currency falls, and nothing seems to make sense.
Check the real rate first. If inflation climbed faster than the hike, the real return just got worse despite the higher headline number.
Check expectations second. Markets may have priced a larger hike, which turns a genuine increase into a dovish surprise.
A Worked Comparison
Two currencies, two very different stories. The table strips them down to the number that counts.
| Measure | Country A | Country B |
|---|---|---|
| Policy rate | Nine per cent | Three per cent |
| Inflation | Eleven per cent | One per cent |
| Real rate | Minus two per cent | Plus two per cent |
| Headline appeal | Very high yield | Modest yield |
| Where capital drifts | Away, over time | Toward, over time |
Country A wins every headline comparison. Country B keeps the buying power, and that decides the flow.
Where to Watch Real Rates
Inflation-linked government bonds carry the cleanest read. Their yields quote a real return directly, with no arithmetic needed.
Two-year yields work as a rougher proxy. Compare two countries and the gap tells you which currency holds the funding advantage.
Our note on the interest rate differential in forex walks through that comparison step by step.
The Stagflation Counter-Case
Now for the part most articles skip. High inflation can crush a currency, and history offers plenty of examples.
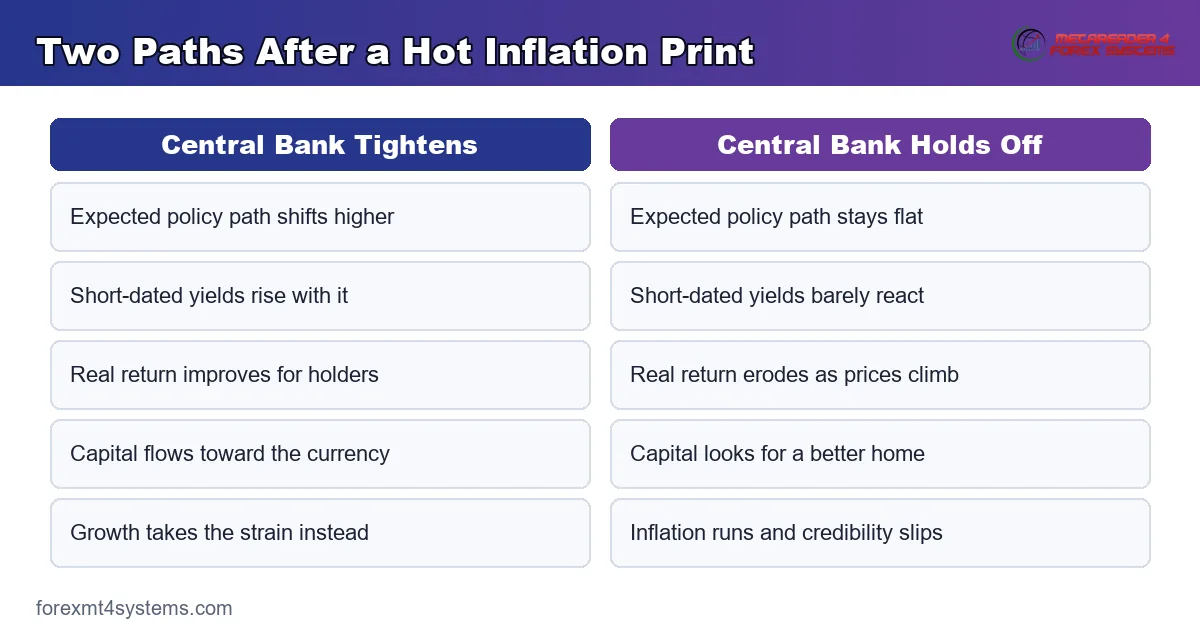
When the Bank Cannot Tighten
Picture inflation at nine per cent with the economy already shrinking. Unemployment climbs, and banks look fragile.
Raising rates into that mix deepens the slump. So the central bank waits, talks about temporary factors, and lets inflation run.
Traders read that hesitation instantly. Real returns fall, capital leaves, and the currency drops even as inflation soars.
Credibility Does the Heavy Lifting
A bank with a long record of hitting its target enjoys the benefit of the doubt. Markets assume it will act, so expectations rise on the data alone.
A bank with a patchy record gets no such credit. Traders demand proof, and the currency slides while they wait for it.
Credibility explains why identical inflation prints produce opposite reactions in different countries.
The Emerging-Market Version
The pattern intensifies outside the major economies. High inflation there often signals a fiscal problem rather than a demand problem.
Investors then price the risk of capital controls, default or a currency peg breaking. No interest rate compensates for that combination.
So the textbook link inverts completely. Higher inflation means a weaker currency, and higher rates confirm the trouble rather than fixing it.
Reading the Trap Early
Three signals usually appear together. Inflation above target, growth slowing, and officials talking about balance rather than price stability.
Add a fourth once it shows up. Long-dated yields rising while short-dated yields stall suggests the market doubts this bank will act.
What a Full Cycle Looks Like
Inflation cycles follow a rough shape. Recognising the stage helps far more than predicting the next print.
Stage One: Denial
Prices start climbing and officials call the move temporary. Markets half believe them, so the currency drifts without conviction.
Two-year yields creep higher during this phase. That quiet move tends to lead the currency by weeks.
Stage Two: Repricing
Officials change their language, and expectations jump. This stage produces the strongest currency trends of the whole cycle.
Note what drives it. Not the inflation level, but the speed at which the expected policy path shifts.
Stage Three: Peak Expectations
Eventually the market prices the full tightening cycle. From there, further hot prints add nothing, because the path already holds them.
Currencies often top out here while inflation still runs high. Traders who bought the story late get caught at exactly this point.
Stage Four: The Turn
Growth slows, and traders start pricing cuts. The currency weakens even though inflation may still sit above target.
Each stage rewards a different approach. Knowing which one you occupy beats forecasting the next number.
Priced In: Why the Chain Often Fails Anyway
Even when every link holds, timing ruins the trade. The market moves before the print arrives.
What Priced In Means
Forecasters publish a consensus days ahead. Traders position against it, so the expected outcome already sits inside the exchange rate.
A print matching consensus therefore delivers nothing new. Price wobbles for a minute and settles back.
Only the surprise carries fresh information. Read that sentence twice, because it explains most release-day disappointment.
Where the Consensus Comes From
Banks and research houses submit forecasts, and a data provider averages them. The result appears in every calendar as the forecast column.
Treat it as a rough centre, not a precise number. A whisper number sometimes circulates on the day and differs from the published average.
That gap explains some baffling reactions. Price responded to an expectation you never saw.
The Leading Data Arrives Earlier
Wage growth, producer prices and business surveys all hint at the direction weeks ahead. Bond markets act on those hints immediately.
By release day, much of the repricing has already happened. The calendar entry confirms a story the market started telling in advance.
How to Spot a Genuine Repricing
Watch the yield curve alongside the currency. A move backed by a real shift in two-year yields tends to last.
A currency move with flat yields behind it usually fades. Position squaring caused it, and position squaring reverses.
A Worked Example on the Charts
Numbers beat theory here, so look at a real reaction. The chart below shows a four-hour bar on the US Dollar Index from 5 June 2026.
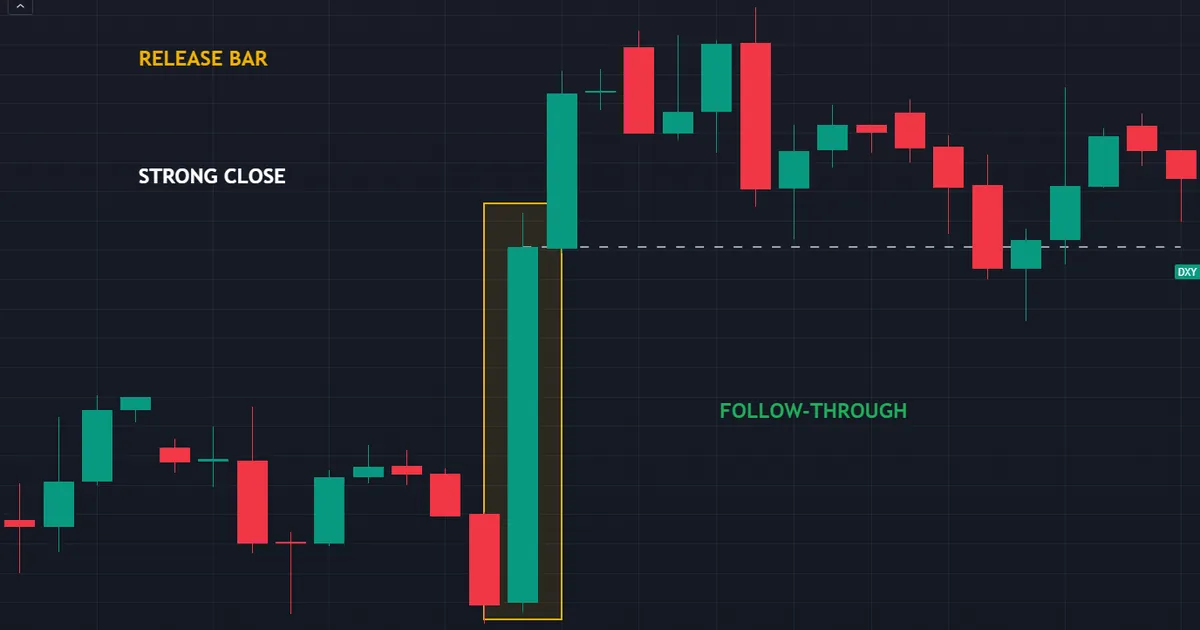
That bar expanded to roughly 5.45 times the recent average range. Its body filled 89 per cent of the span, so one side held control into the close.
We deliberately leave the release unnamed. A wide bar never proves which headline caused it, and honest analysis admits that.
What Made This One Different
Follow-through separates a real repricing from a liquidity spike. Here the following bars added about 2.77 average ranges in the same direction.
That continuation suggests genuine repricing rather than a squeeze. Someone kept buying long after the initial flurry ended.
Measuring Follow-Through Yourself
You need two numbers and nothing else. Take the average range over the last fourteen bars, then measure the release bar against it.
Next, measure how far price travels over the following few bars. Divide that distance by the same average range.
Watch the sign as well as the size. A ratio near zero marks a spike that led nowhere, while one pointing against the bar’s own direction marks a move handed straight back.
The Contrast Worth Remembering
Plenty of release bars do the opposite. They spike, close well, then hand the move back over the following hours.
So treat continuation as the evidence, not the first candle. Our guide to what CPI means in forex shows the fading version of exactly this pattern.
Download the complete indicator database
Put these concepts on your charts. One email unlocks the full library of 1,380+ indicators with compiled MT4 and MT5 files, plus my TradingView scripts. No paywall, no spam, unsubscribe any time.
Get free access to my indicator database
One email unlocks 1,380+ free MT4, MT5 and TradingView indicators — the complete library. No single-tool download; you get the whole database.
Common Mistakes and the Fixes
Six habits turn a sound theory into a losing month. Each one has a cheap fix.
Buying a Hot Print Automatically
Inflation alone tells you nothing about direction. Check whether the print raises the expected policy path before you act.
Ignoring the Real Rate
Nominal yields flatter a currency with runaway prices. Subtract inflation, then compare the two countries again.
Forgetting the Other Currency
Every quote holds two economies. A soft print in one currency can lift a pair just as easily as a hot print in the other.
Treating One Month as a Trend
Rate setters weigh a run of readings. Track three prints in a row before you call any turn.
Overlooking Credibility
The same data lands differently in different countries. Ask whether this bank has acted on inflation before, and how quickly.
Skipping the Cost of Carry
Holding a position through a rate cycle earns or pays a nightly swap. Our note on swap in forex covers how that adds up over weeks.
Quick Reference Checklist
Work down this list before you form any inflation view. Five minutes, no charts needed.
| Question | Where to look | What it tells you |
|---|---|---|
| Did the print beat consensus? | Economic calendar forecast column | Only the surprise carries new information |
| Did core move, or just headline? | Both lines of the same release | Core drives policy, headline drives headlines |
| Did two-year yields move? | Government bond quotes for that country | Confirms a genuine shift in the expected path |
| What is the real rate now? | Policy rate minus current inflation | Decides whether capital wants the currency |
| Can this bank actually tighten? | Growth, jobs and banking-sector health | A trapped bank breaks the chain completely |
| How close is the next meeting? | Central bank calendar | Prints near a decision carry extra weight |
Any single no answer weakens the case. Two of them usually kill it.
Where the Chain Breaks
The panel below lays the whole sequence out with its weak points marked. Study the breaks rather than the arrows.
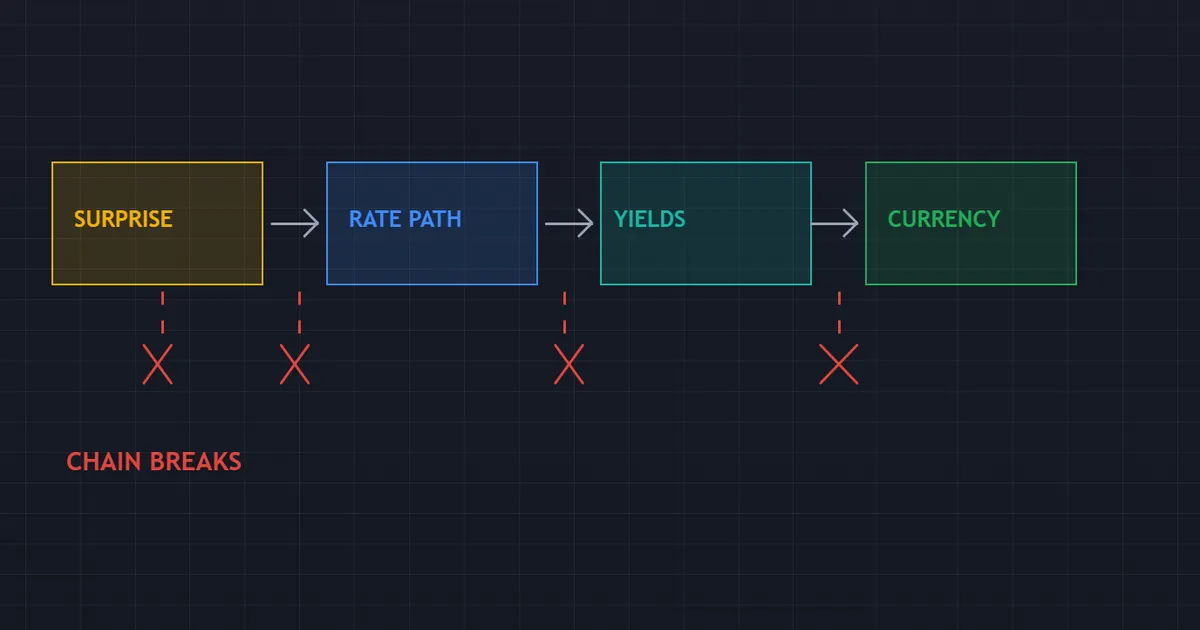
Break One: The Data Says Nothing New
A print landing exactly on consensus adds no information. Expect noise, then a return to the prior level.
Break Two: Expectations Refuse to Move
Officials may have already promised to look through a temporary spike. Traders believe them, so the expected path holds flat.
Watch the two-year yield to confirm. A flat yield after a hot print tells you this link failed.
Break Three: Risk Sentiment Overrides Everything
During a market shock, capital runs to safety and ignores yield entirely. Funding currencies rally hardest at exactly the moment their rates look worst.
Our explainer on carry trade meaning covers why those unwinds move so violently.
Break Four: The Other Side Moved Too
Both economies publish data. Simultaneous prints can cancel out, leaving a pair flat despite a large surprise on one side.
A strength meter helps you see which currency actually moved. Our currency strength meter separates the two legs of any pair.
Long Run Versus Short Run
Economists have long argued that inflation gaps eventually show up in exchange rates. Over decades, that relationship holds reasonably well.
The Textbook Version
Purchasing power parity says a currency with persistently higher inflation must weaken. Otherwise its goods become impossibly expensive abroad.
Long price series broadly support the idea. Very long ones, measured in decades rather than quarters.
Why It Fails Your Trade
No trading account survives a decade-long convergence. Capital flows, rate differentials and risk appetite all swamp the effect year to year.
So treat parity as background, never as a signal. It explains the destination and says nothing useful about the route.
Where Parity Still Helps
One use survives. A currency far from its long-run fair value carries more risk of a sharp correction, whichever way it has stretched.
Treat that as a warning light on position size. It never tells you the timing, and a stretch can widen for years.
What to Use Instead
Trade the expected policy path, and let the long-run story stay in the textbook. Rate expectations move fast enough to matter inside a trading horizon.
Traders wanting to see relative strength on a chart can browse our currency strength indicators archive.
Turning This Into a Routine
A framework only earns its keep as a habit. Three steps take about twenty minutes a week.
Track Two Yields, Not Ten Headlines
Pick the two-year government yield for each currency you follow. Note it once a week and watch the gap between countries.
That single number captures more than any commentary. It reflects what the market expects, priced in real money.
Write the Expectation Before the Print
Note the consensus, then add what you think the market has already assumed. Compare both with the reaction afterwards.
Most learning happens in that comparison. Memory alone rewrites the story within days.
Review Across a Quarter
Judge the framework over months, never over one release. A chain that broke twice in a row may simply have met an unusual stretch.
Twenty releases give you something worth reading. Two give you an anecdote.
Related Guides Worth Reading
Inflation forms one input among several. Two neighbours complete the picture.
Start with the release itself. Our explainer covers how the index gets built and why core outranks headline for policy purposes. Then keep a live schedule open, because our economic calendar lists every inflation print with its forecast and prior reading.
After that, read one full cycle of central bank statements. Nothing teaches the chain faster than watching officials describe it in their own words.
FAQ
Does high inflation strengthen or weaken a currency?
Either, depending on the policy response. When traders expect the central bank to raise rates and follow through, higher inflation can lift the currency. When the bank cannot tighten, or when inflation outruns the rate rises, real returns fall and the currency usually weakens. The response decides the direction, never the inflation number by itself.
What is a real interest rate?
A real rate takes the nominal interest rate and subtracts inflation. It measures whether money parked in that currency grows in buying power. Global capital chases real returns rather than headline yields, which explains why a country with double-digit rates and higher inflation still watches its currency fall.
Why did the currency fall after a hot inflation print?
Usually because the market expected something even hotter. Traders price a policy path days in advance, so a print below that expectation reads as dovish regardless of how high it looks. Position squaring ahead of the release adds another layer, and thin liquidity exaggerates both effects for an hour or so.
Which inflation number should I watch?
Core, in most cases. Core strips out food and energy, the components that swing for reasons monetary policy cannot influence. Rate setters anchor their judgement on core, so it predicts the policy path better. Watch headline too, since it shapes public expectations and occasionally becomes the story on its own.
How quickly does inflation show up in exchange rates?
Rate expectations reprice within seconds, and the currency follows the same day. The deeper adjustment takes much longer, since funds rebalancing portfolios work over weeks. Purchasing power effects run over decades, which puts them far outside any trading horizon.
Can I trade inflation data profitably?
Some traders build a process around it, though the honest answer includes several warnings. Spreads widen, slippage lands on entries and exits, and the first move reverses more often than it extends. Reading the whole chain beats guessing the direction, and waiting for confirmation in yields beats chasing the opening spike. Judge any approach across dozens of releases rather than a handful. Results are not guaranteed; past performance is not indicative of future results.
External references
- For background on this concept, see Inflation on Wikipedia.
- For broader market context, see Inflation at Investopedia.
- The mechanism described above, where a central bank moves rates in response to inflation, is explained in Inflation and interest rates at the Bank of England.

About the author
Written by Dominic Walsh, a Forex trader and MT4/MT5 indicator, Expert Advisor and script developer. Every tool on forexmt4systems.com is tested on live charts before release and ships with ready-to-use compiled MT4 (.ex4) and MT5 (.ex5) files. Learn more about the trader and developer behind this site.
How we build, test and correct every tool: Editorial & Testing Policy. Trading carries risk; see the disclaimer.