
Ask experienced traders what quietly ruins accounts, and one answer keeps coming back. So the honest question comes first: what is overtrading, and how would you spot it in your own record?
Overtrading means placing more trades, or larger trades, than your plan and your edge support. It rarely looks dramatic. Instead it grinds an account down through costs, thin attention and rushed decisions.
What Is Overtrading, Exactly
Overtrading describes activity that outruns the plan behind it. The trade count rises, the size creeps up, and the reasoning thins out.
No single number defines the line. Because every method has its own natural rhythm, the honest test compares your activity against your own written rules.
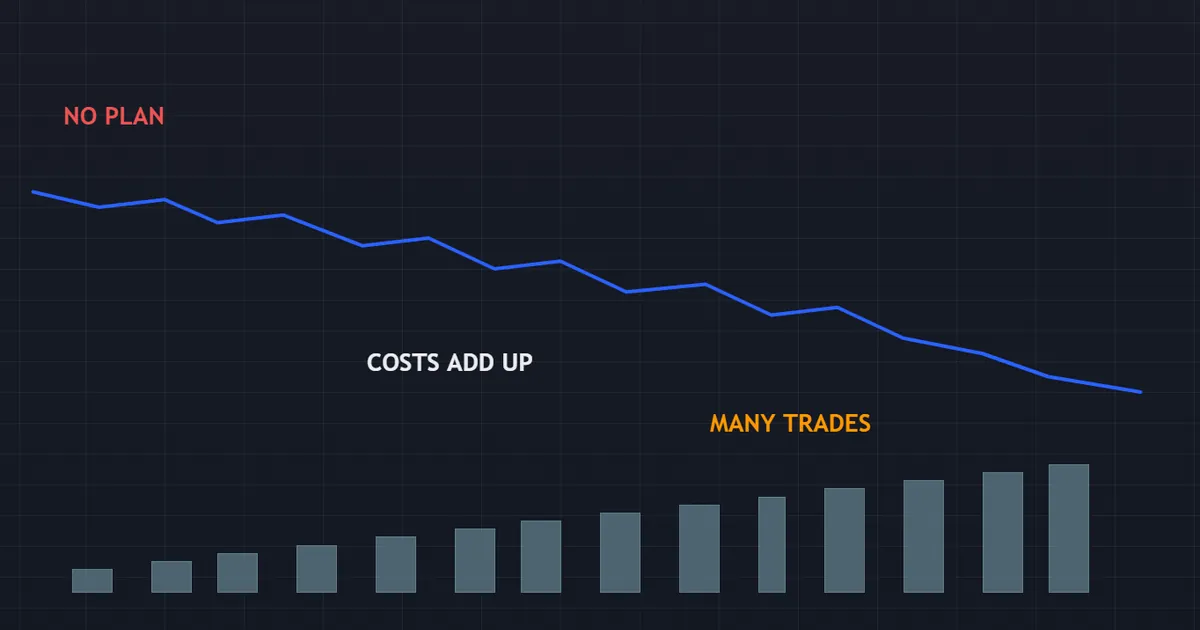
The panel above shows the classic shape. An equity curve grinds lower in small steps while the trade count climbs, and costs do most of the damage.
Notice what the picture lacks. No single disaster appears, since this habit kills by attrition rather than by one blow.
That slow shape explains why so few traders catch it early. A blown account demands attention, while a drifting one invites another week of the same.
Frequency Versus Size
Two versions of the same problem exist. One trader takes far too many positions, while another takes very few at reckless size.
Both break the same link between plan and action. So treat frequency and size as two dials on one machine, and check both when you review a week.
Why Your Plan Defines the Line
A scalper might take thirty trades in a day and stay well inside the plan. A swing trader who takes five in a day has clearly lost the thread.
Because the benchmark sits in your own rules, borrowed limits mislead you. Write down the trade count you expect in a normal week, then measure against that figure.
What Overtrading Does Not Mean
A busy week alone proves nothing. Volatility rises, setups cluster, and a sound system fires more often than usual.
The difference sits in the reason behind each click. If every trade matches a written setup, the count stays honest. If half of them came from restlessness, the count has drifted.
The Signs in a Trading Record
Your statement usually tells the story before you notice it yourself. Look for clusters of entries placed within a few minutes of each other.
Then check the gap between gross profit and net profit. Because a wide gap points straight at cost drag, that single comparison often settles the argument.
Why Traders Overtrade
This habit has roots in documented behaviour rather than in laziness. Behavioural finance names most of the forces at work.
Naming them helps, because a labelled impulse loses some of its grip. Below sit the mechanisms that show up most often in trading records.
The Biases Behind the Habit
Walk through the list, and mark the ones you recognise.
- Gambler’s fallacy. After a run of losses, the next trade feels overdue for a winner. Independent outcomes simply do not work that way.
- Sunk-cost thinking. Money already lost pulls a trader into further trades to justify the earlier ones.
- Illusion of control. More clicks feel like more influence over an outcome the market alone decides.
- Action bias. Doing something feels better than waiting, even when waiting scores far better.
- Recency bias. The last two candles feel more important than the last two hundred.
- Overconfidence. A good week reads as skill, so the following week gets more trades.
Notice how none of these describe a lazy trader. Because each one feels rational in the moment, willpower alone rarely stops the drift.
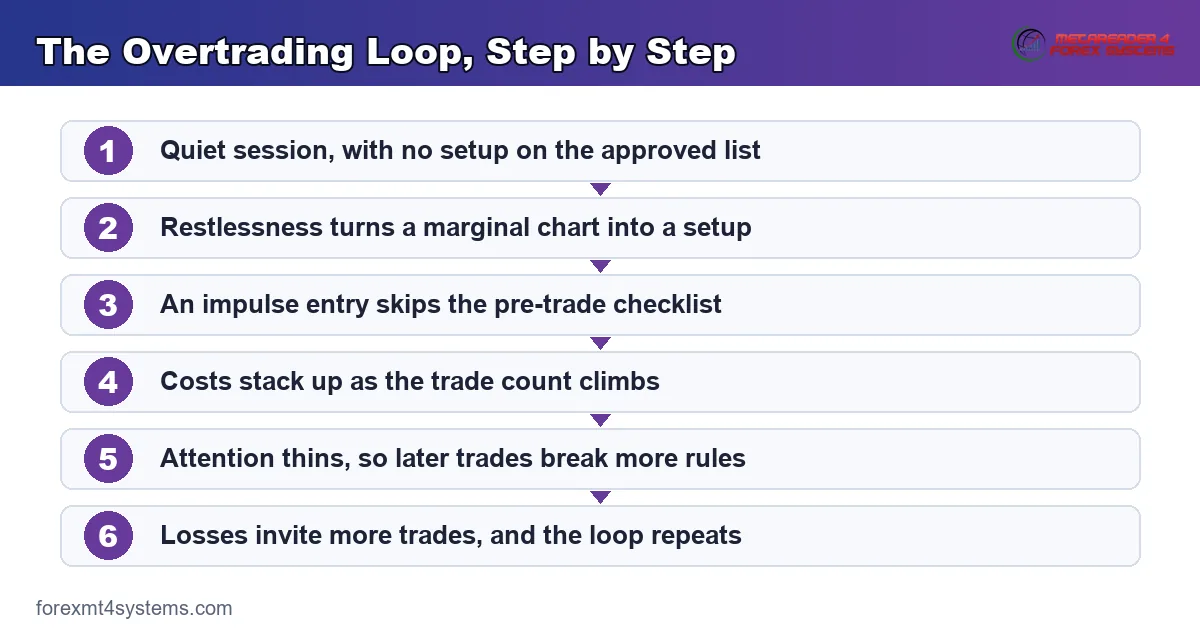
The flow graphic gathers the loop into a single view. Pin it near the screen, and the pattern becomes easier to catch in real time.
Boredom Does Real Damage
Long quiet sessions test patience far more than volatile ones. Nothing sets up, the screen stays open, and the mind starts hunting.
So a marginal chart slowly starts to look like a setup. Because boredom feels harmless, few traders log it, yet it drives a large share of unplanned entries.
The Platform Rewards Motion
Charts update every second, and every tick invites a decision. That design suits the venue more than the trader.
Volume earns spread and commission, so nothing in the interface nudges you to stop. In regulated markets, a broker who churns a client account for fees faces sanctions. A self-directed trader can churn their own account all day without anyone objecting.
Losses Speed the Cycle Up
A red day raises the urge to trade rather than lowering it. The account wants repair, and the mind wants relief.
So the count rises exactly when judgement drops. Because that pairing does most of the harm, a written loss limit protects you far better than a promise made in the moment.
How Overtrading Drains an Account
The damage arrives through three channels. None of them feels dramatic on any single trade.
Together they explain why an account with a genuine edge still bleeds. Costs scale with activity, while edge does not.
Costs Scale With the Trade Count
Every entry pays the spread, and many pay a commission too. Ten trades a day cost ten times what one trade a day costs.
So a slim edge can vanish inside the cost line. Our guide to forex trading costs breaks the components apart so you can price your own activity.
Swap, Slippage and Partial Fills
Spread and commission only start the list. Overnight swap, slippage on entry and the odd partial fill all take a slice.
These items hide well, since no statement labels them as a single line. Because heavy activity multiplies each one, the gap between your journal and your balance widens month after month.
Attention Runs Out
Concentration behaves like a fuel tank rather than a switch. The fortieth decision of a session rarely matches the quality of the first.
So late trades tend to break rules that early trades respected. Stops move, sizes creep, and the checklist gets skipped entirely.
Time Carries a Price Too
Hours in front of a screen cost something that no statement records. Sleep, focus and patience all draw from one small pool.
So a heavy week borrows from the following one. Traders who protect their hours tend to hold their rules better when a session turns messy.
What the Public Data Actually Says
Regulators in Europe and the United Kingdom require contract-for-difference brokers to publish the share of retail accounts that lose money. Those mandated disclosures usually sit somewhere between roughly seventy and eighty-five percent.
Read that figure precisely. It counts retail CFD accounts at one provider over a rolling year, not every trader in every market. Still, it tells you that costs and behaviour beat most people, which makes activity control worth taking seriously.
A Worked Example of the Cost Drag
Numbers make the drag concrete, so walk one simple case. The figures illustrate the mechanics and predict nothing about your own results.
Picture a twenty thousand dollar account with a plan that expects forty trades a month. You risk half a percent per trade, so one hundred dollars sits at stake each time.
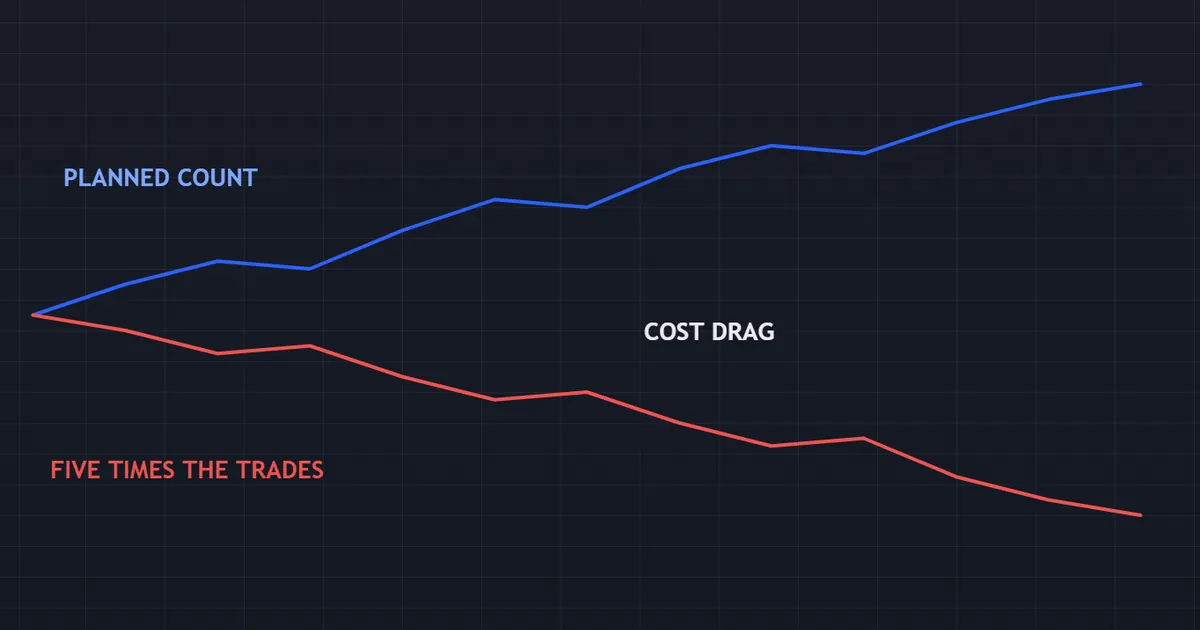
Assume each round trip costs about four dollars in spread and commission. Forty trades cost one hundred and sixty dollars a month, which barely registers against the balance.
Now push the count to two hundred trades. The cost line jumps to eight hundred dollars, or four percent of the account, before a single trade goes wrong.
The Same Edge With Fewer Trades
Suppose your setup returns an average of one tenth of your risk per trade. Forty planned trades then produce four hundred dollars of gross edge.
Subtract the one hundred and sixty dollars of cost, and the month nets two hundred and forty dollars. Modest, but it compounds.
What the Extra Trades Do
Add the extra one hundred and sixty trades, and the picture flips. Those came from restlessness, so treat them as break-even before costs.
Gross edge stays at four hundred dollars, while total cost climbs to eight hundred. The month therefore ends four hundred dollars down, on the same strategy and the same market.
Nothing about the method changed. Only the count moved, and the count alone decided the outcome.
What the Sums Leave Out
This example assumes a steady edge and calm execution. Neither assumption survives a heavy session.
Tired traders widen stops, chase entries and skip the journal. So the real gap runs wider than the arithmetic suggests.
How to Measure Your Own Activity
Opinions about activity settle quickly once numbers arrive. Three simple figures do most of that work.
Pull them from your statement each Friday, then track them across a quarter. Trends matter far more than any single week.
The Unplanned Share
Count the trades that matched a written setup, then count the rest. Divide the second number by the total.
That ratio names your unplanned share. Because it ignores profit entirely, it stays honest during a lucky run and during a rough one.
Cost Against Gross Profit
Add spread, commission and swap for the month. Then compare that total against your gross profit before costs.
Anything above a quarter deserves attention, and anything above a half signals real trouble. So track the ratio monthly, and watch its direction rather than its exact level.
Trades Per Hour at the Screen
Divide your monthly trade count by the hours you spent watching charts. The result exposes restless sessions quickly.
A rising figure usually means the filter has loosened. So read it beside the unplanned share, since the two move together in a bad month.
Rules That Stop Overtrading
Vague resolutions fail here. A rule works only when a number, a time or a checkbox enforces it.
Pick two or three from this list rather than all of them. Because a rule you actually follow beats a perfect rule you abandon, start small.
Write each chosen rule on one card, and keep it in view. Review the card every Sunday, and change nothing during the week itself.
Cap the Trade Count
Choose a hard maximum for the day, and write it on paper. Three trades suits many intraday plans, while one suits most swing plans.
When the cap arrives, close the platform. Because the cap removes the decision, it survives a bad mood better than any promise to behave.
Set a Daily Loss Limit
A loss limit stops the spiral before it starts. Two percent of the balance works as a common starting point.
Hit it, and the day ends regardless of what the chart offers. Our guide to the daily loss limit covers how to set and enforce one.
Write a Pre-Trade Checklist
Five questions on a card filter out most impulse entries. Ask which setup this matches, where the stop sits, and what the size should be.
If any answer takes longer than a moment, skip the trade. Because the checklist runs before the click, it catches the trade you would otherwise regret.
Book Your Sessions
Open hours invite open-ended trading. So choose two windows that match your strategy, and stay away outside them.
A scheduled session also protects the rest of your day. Screen time falls, sleep improves, and the trades you do take get proper attention.
Log the Reason, Not Just the Result
A journal that records only profit and loss misses the whole story. Add one field for the reason you entered.
Review it weekly, and count how many entries name a written setup. Our free trade journal keeps that field beside every position so the pattern shows up quickly.
Size Against Your Rules
Activity control means little if each trade carries wild size. So fix a percentage per trade and stick to it.
Our note on risk per trade shows how to pick that percentage and defend it. Consistency there removes half the temptation to chase.
Build In a Cooling-Off Period
Give every loss a fixed pause before the next entry. Fifteen minutes away from the desk suits most intraday plans.
Leave the room, since staring at the chart defeats the point. Because the urge fades faster than traders expect, a short walk prevents most of the damage.
Download the complete indicator database
Put these concepts on your charts. One email unlocks the full library of 1,380+ indicators with compiled MT4 and MT5 files, plus my TradingView scripts. No paywall, no spam, unsubscribe any time.
Get free access to my indicator database
One email unlocks 1,380+ free MT4, MT5 and TradingView indicators — the complete library. No single-tool download; you get the whole database.
Common Mistakes and the Fix
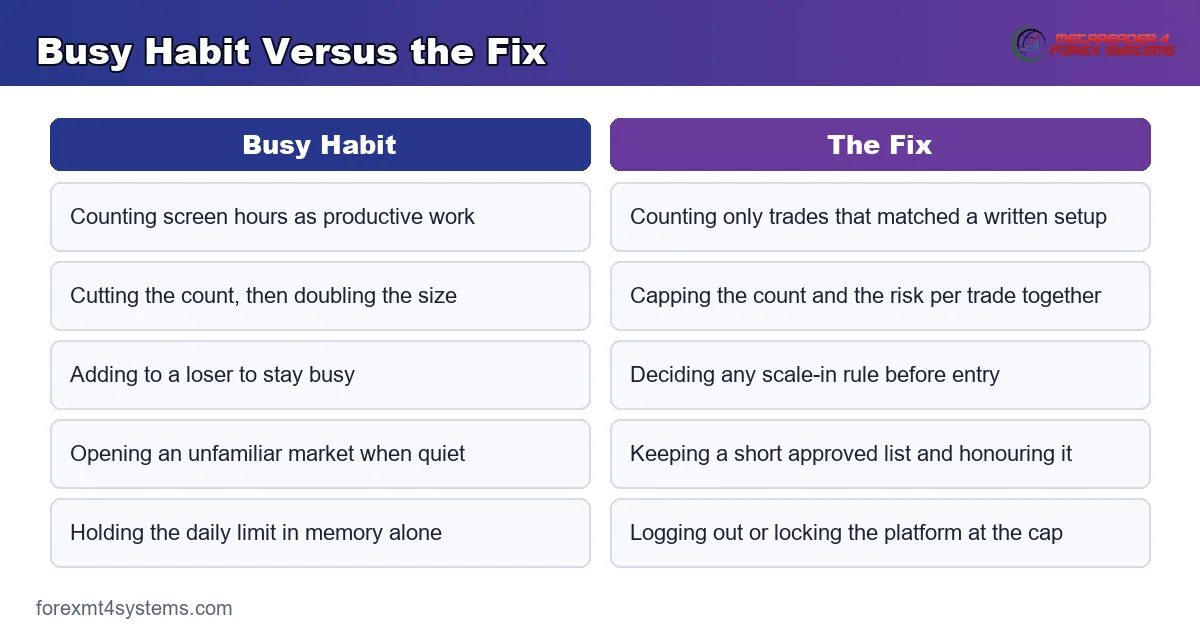
A few errors show up again and again in trading records. The comparison graphic below sets each habit beside the correction it needs.
Treating Activity as Effort
Screen hours feel like work, so a busy day feels productive. The market pays for accuracy rather than for hours. Count the trades that matched your plan, and treat that number as your real output.
Fixing the Count and Ignoring Size
Traders often cut the count and then double the size to compensate. The account ends up in the same place with fewer chances to recover. Cap both dials, and review them together every week.
Adding to a Loser to Stay Busy
Averaging down feels like conviction, though it usually reflects restlessness. The position grows exactly when the thesis weakens. Decide before entry whether you will scale in, and never make that call while losing.
Opening a Second Market for Something to Do
A quiet primary market tempts traders into an unfamiliar one. Unfamiliar markets punish that quickly. Keep a short approved list, and treat anything outside it as off limits.
Setting a Limit With No Enforcement
A limit held only in memory bends under pressure. So build a barrier that acts for you. Log out, use a platform lock, or hand the password to someone for the rest of the day.
Reviewing Only the Outcome
A profitable impulse trade teaches the wrong lesson. Judge each trade by whether it followed the plan, then judge the plan by its results over a quarter. That order keeps luck from rewriting your rules.
Quick Reference Checklist
Keep this short list beside the screen. Run through it whenever a session starts to feel busy.
Seven lines cover the whole argument. Read them slowly once a week, and the habit loses most of its cover.
- Your plan, not a general rule, defines your normal trade count.
- Frequency and size form one problem with two dials.
- Costs scale with activity, while edge does not.
- Boredom, action bias and sunk-cost thinking drive most extra trades.
- A daily trade cap and a daily loss limit stop spirals early.
- A five-question checklist filters impulse entries before the click.
- Journal the reason for entry, then count unplanned trades each week.
Pitfalls and Edge Cases
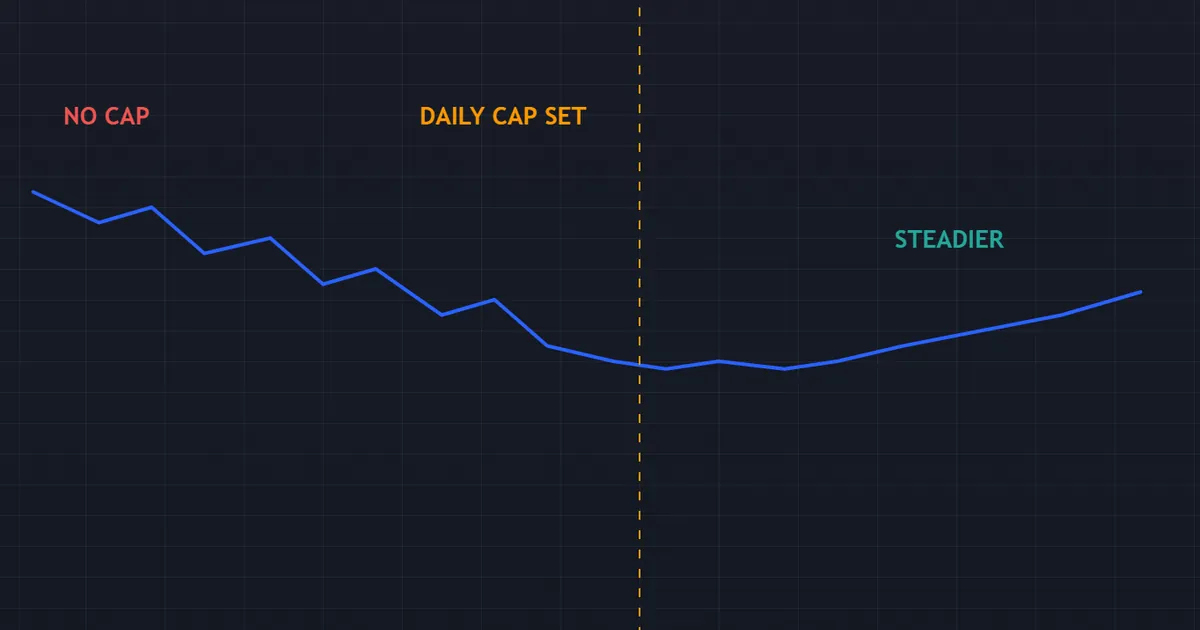
A few wrinkles bend the clean picture, so keep them in view. The panel below shows how the same account behaves once activity gets capped.
Correlated Positions Hide the Count
Four positions across related pairs act like one large trade. The count looks disciplined while the exposure does not. Group correlated markets, and count the group as a single position.
Prop Rules Punish It Twice
On an evaluation account, heavy activity burns the daily limit and the consistency clause together. So a trader can pass on gross profit and still fail the review. Keep the count low while any evaluation runs.
Too Few Trades Also Fails
The opposite error exists and gets less attention. A trader who skips valid setups earns nothing from a working plan. Track missed signals in the journal alongside the extra ones.
Event Days Distort the Count
Major data releases cluster setups into a short window. So a raw count for that day misleads you. Compare like with like, and mark event days in the record.
Several Accounts Split the Count
Traders who run two or three accounts often judge each one alone. The combined activity then hides in plain sight. Add the counts together every week, and treat the total as the number that matters.
Automation Moves the Problem
An expert advisor removes the clicking without removing the impulse. Traders then tinker with settings between runs. Freeze the parameters for a fixed test period, and record every change with a reason.
When It Stops Being a Trading Problem
Some cases run past technique, and pretending otherwise helps nobody. If trading disturbs your sleep, strains your finances or damages your relationships, no checklist will fix it.
Step away from the market, and speak to a qualified professional. Compulsive trading shares features with problem gambling, and proper support services exist for exactly that. Nothing here replaces that kind of help.
Related Concepts to Study Next
This habit rarely travels alone, so a few neighbouring topics repay an hour of reading. Each one explains part of the loop that keeps the trade count high.
Start with revenge trading, which describes the fastest route into an unplanned session. Then read about fear of missing out, the impulse that fills quiet hours with marginal entries. For the rule side, see our trading discipline rules. To price your own activity properly, run the numbers through the expectancy calculator and see how much cost your edge can carry.
FAQ
What is overtrading in simple terms?
It means trading more often, or in larger size, than your plan and your edge support. The trades stop matching written setups and start filling time instead. Because the benchmark sits in your own rules, the same trade count can look fine for one method and reckless for another.
How many trades a day counts as too many?
No universal number exists. A scalping plan may expect thirty, while a swing plan may expect one a week. Write down the count your strategy needs, then treat anything well above it as a warning rather than a badge.
Does overtrading only mean too many trades?
No, size matters just as much. A trader who takes two positions a week at five times the planned risk has the same problem in a different form. Check the count and the size together whenever you review the week.
Why do costs matter so much here?
Spread, commission, swap and slippage scale directly with activity. Your edge does not. Five times the trades means five times the cost, which can turn a modest positive month into a negative one without a single bad decision on any chart.
What single change helps most?
A hard daily trade cap, enforced by closing the platform, does more than any mindset advice. Pair it with a daily loss limit and a short pre-trade checklist. Those three rules remove the decision at the moment when judgement is weakest.
Can a journal really change the habit?
A journal with a reason field turns a vague feeling into a countable number. Once you see that eleven of last week’s twenty trades matched no setup, the argument ends. Progress then shows up as a falling count of unplanned entries, though the market still decides each outcome. Results are not guaranteed; past performance is not indicative of future results.
External references
- For background on this concept, see Overtrading at Investopedia.
- For broader market context, see Impulsivity on Wikipedia.

About the author
Written by Dominic Walsh, a Forex trader and MT4/MT5 indicator, Expert Advisor and script developer. Every tool on forexmt4systems.com is tested on live charts before release and ships with ready-to-use compiled MT4 (.ex4) and MT5 (.ex5) files. Learn more about the trader and developer behind this site.
How we build, test and correct every tool: Editorial & Testing Policy. Trading carries risk; see the disclaimer.