
The SMC vs price action question surfaces the moment a new trader discovers order blocks. Both approaches read raw candles rather than lagging indicators. Yet SMC wraps that reading in an institutional story, while classic price action stays broader and older. So the two overlap far more than the online tribes admit.
This guide places SMC inside the wider history of price action, then shows where each one helps and where each one hurts. So by the end, you will know which method suits your temperament, how to borrow the best of both, and when a simple support line beats a stack of jargon.
SMC vs Price Action at a Glance
Price action is the umbrella term. It covers everything you can read from the candles alone: support and resistance, trendlines, chart patterns, and candlestick signals. Smart money concepts, or SMC, is a newer branch of that tree. It grew from the work of Michael Huddleston, the Inner Circle Trader, and it labels price action through an institutional lens.
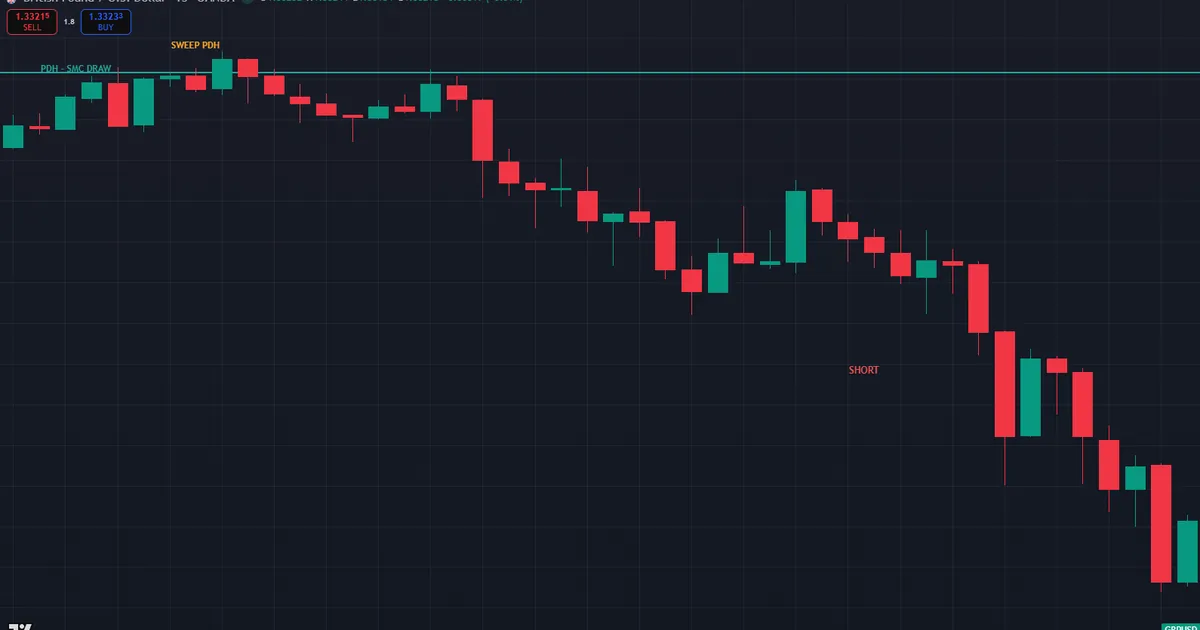
The chart below shows a pure SMC read. GBPUSD sweeps the previous day high at 1.33908 up to 1.33934 on the fifteen-minute chart, shifts structure down, and leaves a bearish order block just under the swept high. Then a short triggers on the retrace toward 1.33269. Every label here comes from the SMC vocabulary.
| Aspect | SMC | Classic Price Action |
|---|---|---|
| Age | Recent, since the 2010s | Decades of trading tradition |
| Core tools | Order blocks, liquidity, structure shifts | Support, resistance, patterns, candles |
| Narrative | Institutions hunting liquidity | Supply and demand at levels |
| Precision | Tight, rule-based zones | Broader, discretionary areas |
| Learning curve | Steeper vocabulary | Gentler and more intuitive |
Read the table as two dialects of one language. Both watch price at levels and both wait for a reaction. SMC simply adds a story about who is buying and why. So the disagreement is often about vocabulary and precision, not about whether the candles matter.
Keep that lineage in mind as you read on. So whenever a course frames SMC and price action as enemies, remember that one grew directly out of the other. The useful question is not which side to join. Instead, ask what each method contributes to a single, clearer read of the same chart.
What Classic Price Action Covers
Price action trading predates every modern acronym. Traders have read bars, ranges, and reactions for a century. So the toolkit is broad and battle-tested, and much of it needs no special labeling at all.
Three families make up the classic core. First come the levels: horizontal support and resistance, round numbers, and prior swing points. Second come the patterns: double tops, head and shoulders, triangles, and flags. Third come the candles: pin bars, engulfing bars, and inside bars that signal a shift in pressure.
The strength of this approach is flexibility. A trader can read any market with the same eyes, because levels and reactions appear everywhere. Also, the ideas are intuitive: price stalls where buyers and sellers fought before. So a beginner grasps support and resistance in an afternoon, then spends years refining the feel.
Context is the quiet skill inside price action. A double top means one thing at the top of a long rally and another inside a tight range. So the same pattern carries different weight depending on where it prints. Experienced readers weigh the trend, the location, and the momentum before they trust any single signal, which is why the method rewards screen time so heavily.
The Weakness of Pure Levels
Broad areas cut both ways. A support zone might be five pips wide or fifty, and two traders will draw it differently. So entries and stops become fuzzy. Classic price action rarely tells you exactly where a level fails, which is precisely the gap SMC set out to close.
Timing is the second soft spot. Classic price action tells you where to act but seldom when. A pin bar at support looks identical at 3:00 a.m. and at noon, yet the two carry very different odds. So a pure price-action trader can read the level perfectly and still enter during a dead, low-liquidity hour.
Why Price Action Endures
Despite those gaps, the method refuses to die. Markets change, but human reactions at levels do not. So the same support-and-resistance logic that worked decades ago still frames charts today. That durability is why every newer framework, SMC included, quietly rests on a price-action foundation.
What SMC Adds to the Picture
SMC takes price action and sharpens it. Rather than a wide support zone, it defines a specific order block: the last down-close candle before a move that breaks structure. So the entry zone shrinks from an area to a few pips, and the invalidation becomes precise.
The framework also adds a why. Classic price action says price reacts at levels; SMC says institutions defend those levels because liquidity rests there. Whether or not the story is literally true, it gives traders a consistent reason to wait for a sweep before an entry. Our what is ICT trading primer explains that narrative in full.
Structure is the third addition. SMC formalizes trends into a language of breaks. A break of structure confirms continuation, while a change of character warns of a turn. The market structure shift guide shows how that formal grammar tightens a read that classic price action leaves loose.
Notice what SMC does not replace. It still needs a level, a reaction, and a trend, exactly like price action. So the framework refines rather than reinvents. A trader who already reads support and resistance well simply gains a sharper ruler, not a whole new pair of eyes. That is why the two methods coexist so easily in practice.
Mapping the Vocabulary
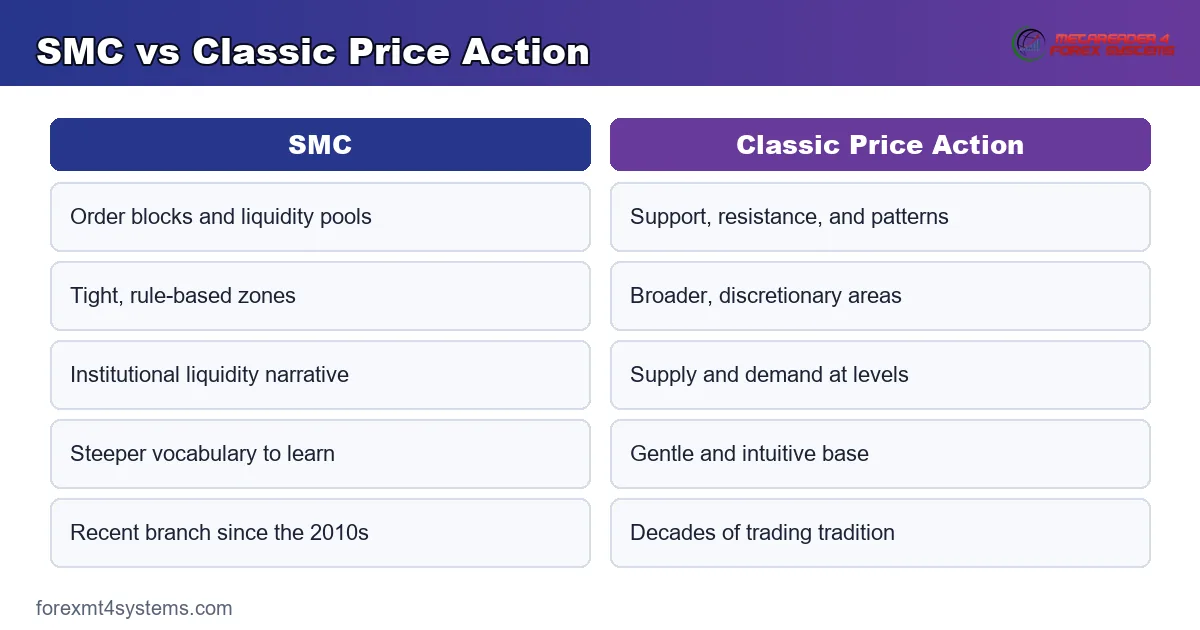
Use this quick map to see how the two vocabularies line up.
- A classic support or resistance level becomes an SMC order block or breaker.
- A false breakout becomes a liquidity grab or sweep.
- A trendline break becomes a break of structure or change of character.
- A supply or demand zone becomes a refined order block inside it.
- A round-number reaction becomes liquidity resting at an obvious level.
The concept graphic below places the classic terms beside their SMC equivalents so the shared roots are clear.
The Cost of the Extra Precision
Sharper zones come at a price. A five-pip order block gets clipped by noise that a fifty-pip support shelf would absorb. So the tighter entry can mean a tighter, more fragile stop. Traders who chase precision sometimes trade themselves out of good positions on ordinary wiggles.
Vocabulary is the other cost. SMC introduces a stack of new terms, and a beginner can spend weeks memorizing labels instead of watching price. So the framework rewards study but punishes the impatient. The clean chart underneath the jargon is still the thing that matters most.
Where Each Method Fits in a Workflow
Both approaches share the same skeleton once you strip the labels. Read the higher timeframe, find a level, wait for a reaction, then execute lower down. The words differ; the routine holds.
Start with context on the four-hour or one-hour chart. A price-action trader marks the obvious support and resistance and the dominant trend. Meanwhile, an SMC trader marks the order blocks, the liquidity pools, and the last structure break. Same chart, two sets of annotations, often at the same prices.
Drop to the five-minute or fifteen-minute chart for the trigger. The price-action trader waits for a pin bar or engulfing candle at the level. The SMC trader waits for a sweep and a structure shift into the order block. Then both enter on confirmation with a stop beyond the extreme.
Timing is where SMC borrows extra discipline from its ICT roots. Indeed, SMC traders weight the London and New York sessions, roughly 2:00 to 5:00 a.m. and 8:30 to 11:00 a.m. New York time. Classic price action rarely insists on the clock. So adding the session lens sharpens either method.
Two Legends, One Map
The overlap becomes obvious once you annotate a chart twice. Draw your support and resistance first, then add the order blocks and liquidity pools. Most of the time the marks cluster in the same places, because both methods react to the same historical levels. So the frameworks are not competing maps; they are two legends for one terrain.
Where they differ is resolution. Price action paints in broad strokes, while SMC zooms into the pixel. Neither picture is more correct. Instead, each suits a different moment: the broad view for bias, the tight view for the trigger. Skilled traders zoom between the two rather than pledge loyalty to either.
Worked Example: A Price-Action Long on EURUSD
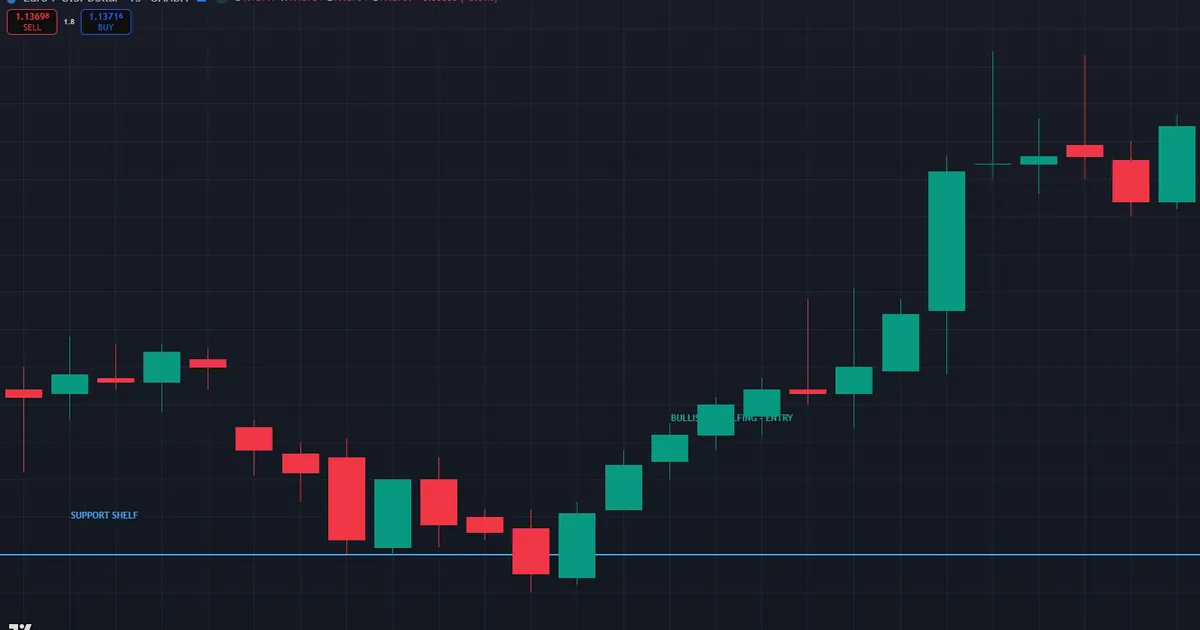
Now flip the direction and drop the jargon. EURUSD falls to a well-tested support shelf at 1.1407 on the fifteen-minute chart, a level that held twice over the prior two days. Buyers defended it before, so the shelf is obvious to any chart reader.
Price dips to 1.1406, briefly undercutting the shelf, then prints a strong bullish engulfing candle that closes back at 1.14081. That reaction is textbook price action: a false break of support followed by a decisive rejection. The chart below shows the shelf, the undercut, and the engulfing signal.
Then the trade assembles simply. Entry comes on the close of the engulfing candle or a shallow pullback toward 1.14075. The stop sits below the 1.1406 low, a tight few pips of risk. Meanwhile, the first target is the prior swing high overhead, with the next round number just beyond.
The Same Shelf, the SMC Way
An SMC trader would reach the same trade by another road. The undercut of 1.1407 is a liquidity grab, the engulfing close is a change of character, and the origin candle is a demand order block. So both readers buy the same rejection, at the same shelf, with the same stop. The story differs; the trade matches.
One nuance separates the two entries, though. The price-action trader may buy the engulfing close immediately, while the SMC trader waits for a pullback into the order block. So the SMC version can offer a tighter stop, yet it also risks missing the move if price never retraces. Neither choice is wrong; they simply trade risk against certainty in opposite directions.
Blend the two and you get the best of both. Use the price-action shelf to spot the opportunity, then the SMC order block to refine the entry and stop. Also add the session lens to confirm the timing. That combination reads the chart with plain eyes first and sharp tools second, which is exactly the balance most consistent traders settle into.
Download the complete indicator database
Put these concepts on your charts. One email unlocks the full library of 1,380+ indicators with compiled MT4 and MT5 files, plus my TradingView scripts. No paywall, no spam, unsubscribe any time.
Get free access to my indicator database
One email unlocks 1,380+ free MT4, MT5 and TradingView indicators — the complete library. No single-tool download; you get the whole database.
Common Mistakes and How to Fix Them
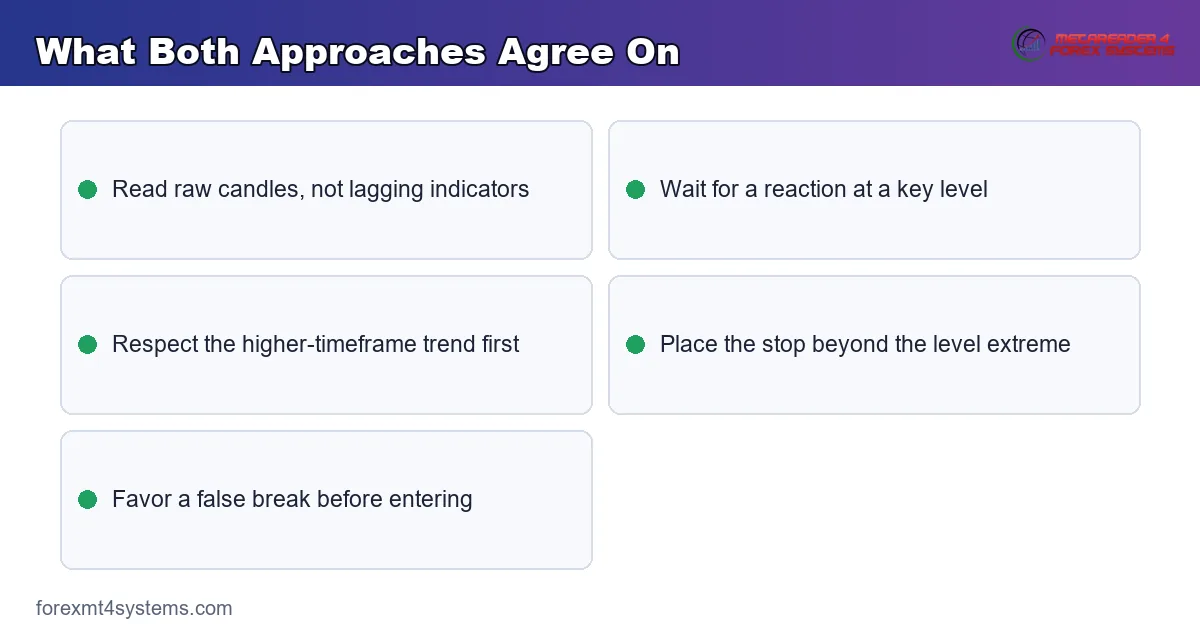
Choosing between the two methods breeds predictable errors. The graphic below gathers the most common ones, and each correction follows beneath it.
Over-labeling simple charts
Not every wick needs an order block. So if a plain support line explains the reaction, use it. Drowning a clean chart in jargon adds effort without adding edge.
Dismissing SMC as a fad
The institutional labels do add precision and a consistent entry trigger. Instead of rejecting them outright, borrow the tighter zones and the sweep requirement. You can keep your price-action base and still gain sharper stops. Dismissing a useful tool because it is fashionable is just as costly as chasing it blindly.
Ignoring the higher timeframe
Both methods fail when you skip context. A perfect order block or a clean pin bar means little against a strong opposing trend. Always anchor the signal to the four-hour bias first, then let the smaller timeframe supply only the trigger.
Confusing precision with certainty
A tight SMC zone is still just a zone. Narrow stops feel safer, yet they also get clipped by noise. So size the position for the real volatility, not for the width of the box.
Switching methods after every loss
Jumping between SMC and price action mid-drawdown breeds confusion. Pick one primary lens, master it, and add the other slowly. Consistency in the method beats constant reinvention.
Quick-Reference Checklist
Run this list before you act on any SMC or price-action setup. It keeps the method from getting in the way of the read.
- The higher-timeframe trend and key levels are marked first.
- A clear level, whether a support shelf or an order block, defines the zone.
- A reaction confirms the level: a candle signal or a structure shift.
- A false break or sweep preceded the entry where possible.
- The stop sits beyond the level, sized for real volatility.
- An active session adds timing confluence.
- Entry, stop, and target are mapped before you click.
Where the SMC Label Can Mislead
Now study the case where SMC jargon actively hurts, because that is where dogma costs money. The danger is forcing an institutional label onto a chart that a plain level already explained better. So a trader ignores obvious support and trusts a freshly drawn order block instead.
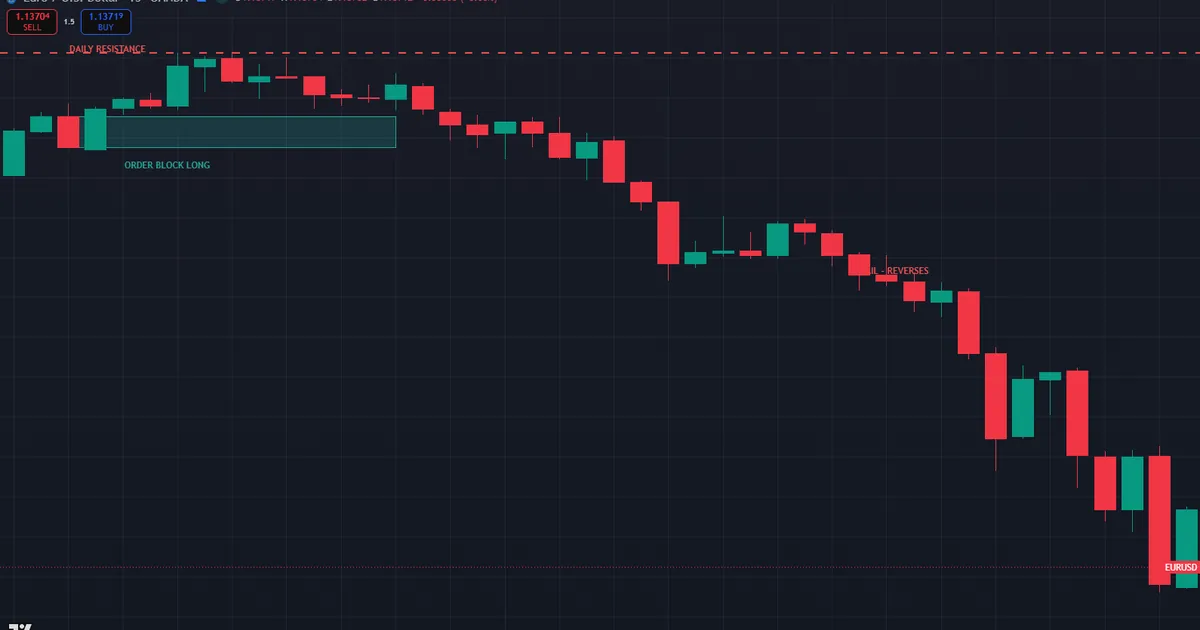
Picture EURUSD grinding up toward a major daily resistance at 1.14356, a level visible to every trader on the planet. A short-term chart prints a small bullish order block at 1.14257, and an SMC purist buys it, targeting new highs. Yet the daily resistance sits just above, dense with sellers. Price tags 1.14356, stalls, and reverses hard down through the order block, which never mattered against the bigger level. The chart below shows the ignored resistance, the failed order block long, and the reversal.
The Invalidation and the Balance
The invalidation rule keeps the loss small. Once price closes a body back through the order block against you, the idea is void. So exit at once. The lesson is not that SMC is wrong; it is that a small institutional label never overrides an obvious higher-timeframe level.
Afterwards, log three facts in your trade journal: the nearest higher-timeframe level, whether your entry fought it, and whether a simpler read existed. Traders who track those columns quickly learn when to trust the jargon and when to fall back on a plain line.
The opposite error exists too. Sometimes a trader dismisses SMC entirely and buys a broad support shelf with no confirmation, only to watch price slice straight through it. A sweep and a structure shift would have warned them to wait. So neither method is safe on its own; each one covers a blind spot in the other. Balance, not allegiance, keeps you out of both traps.
Which Should You Learn First
Start with classic price action if you are new. Support, resistance, and candle signals build the base intuition that everything else rests on. So a beginner who understands why price reacts at levels absorbs SMC far faster later. Skipping straight to order blocks without that base tends to produce label-collectors who cannot actually read a chart.
Add SMC once the base is solid. The order blocks, sweeps, and structure grammar then feel like sharpening tools rather than a foreign language. Compare the two frameworks directly in our ICT vs SMC guide, and study the shared backbone in the market structure guide.
Temperament matters as much as sequence. Some traders love precise rules and thrive on SMC’s tight zones. Others prefer a looser, feel-based read and stay happier with classic levels. So there is no single right order for everyone. Try both honestly for a few weeks each, then keep whichever one you actually follow under pressure, because the best method is the one you can execute consistently when a trade goes against you.
Related Concepts to Study Next
A couple of neighboring ideas complete this map. The full guide to order block trading shows how the SMC entry zone works in depth, with more worked examples. Meanwhile, the market structure guide you met earlier explains the trend grammar that both methods depend on. Stack the pieces, then let the smart money indicators mark the zones and shifts automatically while you keep an eye on the plain levels. A short drill helps: take one chart, mark it in classic price-action terms, then re-mark it in SMC terms, and note how often the levels land in the same place.
FAQ
Is SMC just price action with extra steps?
Partly. SMC is a branch of price action that adds institutional labels and tighter zones. The extra steps buy precision and a consistent entry trigger, though they also add jargon a plain chart may not need.
Can I trade profitably with only classic price action?
Many traders do. Support, resistance, and candle signals form a complete method on their own. SMC refines the entries, but the underlying edge comes from reading reactions at levels, which price action already teaches. Plenty of long-term traders never touch an order block and still perform well, because discipline and risk control matter more than the label set.
Does SMC work on all markets?
It works wherever liquidity and structure exist, including forex, indices, and crypto. That said, thinner markets produce messier structure. So the same caution applies as with any price-action method: context and volatility matter more than the label. On very illiquid instruments, both approaches degrade together, because the clean reactions they depend on simply stop appearing.
Why do SMC traders draw such tight zones?
The order block narrows a broad supply or demand area to the single candle that started the move. So the zone becomes small and the invalidation precise. The trade-off is that tight zones get clipped by noise more often.
Should I abandon indicators entirely?
Not necessarily. Both SMC and price action lean on raw candles, yet a moving average or session tool can add useful context. The key is to let the price action lead and treat any indicator as a supporting filter.
Which method is more reliable?
Neither is inherently more reliable; both read the same candles. Reliability comes from context, timing, and disciplined risk, not from the choice of vocabulary. Judge every setup on its own merits, and remember that the trader behind the method drives the outcome. Results are not guaranteed; past performance is not indicative of future results.
External references
- For background on this concept, see Open-high-low-close chart on Wikipedia.
- For broader market context, see Bar Chart at Investopedia.

About the author
Written by Dominic Walsh, a Forex trader and MT4/MT5 indicator, Expert Advisor and script developer. Every tool on forexmt4systems.com is tested on live charts before release and ships with ready-to-use compiled MT4 (.ex4) and MT5 (.ex5) files. Learn more about the trader and developer behind this site.
How we build, test and correct every tool: Editorial & Testing Policy. Trading carries risk; see the disclaimer.