
A market structure shift (MSS) is the moment price breaks a meaningful swing point with enough force to flip your directional bias. Yet not every break qualifies. Truly valid shifts need displacement — an energetic push through the level that leaves an imbalance behind.
This guide gives you the exact definition, a five-point validity checklist, and two worked examples with real levels. So by the end, you will be able to separate a real shift from a weak poke through a level, and you will know precisely when to start hunting entries in the new direction.
What Is a Market Structure Shift?
The term comes from Michael Huddleston, the Inner Circle Trader (ICT). In his model, market structure is the sequence of swing highs and swing lows a chart prints. First, picture an uptrend: higher highs and higher lows, stacked one after another. Then imagine price suddenly driving below the most recent higher low with large, full-bodied candles. That break is the market structure shift.
Plainly put, the MSS marks the spot where the old trend loses control of the tape. Indeed, buyers who defended every dip just failed to defend one. Hence the bias flips: rallies now become selling opportunities rather than dips to buy. Meanwhile, the mirror applies in a downtrend, where an MSS is a displacement break above the last lower high.
Reading a Real MSS on the Chart
Now note the strict part of the definition. An MSS is not any break of any level. Indeed, ICT teaches that the shift must come with displacement through a swing point that actually mattered — typically the swing that produced the most recent extreme. The chart below shows that mirror case in action: a bullish shift on the EURUSD one-hour chart from July 13, 2026, with the broken lower high at 1.14309 and the displacement candle labeled.
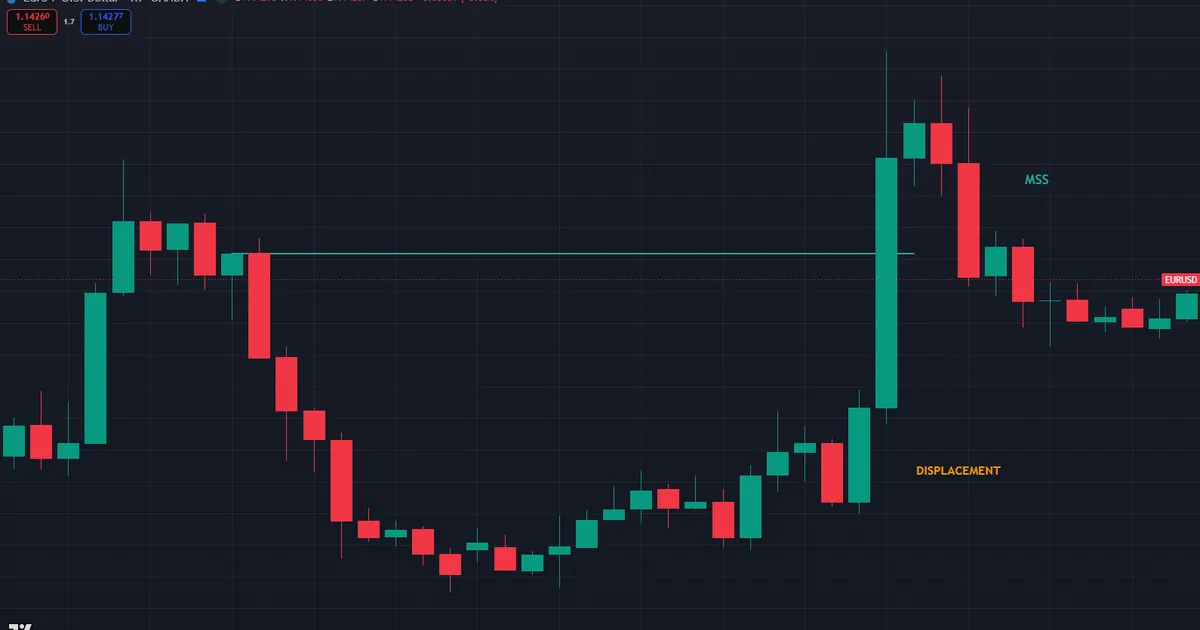
Walk through the frame from left to right. Before the break, EURUSD had stepped lower for days, and each rally stalled beneath the prior one. The trend line traces the swing that mattered — the lower high at 1.14309 that capped the last bounce. Then a single expansive candle drove through that level and closed well clear of it, earning the MSS and DISPLACEMENT labels on the chart. Also watch what happened next: price held above the broken level instead of sliding straight back. That hold is the tell that the shift was real, and it turned every later dip into a buying opportunity.
MSS vs CHoCH vs BOS: Sorting the Terms
Traders mix these three labels constantly, so let us separate them. First, a break of structure (BOS) is a continuation event. Price breaks a swing in the direction of the existing trend, and the trend rolls on. Second, a change of character (CHoCH) is the first counter-trend break — the earliest warning that the trend may be turning.
So where does the MSS sit? Most ICT practitioners treat the MSS as a CHoCH with teeth. Indeed, both break a counter-trend swing point. Yet the MSS demands displacement, while a CHoCH label often gets applied to any technical break, however weak. Thus every valid MSS would qualify as a CHoCH, but plenty of CHoCH breaks never earn MSS status. We unpack the continuation side of this in our BOS vs CHoCH comparison.
Also remember that every label is timeframe-relative. A one-hour MSS can be nothing more than a deep pullback on the daily chart, and a five-minute BOS can live inside a four-hour consolidation. So state the timeframe whenever you mark a break, and read each label only within its own scale.
Keep the vocabulary straight and the charts get simpler. Labels only summarize what price already did. Next comes the harder question: was the break energetic enough to trust? That question is where displacement enters.
Displacement Makes the Shift Valid
Displacement is the engine of the whole concept. It means one or more candles with unusually large bodies, small wicks, and near-vertical delivery through the swing point. Also, real displacement almost always leaves a fair value gap (FVG) — a three-candle imbalance where the middle candle’s move was so fast that the first and third candles’ wicks never overlap.
Why does this matter? Institutional orders consume liquidity aggressively and leave footprints. Meanwhile, a slow drift through a swing low shows no urgency and no commitment. Hence such breaks fail often and trap traders who assumed the trend had turned. If you want the full anatomy of these candles, read our guide on displacement in trading.
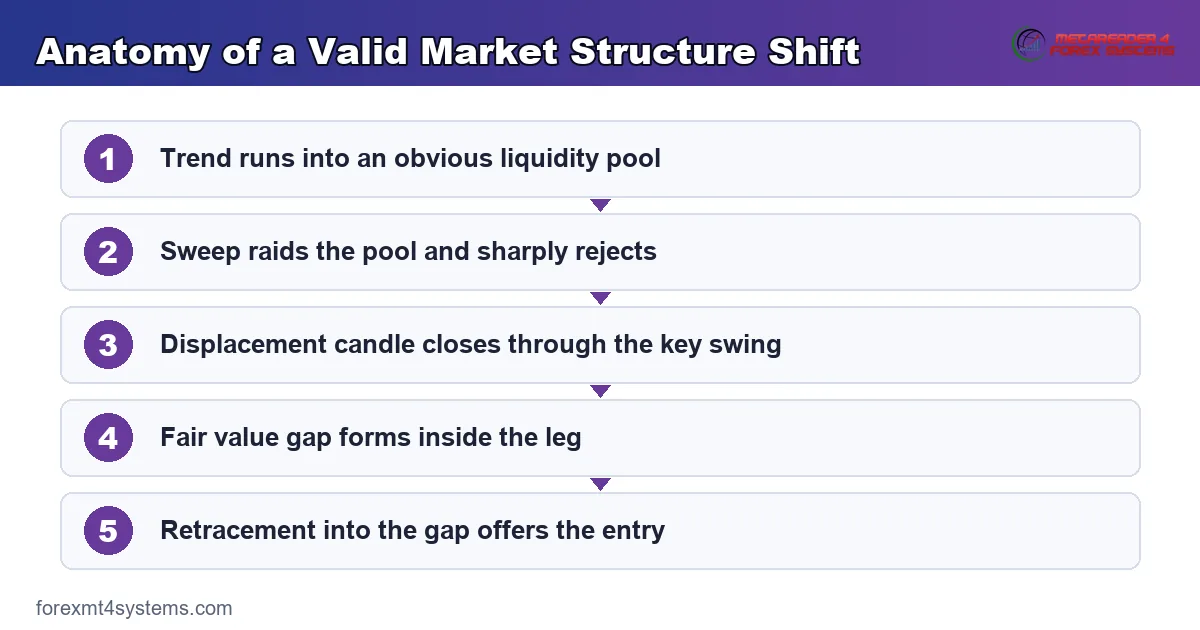
First rule of thumb: measure the breaking candle against the previous ten candles. If its body is at least twice the recent average and it closes beyond the swing point, displacement is credible. Second rule: check for the FVG. No gap usually means no institutional urgency. The graphic below compresses the whole anatomy into one reference you can keep beside your charts.
Whose Orders Create the Shift
Understand who does what during the break, and the pattern stops feeling like magic. On one side sit trapped traders. In a bearish shift, they bought every dip during the uptrend, and the displacement leg just put the newest group underwater. Their exits add selling fuel as price falls. Meanwhile, breakout sellers chase the big candle and pile in at a poor price, which supplies the later retracement.
On the other side sit larger players who built positions into the preceding sweep. Indeed, the raid on the old high handed them resting buy orders to sell against, and the displacement leg is their position printing on the tape. Hence the sequence matters so much: raid first, reversal second. The raid funds the move.
Stops complete the picture. Every higher low in an uptrend collects protective sell stops beneath it. So when the level breaks, those stops fire as market sells and accelerate the drop. That cascade explains why a true shift travels fast — three crowds sell at once, and only one of them planned to.
How to Identify a Valid MSS: The Checklist
Run every candidate shift through this five-point checklist before you act on it.
- A liquidity sweep came first. The strongest shifts begin right after price raids an obvious high or low and rejects. Read the full guide to liquidity sweep trading for that setup.
- The broken swing actually mattered. Use the swing low that produced the latest high, or the swing high that produced the latest low. Minor internal wiggles do not count.
- Bodies closed through the level. A wick poke is a sweep, not a shift. So demand at least one candle body closing beyond the swing point.
- Displacement left an FVG. Fast, full-bodied candles with a visible imbalance confirm urgency.
- Timing and alignment fit. The shift should agree with the higher-timeframe draw on liquidity, and it carries more weight inside active windows such as 8:30–11:00 a.m. New York time.
Score the move honestly. So four or five ticks means you have a tradeable shift. Meanwhile, two or three ticks means you wait for more evidence before committing risk. Half-valid shifts produce the most painful losses, because they look convincing right up until they reverse.
Worked Example: EURUSD One-Hour Chart
Picture EURUSD grinding upward through the London morning. Price prints higher lows at 1.0895 and 1.0912, then pushes into the previous day’s high at 1.0950. Next, the pair spikes to 1.0958, sweeping resting buy stops above that old high, and stalls.
Then the shift arrives. Within two hours, three consecutive bearish candles drive through the 1.0912 higher low and close at 1.0898. The middle candle leaves a fair value gap between 1.0928 and 1.0918. Indeed, every checklist item ticks: sweep first, meaningful swing broken, body closes, displacement with an FVG, and it all happened in the New York morning.
Now comes the entry work. Price retraces into the 1.0918–1.0928 gap, which also overlaps the 62–79% retracement of the displacement leg. Traders using this model short inside that zone, place the stop above the 1.0958 sweep high, and target the liquidity resting under 1.0850. Also, our Fibonacci calculator speeds up marking that retracement zone.
Aftermath matters too. In this sequence the pair ground lower over the next two sessions and tagged the pool under 1.0850 without ever closing back above the broken 1.0912 swing. Exit style stays personal — partials, trail, or full target. Yet the invalidation line never moved, and that steadiness is what a healthy shift looks like after entry.
Where the MSS Sits in the ICT Workflow
The shift is a confirmation tool, not a standalone system. The full sequence runs top-down. First, establish higher-timeframe bias from the daily and four-hour charts. Second, identify the pool of liquidity price is likely to raid — a previous day’s high or low, or an equal-highs cluster. Then drop to the five-minute or fifteen-minute chart and wait for the sweep. Only after the sweep do you demand the MSS as proof that the reversal is real. Skipping any step in this chain turns the model into guesswork.
Pair the timeframes deliberately. A common split anchors bias on the four-hour chart, marks the zone of interest on the one-hour, and executes off the five-minute shift. Also, respect the clock. Most clean shifts on EURUSD and GBPUSD print inside the London open, 2:00–5:00 a.m. New York time, or the New York morning, 8:30–11:00 a.m. Our free forex market hours tool shows when those windows arrive in your local time.
Entries come last, inside the FVG or optimal trade entry zone the displacement created. Still, patience pays here: the retracement usually arrives within a handful of candles, and chasing before it forms means a wide stop at a poor price. Also, automation helps: our IDM CHoCH BOS indicator labels structure breaks in real time, and the wider library of ICT indicators for MT4 and MT5 covers the sweep and FVG detection around it.
Worked Example 2: A Bullish Shift on GBPUSD
Now run the mirror case, step by step, from spotting to exit. GBPUSD has trended down through the London session on the one-hour chart. The pair steps from 1.3510 to a base near 1.3402, printing lower highs at 1.3488 and 1.3452 on the way. Equal lows sit at 1.3402 — an obvious pool of sell stops.
First comes the raid. Price dips to 1.3396, sweeping those equal lows, and snaps back inside the range within a single candle. Then the shift fires: two expansive bullish candles drive through the 1.3452 lower high and close at 1.3467, leaving a gap between 1.3428 and 1.3439. The chart below shows this exact sequence with the sweep, the break, and the entry zone marked.
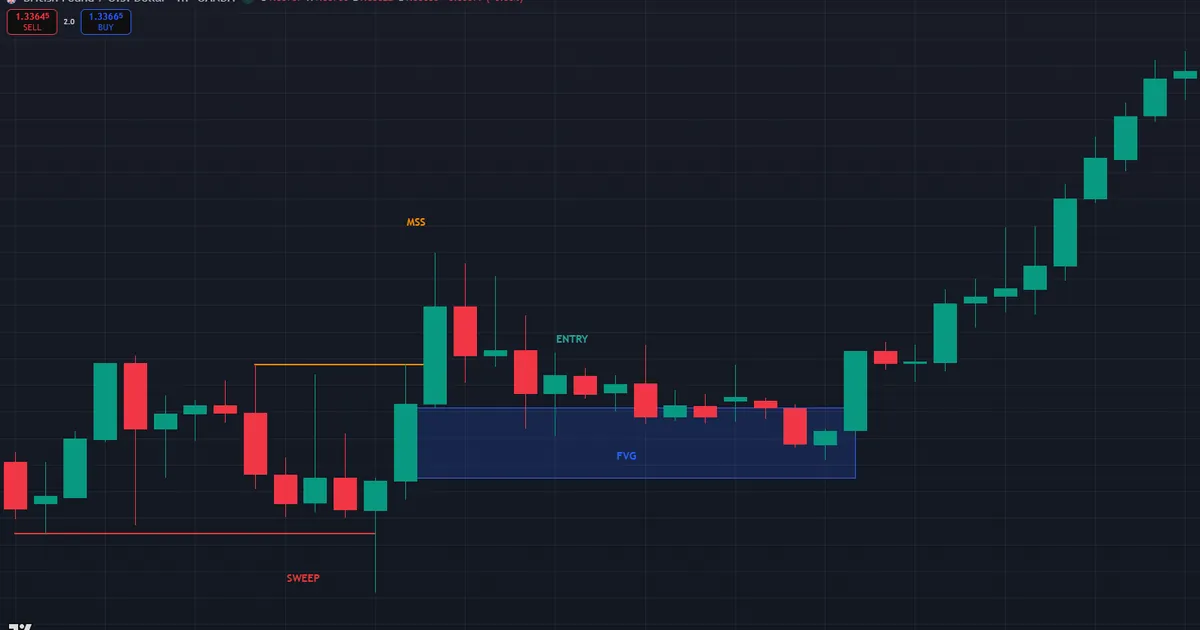
Now the trade builds itself. Price retraces into the 1.3428–1.3439 gap two hours later. A long inside the gap carries a stop under the 1.3396 sweep low — roughly 35 pips of risk. Meanwhile, the first target sits at the 1.3488 lower high, and the session high at 1.3510 waits beyond it. Notice that the sequence never changes: sweep, displacement through structure, retracement, entry. Only the direction flipped.
Download the complete indicator database
Put these concepts on your charts. One email unlocks the full library of 1,380+ indicators with compiled MT4 and MT5 files, plus my TradingView scripts. No paywall, no spam, unsubscribe any time.
Get free access to my indicator database
One email unlocks 1,380+ free MT4, MT5 and TradingView indicators — the complete library. No single-tool download; you get the whole database.
Common Mistakes and How to Fix Them
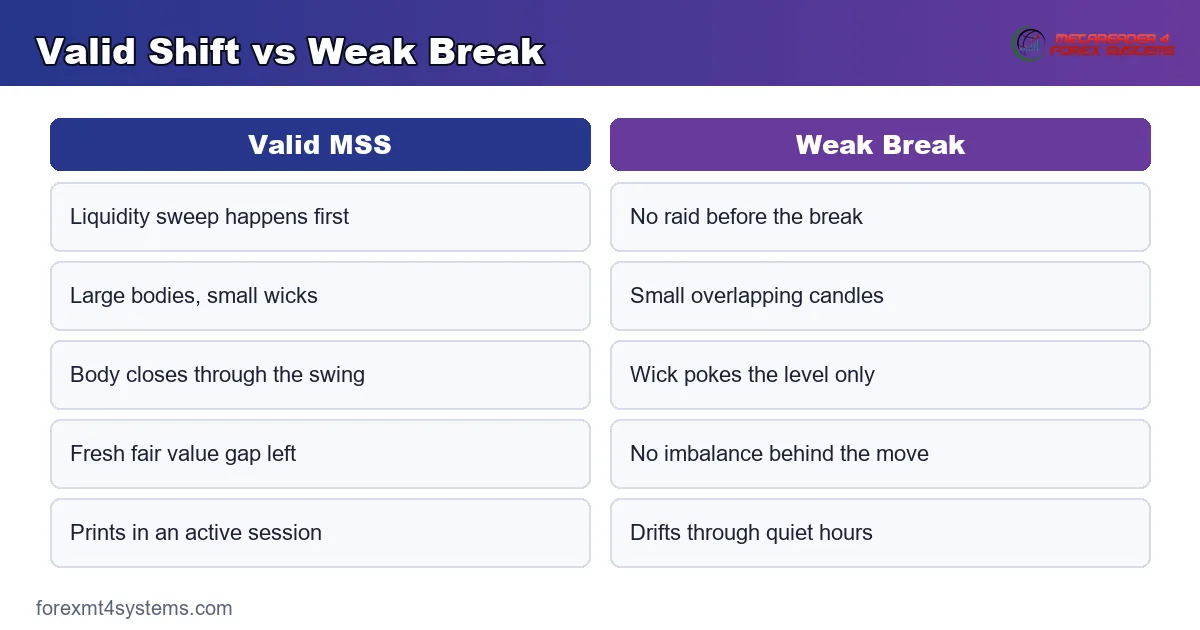
The concept is simple; the execution errors repeat. The graphic below collects the five traps we see most, and the fixes follow beneath it.
Trading every break as a shift
Minor internal wiggles break constantly, and none of them shift anything. So only mark the swing that produced the latest extreme, and demand displacement through it before you use the MSS label.
Chasing the displacement candle
Entry at the top of the leg means a wide stop at the worst available price. Instead, set an alert at the gap and let the retracement come to you.
Ignoring the higher timeframe
A five-minute shift against a strong daily trend usually delivers a shallow pullback, not a reversal. So check the daily draw on liquidity before you flip bias on any intraday break. A practical compromise exists for counter-trend shifts you cannot resist: halve the position size and take profit at the first liquidity pool instead of holding for a full reversal.
Accepting wick-only breaks
A wick through the level is a sweep — often the exact opposite signal. Demand at least one full candle body closing beyond the swing before counting the break.
Skipping the sweep requirement
A shift without a prior liquidity raid lacks fuel. Truly strong reversals start by taking stops first, so treat sweep-less shifts as second-class setups and size down accordingly.
Pre-Trade Checklist
Run this list before every entry. Ten seconds here saves hours of regret later.
- Higher-timeframe bias marked on the daily and four-hour charts.
- Liquidity sweep printed immediately before the break.
- The broken swing produced the latest meaningful extreme.
- At least one candle body closed beyond the level.
- Displacement left a visible fair value gap.
- An active session window — London or New York — is open.
- Entry planned inside the gap, stop beyond the sweep, target at the next liquidity pool.
Failure Walkthrough: When the Shift Breaks Down
Study the failure case as hard as the success case. Here is a common one. EURUSD prints a clean bearish shift on the fifteen-minute chart: sweep of a session high, displacement through the higher low, fresh gap left behind. Every checklist box ticks. Then the retracement arrives — and keeps going. Price climbs through the gap, closes above the broken swing, and finally runs through the sweep high itself. The chart below shows that unraveling, with the reclaimed level marked.
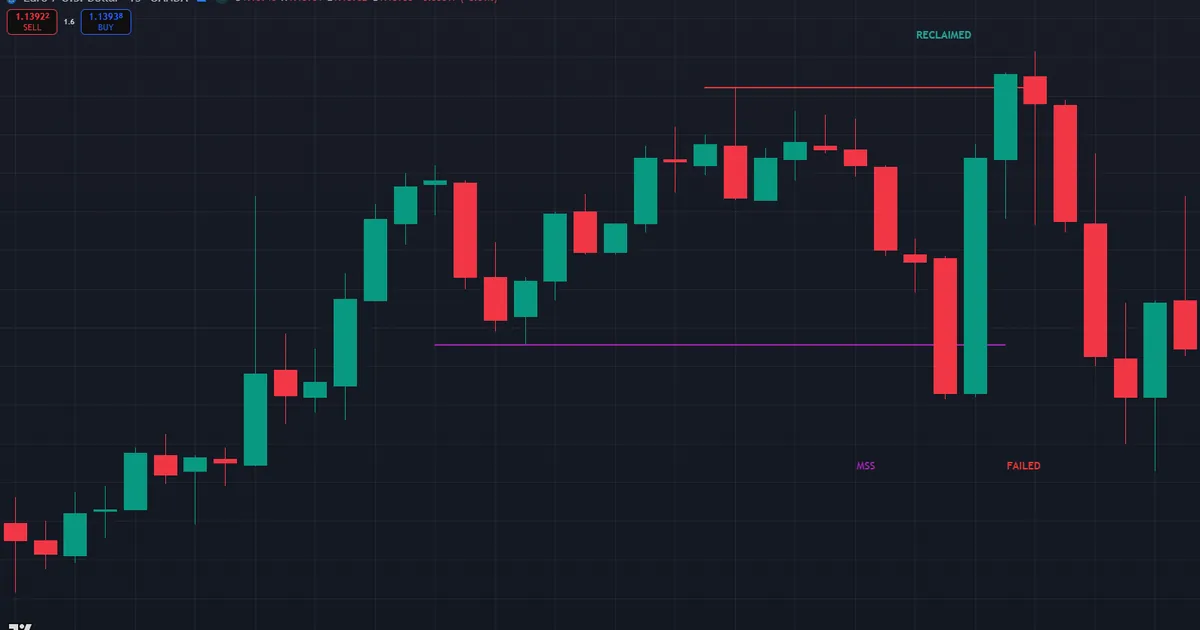
What went wrong? Usually the higher timeframe. In this case the daily chart still pointed up, and the intraday shift fought that flow. The market treated the whole bearish leg as a discount to buy, not a trend change. Hence the invalidation rule that contains the damage: once a candle body closes back above the broken swing point, the shift idea is dead. Exit at once, without debate and without widening the stop.
Then log the trade while the details stay fresh. Note the pair, the session, the higher-timeframe state, and which checklist items had ticked. Also record how far the retracement traveled before the reversal failed. Review a few dozen of these entries and a pattern usually appears: failed shifts cluster in ranging days, counter-trend contexts, and dead sessions. That written record turns each loss into tuition rather than pure cost. Useful journal fields for this specific setup: the body-to-average ratio of the breaking candle, the pip distance from sweep to break, and whether the gap survived first touch. Review those three columns monthly and your personal filter rules practically write themselves.
Limitations: When an MSS Fails
Be honest about the failure modes. First, ranging markets are the biggest one. In consolidation, price breaks swings in both directions all session, and every “shift” dies within a few candles. So if the daily chart shows a sideways box, stand down.
News is the second trap. Indeed, a CPI print or rate-decision candle can displace through any level, yet the move often fully reverses within the hour. So displacement caused by a scheduled release deserves extra suspicion until the market settles.
Third, counter-trend shifts against a strong higher-timeframe trend have poor follow-through. A five-minute MSS against a daily trend usually delivers a shallow pullback, not a reversal. Finally, structure mapping is partly subjective. Truly, two traders can mark different swing points on the same chart and reach different conclusions. So context, timing, and liquidity always outrank the label itself.
One more honesty note: no fixed success percentage exists for this pattern, and anyone quoting one is selling something. Outcomes depend on the trader’s swing selection, session filters, and discipline. Qualitatively, shifts that follow a sweep and align with higher-timeframe flow hold up far better than shifts missing either ingredient — that direction of effect is the only claim worth making.
Related Concepts to Study Next
The shift sits inside a web of sibling ideas, and two deserve your next reading hour. Inducement explains the engineered internal breaks that lure traders into bad entries before the true move; our guide to inducement in trading unpacks how to spot the bait. Meanwhile, the displacement and BOS material linked earlier covers the candle-quality and continuation sides of the same structure map. Master the trio — inducement, sweep, shift — and most SMC charts start reading like a sequence instead of noise. A sensible study order: first learn to mark clean swings, then practice spotting sweeps on replayed charts, and only then start grading shifts in live conditions with minimal size.
FAQ
What does MSS mean in trading?
MSS stands for market structure shift. Plainly, it describes a displacement-driven break of a meaningful swing point that flips directional bias — bearish to bullish or the reverse. The term comes from the ICT trading methodology.
Is an MSS the same as a CHoCH?
They overlap but are not identical. A change of character is any first counter-trend structure break, weak or strong. Instead, an MSS is stricter: it requires displacement through the swing point, usually with a fair value gap left behind.
Can a market structure shift happen without displacement?
By the strict ICT definition, no. Indeed, a slow, small-bodied break is just a technical break of a level, and such breaks fail frequently. Displacement is the evidence that institutional order flow drove the move.
What timeframe works best for spotting an MSS?
Most practitioners set bias on the daily and four-hour charts, then watch the one-minute to fifteen-minute charts for the actual shift. Still, lower timeframes produce more noise, so pair them with higher-timeframe context.
What invalidates a market structure shift?
A candle body closing back through the broken swing point cancels the shift. Also treat a full reclaim of the sweep extreme as final confirmation that the reversal attempt failed. Exit and reassess rather than arguing with the tape.
Should I enter immediately when an MSS prints?
Chasing the displacement candle gives you a poor price and a wide stop. Instead, most ICT traders wait for a retracement into the fair value gap or the 62–79% zone before entering. Also, manage risk on every trade. Results are not guaranteed; past performance is not indicative of future results.
External references
- For background on this concept, see Swing High at Investopedia.
- For broader market context, see Breakout on Wikipedia.

About the author
Written by Dominic Walsh, a Forex trader and MT4/MT5 indicator, Expert Advisor and script developer. Every tool on forexmt4systems.com is tested on live charts before release and ships with ready-to-use compiled MT4 (.ex4) and MT5 (.ex5) files. Learn more about the trader and developer behind this site.
How we build, test and correct every tool: Editorial & Testing Policy. Trading carries risk; see the disclaimer.