
The breaker block vs order block question comes down to one event: failure. An order block is an intact supply or demand zone expected to hold; a breaker is an order block that already broke and now works in reverse. So confusing the two means buying into resistance and selling into support. This guide gives you a decision table and a four-point checklist, and you will label each zone correctly in seconds.
Both concepts come from Michael Huddleston, the Inner Circle Trader (ICT). Indeed, they sit at the core of smart money concepts (SMC) trading, and each demands its own entry, stop, and invalidation plan. Neither label is official market terminology; both describe repeatable structure that ICT students trade with fixed rules.
The Short Answer
Trade an order block in the direction it was built: buy a demand block, sell a supply block. Instead, trade a breaker against its origin: a broken supply zone becomes a level to buy, and a broken demand zone becomes a level to sell. So the label decides trade direction before anything else. Everything else in this article, table included, exists to make that one call fast and repeatable.
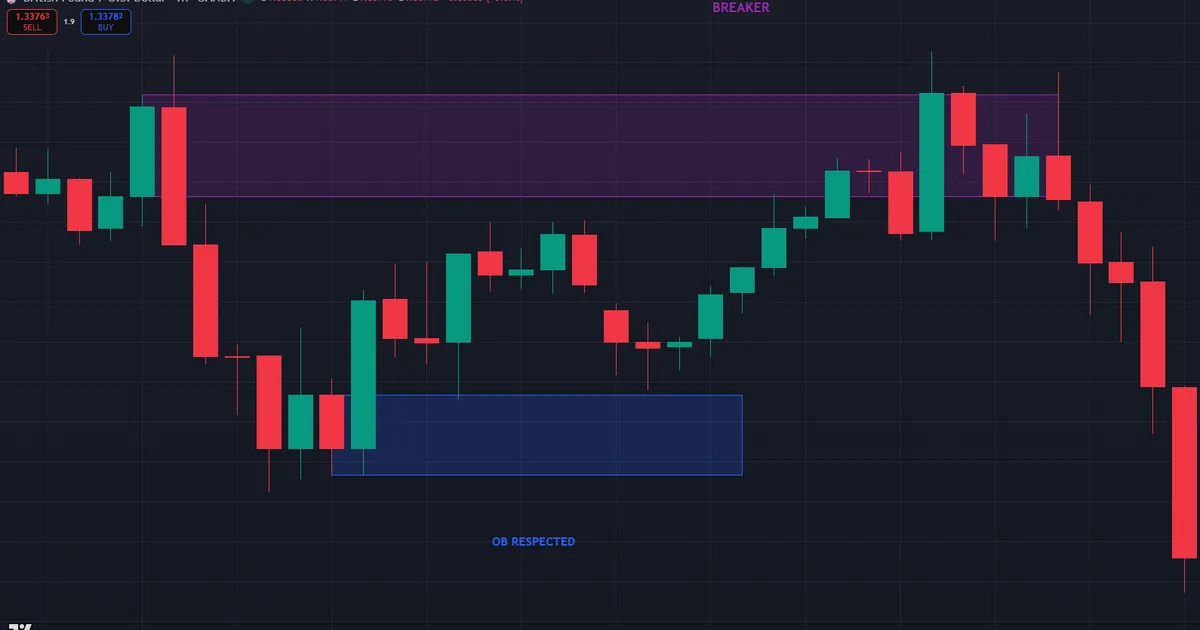
Why does the direction flip? An intact zone represents unfilled institutional interest, and price should reject from it. A broken zone represents trapped positions, and trapped positions unwind against their owners. Thus the same rectangle on your chart can mean opposite things a day apart, which is exactly why labeling comes before trading. The chart below shows both roles inside one GBPUSD one-hour frame. A demand block at 1.34283-1.34384 keeps its job: the pullback tags 1.34389, within a pip of the zone’s edge, and price lifts away. Higher up, the failed zone at 1.34632-1.34760 tells the other story, rejecting price after its polarity flipped.
What Each Zone Is
Order block, briefly
An order block is the last opposing candle before a displacement move: the final down candle before a rally, or the final up candle before a decline. ICT reads it as the footprint of institutional position building. Hence the zone often reacts on the first return. For marking rules, refinement, and entry models, see the full guide to order block trading.
Breaker block, briefly
A breaker is what an order block becomes after failing on the back of a liquidity sweep. First price raids the prior swing point, then it reverses and closes through the zone with displacement. Now old demand resists and old supply supports. The dedicated breaker block guide covers the formation and the retest entry model step by step.
The psychology behind each label
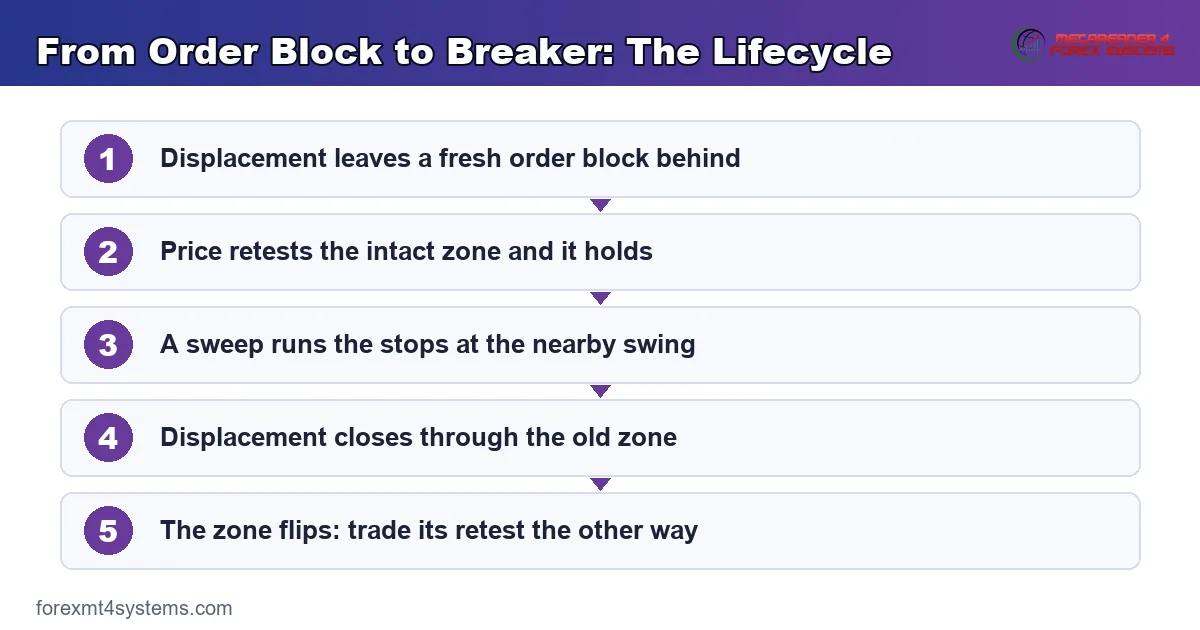
Each zone holds a different crowd. An intact demand block holds unfilled buy interest: the institutions that built longs there did not get their full size, so the retest lets them finish the job. A breaker holds regret instead. Traders who bought the broken demand zone sit trapped, and their exit selling on any bounce is what turns old support into resistance. Stops complete the picture, because the trapped side parks them just beyond the flipped zone, handing defenders extra fuel. So the practical read is simple: intact zones run on unfinished business, while flipped zones run on forced repair, and the two motives rarely mix at one level. The lifecycle graphic below shows how one turns into the other.
Breaker Block vs Order Block: Decision Table
Use the table as a fast reference; each row is a test you can apply to any zone on your chart. Then, once the rows feel familiar, the sweep test alone will settle most debates.
| Criterion | Order block | Breaker block |
|---|---|---|
| Formation | Last opposing candle before displacement; zone still intact | Order block that failed after a liquidity sweep |
| Polarity | Original: demand supports, supply resists | Flipped: old demand resists, old supply supports |
| Liquidity sweep | Not required | Required before the break |
| Trade direction | With the zone’s original direction | Against the zone’s original direction |
| Entry trigger | First retest of the intact zone | Retest of the flipped zone after the break of structure |
| Stop placement | Beyond the far side of the zone | Beyond the breaker, or beyond the sweep extreme |
| Invalidation | A clean close through the zone | A clean close back through the flipped zone |
| Best context | Fresh trends, first pullback | Reversals that follow a stop raid |
How to Tell Them Apart in Four Checks
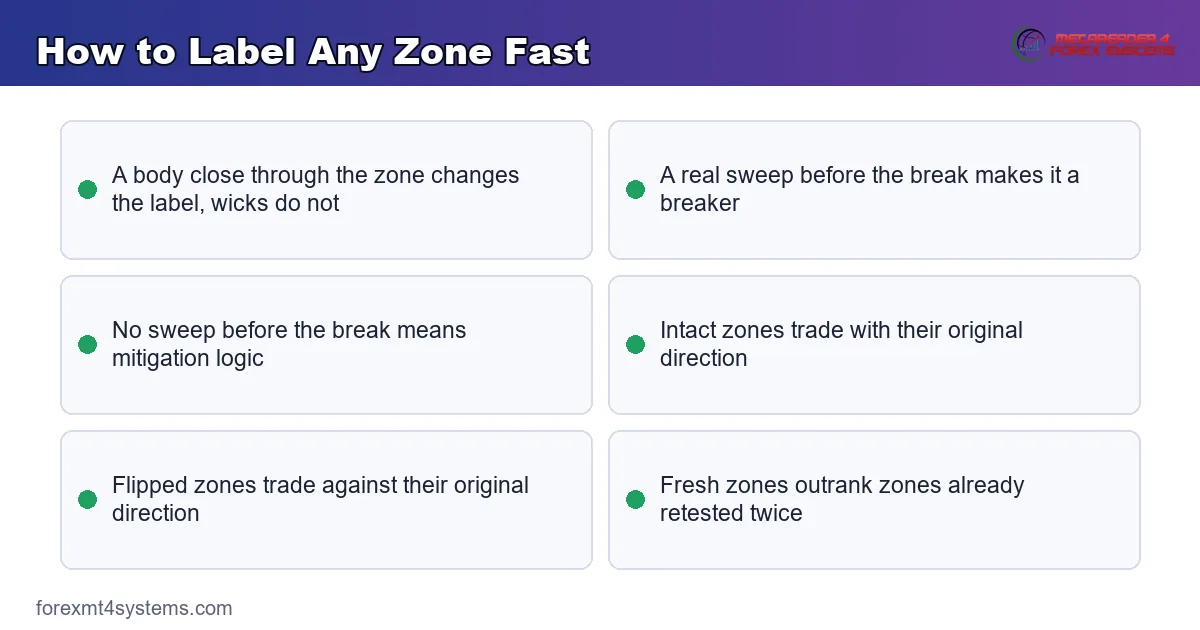
- Has price closed through the zone? No means order block. Yes means candidate breaker.
- Did the break follow a sweep of the prior swing? Yes confirms a breaker. No points to a mitigation block.
- Which way did displacement point? Trade with the displacement, never against it.
- Is the zone fresh? An untouched zone outranks one already retested twice.
Then log every zone you trade with its label. A tagged trade journal shows within thirty trades which zone type actually suits your market and session. Note the zone’s timeframe and session alongside the label, because those two columns usually explain the outcome.
When to Prefer Each Zone
Order blocks earn their keep in trending conditions. First pullbacks into a fresh demand block, in a market that just shifted structure upward, remain one of the cleanest continuation entries in SMC trading. Also, the zone gives an obvious invalidation: a close through the far side ends the idea. So trend traders lean on order blocks as their default. Session timing helps as well, since the first pullback of the London morning tends to respect fresh zones more than late New York drift does.
Breakers shine at turning points. Markets reverse hard after a stop raid, and the breaker is the first well-defined level the new move leaves behind. Hence reversal traders watch sweeps of obvious highs and lows, then stalk the flipped zone for the retest. Meanwhile, in quiet mid-range conditions neither zone performs well, and standing aside is usually the strongest play.
Many traders eventually run both, with a rule for each regime. In an established trend, they buy fresh demand blocks on the first pullback and ignore flips. After a clear raid of an obvious extreme, they switch modes and stalk the breaker instead. The regime call comes first every morning, so the two setups never compete for the same trade. Keeping the roles separate also keeps the statistics clean when review time comes.
Worked Contrast on EURUSD
Suppose EURUSD rallies from 1.0820 and leaves a demand block at 1.0834-1.0846, the last down candle before the leg to 1.0890. On the first pullback, a buyer rests a limit at 1.0846 with a stop below 1.0832. So far, this is the pure order block play: the zone is intact, and the trade follows its original direction. Nothing about the rectangle is special yet; it is simply the untested origin of displacement.
Now run the failure branch. Price spikes to 1.0895, sweeping the buy stops above the 1.0890 high, then displaces down through the demand band and settles near 1.0790. The old demand at 1.0834-1.0846 is now a bearish breaker. On the bounce into 1.0840, a seller enters with a stop above 1.0848 and targets the sell-side liquidity under 1.0780. Same coordinates, opposite trade. Thus one close through the zone, preceded by a sweep, changed everything about how to use it.
Management differs too. The breaker short banks half at 1.0800, moves the stop above the entry zone, and holds the rest for the 1.0780 pool. Hence even the exit plan depends on which label the zone carries.
Second Worked Example: One Zone, Two Trades on USDJPY
The full lifecycle fits in a single week of USDJPY. Price falls from 156.90 and leaves a supply block at 156.40-156.62, the last up-close candle before the drop to 155.80. Two sessions later, the first retest arrives at 156.45. The zone is intact, so the label says supply and the trade is a short. A seller entering there with a stop at 156.70 watches price roll over to 156.00, and the order block does exactly what its label promised.
Then the market changes its mind. During the New York morning, price dives to 155.68, sweeping the sell stops under the 155.80 low, and reverses with force. One displacement candle closes at 156.85, straight through the old supply band. Run the four checks: the zone broke, a sweep preceded the break, displacement points up, and the flipped zone is untouched. Every answer says bullish breaker.
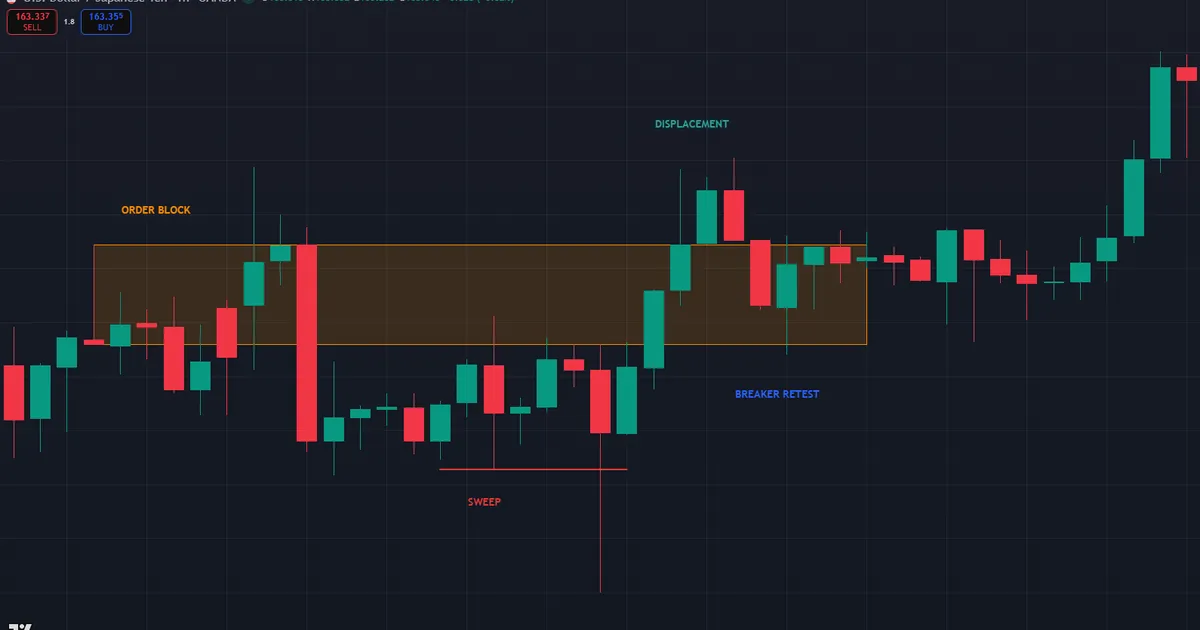
The second trade uses the same rectangle in reverse. Price eases back to 156.55, inside the old supply, and a long entry there carries a stop at 156.30, below the breaker low, for twenty-five pips of risk. Target logic looks up at the buy-side pool near 157.40, where equal highs rest above the prior week’s range. Notice what changed between the two trades: not the zone, only its history. That is the entire subject of this article compressed into one chart, and it is worth replaying on your own charts until the switch feels obvious.
Where the Labels Sit in the SMC Workflow
Labeling is stage two of a four-stage routine, not the whole job. The sequence runs: higher-timeframe context first, then points of interest, then lower-timeframe confirmation, then entry. On the daily and four-hour charts, define the trend and the liquidity pool price is drawing toward. Next, mark candidate zones along that path and label each one honestly: order block, breaker, or neither. Only after price reaches a labeled zone does the five- or fifteen-minute chart get a vote, and only its structure shift triggers the order.
Pairing timeframes and sessions
Most SMC traders split the work across two timeframes. The four-hour or one-hour chart supplies the zone, the direction, and the target; the five- or fifteen-minute chart supplies the trigger and the stop. Session timing then filters the calendar. The London kill zone runs roughly 2:00-5:00 a.m. New York time, and the New York kill zone spans about 7:00-10:00 a.m. Retests that arrive inside those windows meet real volume, so reactions are decisive either way. A retest in the Asian drift, by contrast, often produces the slow, sticky touch that precedes failure.
Download the complete indicator database
Put these concepts on your charts. One email unlocks the full library of 1,380+ indicators with compiled MT4 and MT5 files, plus my TradingView scripts. No paywall, no spam, unsubscribe any time.
Get free access to my indicator database
One email unlocks 1,380+ free MT4, MT5 and TradingView indicators — the complete library. No single-tool download; you get the whole database.
A day in the routine
Put together, the routine takes minutes, not hours. Before London opens, refresh the daily draw and relabel every zone on the four-hour and one-hour charts, deleting anything spent. During the London kill zone, watch only the zones that sit on the path to the draw. When price tags one, drop to the five-minute chart and demand a structure shift before entry. Through the New York morning, the same map stays live, and afternoon setups get skipped unless the day’s range is still unfinished. Repetition builds the labeling reflex faster than any amount of theory, because the market grades every call within hours.
What About the Mitigation Block?
A third label completes the family. Recall that a failed order block only earns the breaker name when the failure followed a liquidity sweep. Instead, when price reverses without raiding the prior swing, leaving a higher low or a lower high, the flipped zone is a mitigation block. Entry logic stays similar. Yet the missing sweep removes the trapped-trader fuel, so many traders grade these zones a notch weaker, with softer follow-through on average.
Keeping the three labels straight by hand takes screen time. Meanwhile, our Order Block Mitigation Profiler for TradingView tags intact, mitigated, and broken zones automatically, and the wider shelf of smart money indicators covers the surrounding workflow on MT4 and MT5.
Common Labeling Mistakes
Mislabels cost more than missed trades, because they put real money on the wrong side of a level. These six errors cover most of the damage.
- Calling a wick through the zone a break. Only a candle body closing through flips the label. Correction: wait for the close before relabeling anything.
- Accepting a wick-tip sweep as a real raid. A one-pip probe rarely traps anyone. Correction: prefer sweeps that clearly clear the swing and reverse with displacement.
- Trading a breaker in the order block direction. The flip reverses the trade, not just the name. Correction: say the direction out loud before the order goes in.
- Marking zones from mid-range candles. Without displacement after it, the candle is furniture. Correction: only label candles that launched a real move.
- Keeping dead zones on the chart. A level broken twice in both directions means nothing. Correction: delete spent zones weekly so labels stay readable.
- Skipping the mitigation check. A flip without a sweep is a weaker animal. Correction: run check two every time, not just when it is convenient.
The card below compresses the labeling routine into four questions you can answer on any chart in under a minute.
Quick Labeling Checklist
Before trading any rectangle on your chart, walk this list from top to bottom.
- Did displacement follow the candle when the zone first formed?
- Has any candle body closed through the zone since then?
- If it broke: did a sweep of the prior swing come first?
- Which way does the resulting label say to trade?
- Is the zone fresh, or already tested since the label changed?
- Does that direction agree with the daily draw on liquidity?
- Is the retest due inside a London or New York kill zone?
Run the checklist as a strict gate, not a mood board. Six clean answers plus one shrug equals a skipped trade, because the shrugged item is usually where the loss hides. Reading each line aloud sounds excessive until it saves the first mislabeled entry; after that, it feels cheap. Over a month of sessions, the list also builds a private data set, since every skipped setup you note becomes evidence about which checks matter most in your market.
Related Concepts Worth Mastering
Two sibling comparisons round out the zone family. The gap-versus-origin decision gets the same treatment in fair value gap vs order block, which matters because gaps and blocks often stack at the same price. The sweep test at the heart of check two rests on buy side and sell side liquidity, and that guide maps where the resting stops actually sit. Learn the liquidity map first, because every label in this article depends on reading sweeps correctly. Then take the comparisons in pairs: study one, tag ten live examples on your own charts, and only then move to the next. Concepts anchored to marked-up charts survive pressure; concepts read once in an article rarely do.
Limitations of Both Zones
Neither zone is self-sufficient. Order blocks fail routinely in ranging conditions, and the first pullback in a weak trend often slices straight through the level. Meanwhile, breakers inherit those problems and add one more: the flip only matters when the break was genuine, and choppy markets print false breaks constantly. Hence a stack of conflicting zones in mid-range is a signal to stand aside, not an invitation to pick a favorite. Equally, a zone that triggered once and got stopped rarely deserves a second chance the same day.
Context outweighs the label. Higher-timeframe bias, session timing, and displacement quality decide more than the zone type does. Also remember that scheduled news can void either zone in one candle. No dependable figure exists for how often each zone holds, and any source quoting one deserves suspicion, because the outcome shifts with market, session, and selection skill. Truly, both patterns are context tools that frame risk, never standalone signals. A journal habit closes the loop, because your own data shows which zone earns a place in your plan.
A failure walkthrough: the false breaker
The most instructive failure is the mislabeled one. EURUSD dips one pip under a swing low, wick only, then closes through a demand block above. A trader calls it a breaker: sweep, break, flip. Yet the raid trapped almost nobody, because a one-pip wick fills few stops. The retest tells the truth. Price returns to the flipped zone, hesitates, and instead of rejecting, an hourly candle closes back through it. The next leg runs against the trade until the stop ends it.
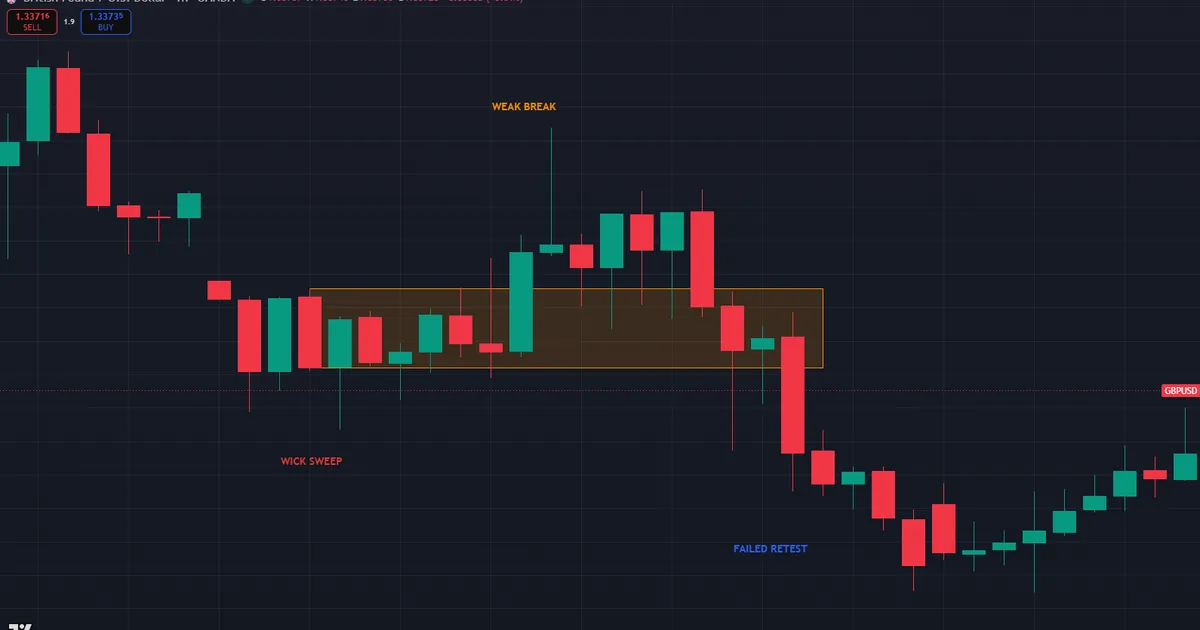
As always, one decisive close back through the flipped zone kills the idea. The deeper lesson sits in the label. A shallow wick sweep produced a low-quality breaker, and the market graded it accordingly. Log the failure with its cause, note the sweep depth in pips, and set a personal minimum before the next trade. Ten such entries in a journal quietly build the judgment this comparison exists to teach.
FAQ
Which is stronger, a breaker block or an order block?
Neither wins universally. A fresh order block aligned with a new trend is hard to beat, while a breaker shines after a stop raid reverses the market. So strength comes from context, freshness, and displacement, not from the label itself.
Can an order block become a breaker block?
Yes, and that is the exact lifecycle. An order block that fails after a liquidity sweep, with price closing through it, becomes a breaker. Then the same zone trades in the opposite direction on the retest.
What is a failed order block called?
It depends on the failure. If price swept the prior swing point before breaking the zone, the result is a breaker block. Instead, if the reversal came without a sweep, the flipped zone is a mitigation block.
Do both zones work on the same timeframes?
Yes. Both appear from the one-minute chart to the daily. Still, most ICT traders mark zones on the one-hour or four-hour chart and execute on a five-minute chart during a kill zone. Higher-timeframe zones carry more weight in a conflict.
How many times can a breaker block be retested?
There is no fixed number, but quality decays with each touch. The first retest meets the most trapped positions and resting interest, so it tends to react best. After two or three touches, treat the zone as spent.
Can I trade breakers and order blocks together in one plan?
Yes, and many traders do exactly that: order blocks for trend continuation, breakers for post-sweep reversals. Also backtest each role separately, so you know how each behaves in your market. Results are not guaranteed; past performance is not indicative of future results.
External references
- For background on this concept, see Stop Hunting at Investopedia.
- For broader market context, see Breakout at BabyPips.

About the author
Written by Dominic Walsh, a Forex trader and MT4/MT5 indicator, Expert Advisor and script developer. Every tool on forexmt4systems.com is tested on live charts before release and ships with ready-to-use compiled MT4 (.ex4) and MT5 (.ex5) files. Learn more about the trader and developer behind this site.
How we build, test and correct every tool: Editorial & Testing Policy. Trading carries risk; see the disclaimer.