
A mitigation block is a failed order block that price breaks without first sweeping the prior swing point. Indeed, that missing sweep is the whole story, because it separates the pattern from its louder cousin, the breaker. After this guide you will identify the block, understand why institutions defend it, and trade the retest with defined risk.
The term comes from Michael Huddleston, the Inner Circle Trader (ICT). “Mitigation” describes what smart money does at the zone: offset losing positions from a trade that went wrong. So the retest is not random. Indeed, it is where earlier sellers or buyers escape near break-even, and their exit orders reinforce the level.
What Is a Mitigation Block?
Begin with the parent zone. An order block is the last opposing candle before a displacement move; the full guide to order block trading explains how to mark one. Next, picture that zone failing. Price closes through it with conviction, and the level flips polarity: old supply becomes support, and old demand becomes resistance. That flipped zone is the mitigation block.
Structure defines the bullish case. First, price sets a swing low and rallies to a short-term high. Then it retraces but bottoms at a higher low, never trading through the original low. Next, it rallies again and closes above the short-term high with displacement. The down-close candle at that high, the old bearish order block, is now a bullish mitigation block. So on the retest it should act as support. Invert every step for the bearish version.
Whose orders defend the zone
Why “mitigation”? Traders who sold at the swing high sit underwater once price breaks above it. When price dips back into their entry zone, many exit near break-even to limit the damage; they mitigate the loss. Thus their exits are buy orders, and that flow strengthens the zone as support, one break-even escape at a time. A second group joins them: the institutions that drove the displacement often have unfilled interest at the origin, and the retest lets them add at the price they already proved they like. Neither group needs the market to be kind. Both simply act at the one level where their books demand it, which is why the reaction repeats across markets and timeframes rather than depending on anyone’s goodwill.
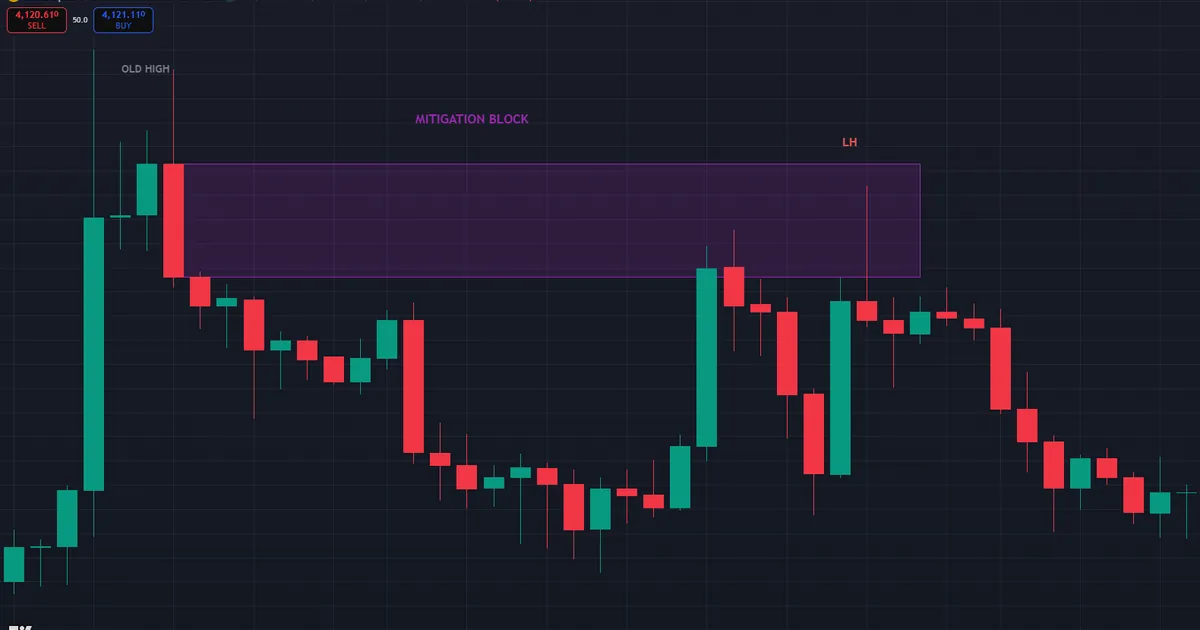
The bearish case runs the same logic upside down, and the chart below shows it on gold. XAUUSD prints an old high at 4,104.05 on the one-hour chart, then breaks down with displacement. The corrective rally stalls at 4,074.2, far short of that extreme, so no sweep occurs. Hence the up-close zone at 4,066.4-4,085.2 becomes a bearish mitigation block, and the retest into it rejects hard, sending price down to 4,024.
Mitigation Block vs Breaker Block: The Sweep Decides
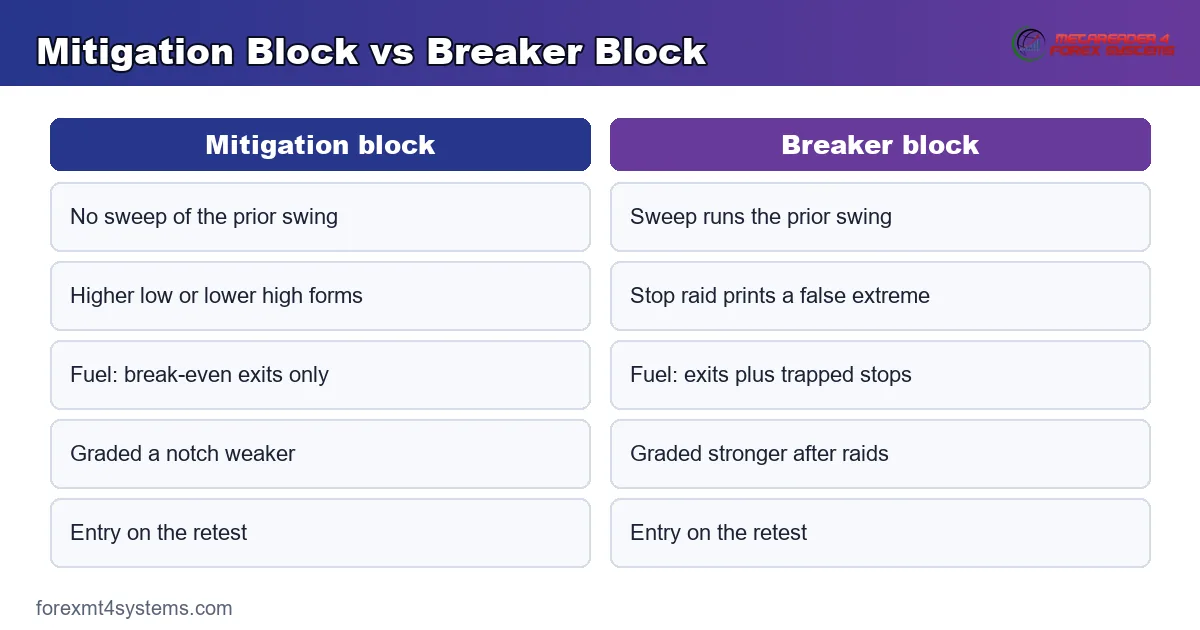
The two patterns look nearly identical, and the confusion is understandable. Both start as an order block that fails. Each flips polarity, and each trades on the retest. Yet one detail separates them: what price does at the prior swing before reversing.
A breaker block requires a liquidity sweep. Price trades through the old swing low or high, triggers the resting stops, and only then reverses. Instead, a mitigation block skips that raid. Price turns early, leaving a higher low or a lower high, and the swing point survives untouched. Hence the breaker carries a trapped-trader element the mitigation block lacks, which is why many ICT traders rank breakers slightly higher in strength.
The distinction carries practical weight beyond naming. Because the mitigation flip lacks stop-run fuel, its retest reaction tends to be slower and shallower, so confirmation entries earn their keep here more than anywhere else. Expectations should shrink too. A breaker retest often snaps away from the zone within a candle or two, while a mitigation retest may need several probes before committing. Neither behavior is a flaw; each simply reflects how much forced order flow the level holds. The graphic below puts the two side by side for quick reference.
How to Identify and Trade a Mitigation Block
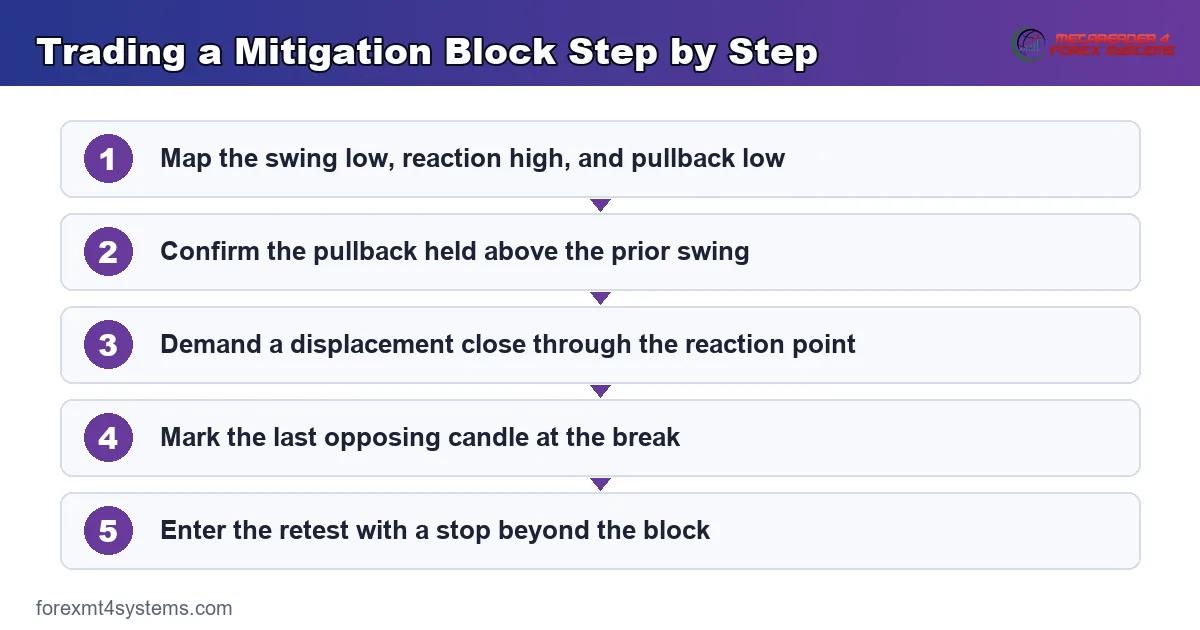
Marking the zone takes seven steps for the bullish case. Then simply mirror each one for shorts.
- Map the swings. Mark the swing low, the reaction high, and the pullback low.
- Check the pullback. It must hold above the prior swing low, because a sweep converts the setup into a breaker.
- Confirm displacement. Price must close through the reaction high on strong-bodied candles, shifting structure.
- Outline the block. Mark the last down-close candle at the broken high, from its high to its low.
- Wait for the return. Then enter on the retest with a limit order, or drop to a lower timeframe for confirmation.
- Define risk. Place the stop below the block, and size the trade before entry; our position size calculator does the math from stop distance.
- Target liquidity. Aim at the next resting pool, such as equal highs or a previous session high.
Grading the zone before you trade it
Not every mitigation block deserves an order. First, grade the displacement: the break of the reaction high should travel farther and faster than the pullback that preceded it. Second, check freshness. An unmitigated order block is a zone price has never revisited since it formed, and first touches tend to produce the strongest reaction because the resting interest remains intact. Once price has traded through a zone two or three times, treat it as spent. Also, prefer zones sitting at or below the midpoint of the dealing range for longs, since a discount entry aligns with how ICT frames value. A quick pre-trade note in your journal, recording the grade and the outcome, turns these judgments into data you can audit later.
Entry confirmation on the lower timeframe
Limit orders inside the zone work, but confirmation entries survive more traps. Drop to the five-minute chart once price tags the block. Then wait for two things: a sharp rejection wick and a close back above the zone’s midpoint. Also watch how fast price leaves, because a slow grind back into the block usually precedes a clean break of it. Meanwhile, a small structure shift on the five-minute chart, such as a minor lower high breaking upward, adds real evidence that buyers are active where they should be. This approach sacrifices entry price for information. Still, most traders find the trade-off worth it after one losing streak of blind limits.
Worked Example on GBPUSD
Take GBPUSD on the one-hour chart. Price bases at 1.2640 and climbs to 1.2695 before stalling. Next, the pullback finds buyers at 1.2658, a clear higher low sitting eighteen pips above the prior swing. No sweep occurs. Then two strong candles push price through 1.2695 and on to 1.2730 during the London morning. London volume gives the move its push, which is typical for GBPUSD.
Now mark the zone. The last down-close candle under the 1.2695 high spans 1.2680 to 1.2696. At 10:00 a.m. New York time, price fades back into that band and prints 1.2688. A long from there carries a stop at 1.2674, below the block, for fourteen pips of risk. Meanwhile, the objective is the buy-side liquidity above 1.2750, where an old daily high rests. Price lifts from the band within three candles and prints 1.2721 by lunchtime, one push short of the target. Management then matters as much as entry: half off at 1.2730, stop to break-even, and the rest left for the daily high. When a block gives way instead, the setup is simply invalid, and the stop does its job.
Record the trade either way. Note the grade you gave the zone, the session, the entry style, and how far price penetrated the band before reacting. Thirty such records tell you more about your own edge with this pattern than any tutorial can, because they measure your selection, not someone else’s examples. Patterns in the losses usually surface first, and those patterns become rules.
Second Worked Example: A Bearish Block on EURUSD
Now walk the short side from spotting to exit, because the bearish sequence deserves its own rehearsal. EURUSD tops at 1.0910 on the one-hour chart and slides to a swing low at 1.0872. The bounce that follows is weak. It stalls at 1.0896, a lower high sitting fourteen pips beneath the old top, so the 1.0910 extreme survives untouched. Then displacement arrives: two heavy candles close through 1.0872 and drive price to 1.0840 during the New York morning.
Next, outline the block. The last up-close candle at the 1.0896 lower high spans 1.0884 to 1.0898, and that band becomes the bearish mitigation block. Sellers who missed the drop now want the retest as much as the trapped buyers want their exit, and both groups point the same way.
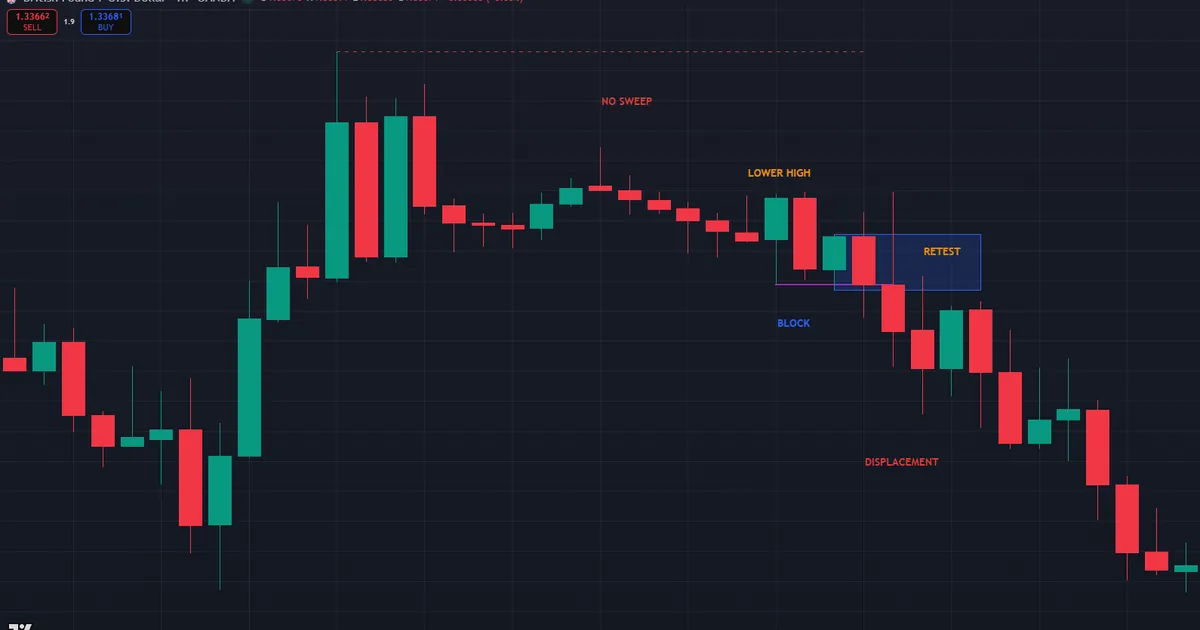
The retest comes three hours later at 1.0890, inside the band. A short from there carries a stop at 1.0904, above the block yet below the 1.0910 extreme, for fourteen pips of risk. Target logic looks down at the sell-side pool near 1.0800, where an old weekly low anchors resting orders. So the plan risks fourteen pips toward a pool ninety pips away, with half banked at 1.0840, the prior displacement low. Every decision maps to structure: the lower high proves the label, the block defines entry and stop, and the liquidity below defines the exit.
Where the Pattern Sits in the ICT Toolkit
ICT groups its tradable zones under one umbrella; see the guide to ICT PD arrays for the full map. Mitigation blocks sit alongside order blocks, breakers, and fair value gaps in that hierarchy. First comes bias: read the daily chart and define the draw on liquidity. Then hunt the block in the direction of that draw. A mitigation block that agrees with the daily draw is a trade; one that fights it is a statistic.
Position in the sequence matters as much as the zone itself. The higher timeframe supplies context, the block supplies the point of interest, and the lower timeframe supplies confirmation. Skipping a stage is how most bad entries happen. For example, a trader who spots a clean one-hour block but never checks the daily draw is trading a location without a direction. Meanwhile, a trader with perfect bias who enters on the first touch, without any lower-timeframe evidence, is trading a direction without a trigger. The sequence exists because each layer filters the one below it.
Download the complete indicator database
Put these concepts on your charts. One email unlocks the full library of 1,380+ indicators with compiled MT4 and MT5 files, plus my TradingView scripts. No paywall, no spam, unsubscribe any time.
Get free access to my indicator database
One email unlocks 1,380+ free MT4, MT5 and TradingView indicators — the complete library. No single-tool download; you get the whole database.
Timeframes and session timing
The workflow pairs timeframes deliberately. Mark the block on the four-hour or one-hour chart, where structure is trustworthy, then trigger on the five- or fifteen-minute chart, where the stop is tight. The higher timeframe answers where and which way; the lower one answers when. Timing follows the sessions. The London kill zone spans roughly 2:00-5:00 a.m. New York time, and the New York kill zone runs about 7:00-10:00 a.m. Most traders wait for those windows before acting on a retest, because zone reactions outside them tend to drift instead of reject. A retest that lands mid-Asia is usually a level to watch, not a level to trade.
Automation and discretion
Software can carry the marking workload. Meanwhile, discretion still decides which zones matter. Our Mitigation Block Sentinel for TradingView flags the higher-low structure and outlines the flipped zone automatically, and the broader set of ICT indicators for MT4 and MT5 covers the rest of the stack.
Common Mitigation Block Mistakes
The same handful of errors drains most accounts that trade this pattern. Each has a plain correction.
- Mislabeling a breaker as a mitigation block. If the prior swing got swept, the label changes. Correction: check the extreme first, every time.
- Trading a drifting break. A slow, overlapping push through the reaction high is not displacement. Correction: demand fast, full-bodied closes or skip the zone.
- Using a stale zone. A block already retested twice has spent its resting interest. Correction: prioritize first touches and drop spent zones from the chart.
- Setting the stop inside the band. Normal penetration tags it before any reaction. Correction: place the stop beyond the block with room for a wick.
- Ignoring the dealing range. Buying a block high in premium fights how value works. Correction: take longs from discount and shorts from premium.
- Trading against the daily draw. A perfect block against the higher-timeframe magnet still fails often. Correction: align every retest with the daily bias.
One theme repeats: each mistake deletes a structural requirement and keeps the entry anyway. The card below lists the requirements the right way around.
Quick Pre-Trade Checklist
Run this list before resting any order at a mitigation block. A single failed line means the setup is incomplete.
- Did the pullback hold the prior swing, with no sweep?
- Did displacement close through the reaction point with conviction?
- Is the marked candle the last opposing close at the break?
- Is this the zone’s first retest since it formed?
- Does the trade sit on the right side of the dealing range?
- Does the direction agree with the daily draw on liquidity?
- Is the retest arriving inside a London or New York kill zone?
- Is the stop beyond the block and the size fixed in advance?
Treat the list as binary, not advisory. Seven yes answers out of eight is a skipped trade, because the missing item is usually the one the market punishes. Keep the checklist physically visible during sessions, and answer each line out loud before touching the order ticket. The habit feels slow for a week, then becomes automatic, and it removes more weak entries than any extra indicator on the chart ever will.
Related Concepts Worth Mastering
Two sibling ideas sharpen every judgment this pattern demands. The dealing-range logic behind discount longs and premium shorts comes from premium and discount pricing, and that guide shows how to split any range into value zones. The speed test behind a valid break comes from displacement in trading, which explains how to tell institutional urgency from drift. Master both and the mitigation block stops being a shape; it becomes a location where value, urgency, and obligation meet.
Reading order matters less than repetition. Study one concept, then return to live charts and tag ten examples before touching the next idea. Concepts learned in isolation blur together within a week, while concepts anchored to marked-up charts stay usable under pressure. The tagging habit also feeds the journal, so every study session doubles as data collection for your own statistics.
Limitations You Must Respect
The pattern has real weaknesses. Without a sweep, the reversal lacks the trapped-trader fuel that powers a breaker, so follow-through is often softer. Meanwhile, ranging markets produce failed mitigation blocks in clusters, one canceling the next. Also, a higher low alone proves very little; plenty of higher lows break five bars later.
Context is the filter. Demand real displacement, not a drifting break, and skip any zone that fights the higher-timeframe trend. Still, expect regular failures even with every box ticked. No honest figure exists for how often the pattern holds, because the answer moves with market, session, and the trader’s own selection skill. Truly, the model manages risk around a contextual edge; it never removes losing trades. Scheduled news can void any block within seconds, so know the calendar before you rest a limit order inside one. Spreads widen at session opens too, and a wide spread can tag a tight stop that clean mid-session pricing would have spared.
A failure walkthrough on GBPUSD
Watch how a failure actually unfolds. GBPUSD builds a bullish mitigation block at 1.2712-1.2726 after a higher low and a decent break of structure. The retest starts well: price dips in, lifts eight pips, and looks defended. Then the character changes. Instead of leaving the zone, price grinds sideways along its upper edge, returns, and spends four hours inside the band. Each bounce is smaller than the last. Finally, an hourly candle closes at 1.2704, fully through the block, and the next leg runs twenty pips lower before pausing.
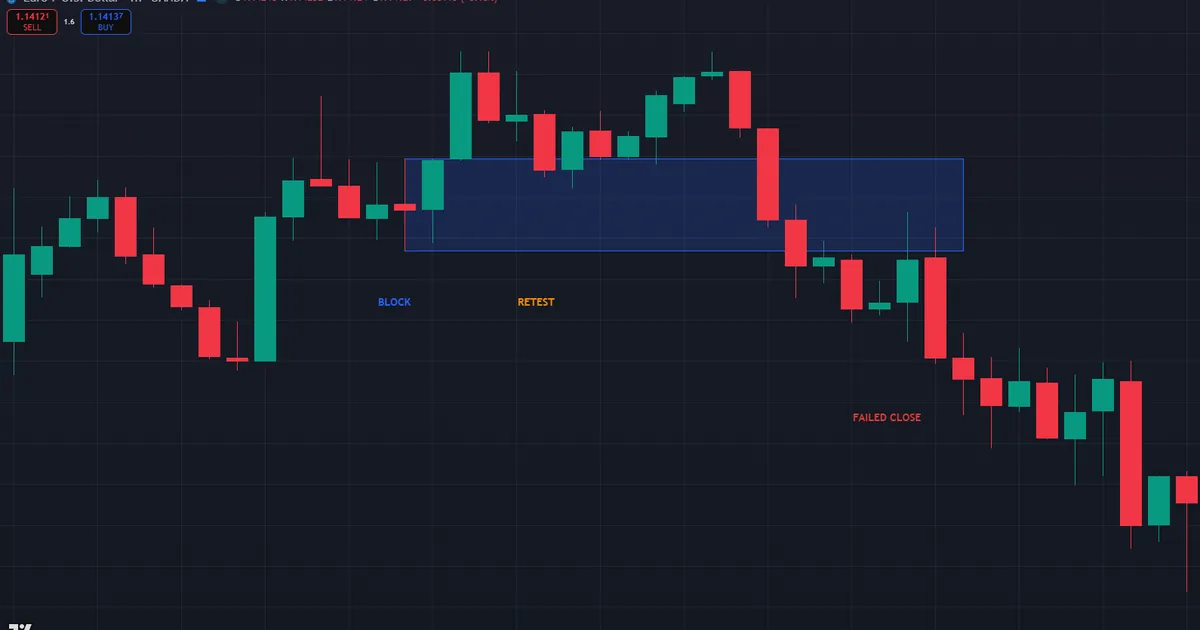
The invalidation rule contains the damage: one decisive close through the flipped zone ends the idea, even if the stop has not hit yet. The slow grind was the early warning, since defended zones reject quickly. Afterwards, log three facts: how long price sat inside the block, which session hosted the retest, and whether the daily draw agreed with the trade. Failed blocks recorded this way stop being painful surprises. Rather, they become the filter that keeps the next weak zone off your chart.
FAQ
What does a mitigation block mean in ICT trading?
It is a failed order block that price broke without sweeping the prior swing point. The zone flips polarity, and traders look for entries on the retest. Plainly, the name refers to smart money mitigating, or offsetting, losing positions at the zone.
What is the difference between a mitigation block and a breaker block?
The liquidity sweep. A breaker forms after price raids the prior swing low or high; a mitigation block forms when price reverses early and leaves that swing intact. Still, marking and trading the two zones is close to identical.
What is an unmitigated order block?
It is a zone price has not revisited since it formed. Its resting interest is still intact, so the first retest tends to be the most reactive. Then each additional touch consumes more of that interest.
How do I mark a bearish mitigation block?
Find a swing high, a pullback low, and a weaker rally that tops below the old high. After displacement closes through the pullback low, outline the last up-close candle at that lower high. That band becomes resistance on the retest.
Do mitigation blocks appear on all markets and timeframes?
Yes. The structure shows up in forex, indices, gold, and crypto on any timeframe. Also, liquid markets and higher timeframes tend to respect the zones more cleanly, while thin markets produce noisier structure.
Can I trade mitigation blocks without other confirmation?
You can, but the failure rate rises sharply. Yet displacement quality, higher-timeframe bias, and session timing filter out most weak zones. Results are not guaranteed; past performance is not indicative of future results.
External references
- For background on this concept, see Smart Money at Investopedia.
- For broader market context, see Position on Wikipedia.

About the author
Written by Dominic Walsh, a Forex trader and MT4/MT5 indicator, Expert Advisor and script developer. Every tool on forexmt4systems.com is tested on live charts before release and ships with ready-to-use compiled MT4 (.ex4) and MT5 (.ex5) files. Learn more about the trader and developer behind this site.
How we build, test and correct every tool: Editorial & Testing Policy. Trading carries risk; see the disclaimer.