
Premium and discount in trading describe the two halves of a dealing range: everything above the 50 percent midpoint is premium, and everything below it is discount. Michael Huddleston, the Inner Circle Trader (ICT), builds a simple rule on that split — buy only in discount, sell only in premium. After this guide you will draw the range correctly, place the equilibrium line with a Fibonacci tool, and use both to filter every entry you take.
So the concept is really about price paid, not patterns. Institutions hunt good prices the way any large buyer does, and this framework defines “good” objectively.
What Premium and Discount in Trading Actually Mean
A dealing range is the distance between a meaningful swing low and a meaningful swing high. Split that distance in half and you get equilibrium — fair value for the current range. Above equilibrium, buyers pay more than fair value, so price trades at a premium. Below it, sellers accept less than fair value, so price trades at a discount. Hence ICT’s claim is behavioral: institutional buying concentrates in discount, and institutional selling concentrates in premium, because size demands value.
Meanwhile, retail habit runs the other way — buying breakouts near highs and selling panics near lows. The split exists to break that habit.
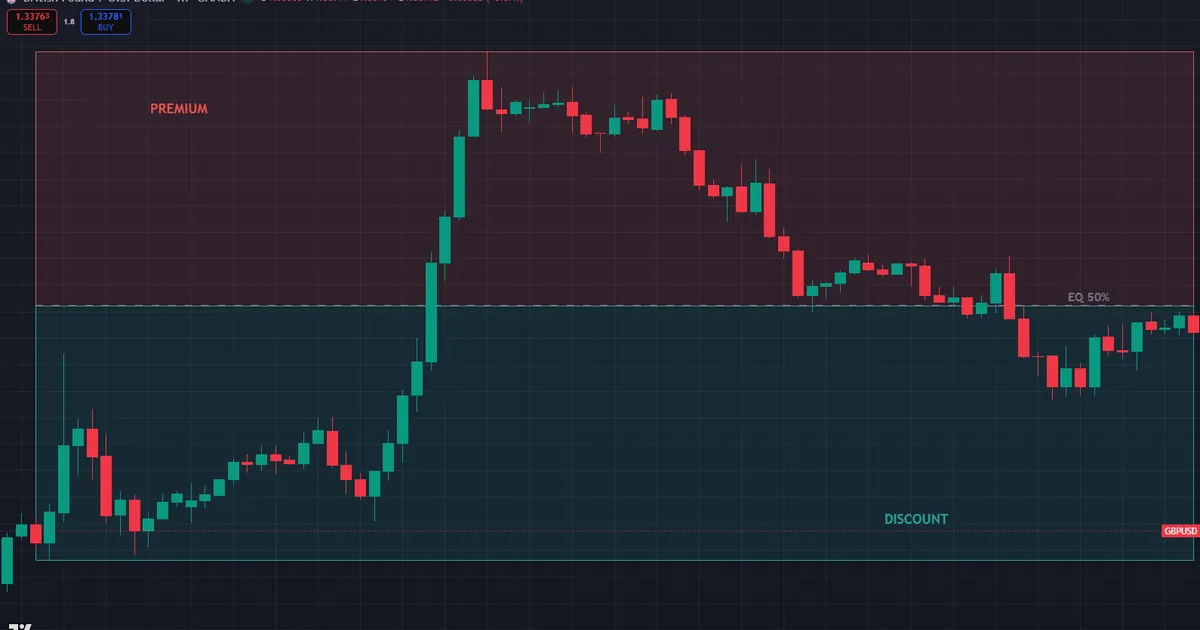
On the chart below, a GBPUSD 1-hour dealing range runs from a low at 1.33662 to a high at 1.35582, with the two halves shaded around the midpoint.
Reading the GBPUSD range split
Anchor first, then judge. The range low at 1.33662 came from a swing that swept an earlier low, and the high at 1.35582 capped the move with a raid of its own. Halfway between them sits equilibrium at 1.34622 — the line the Fibonacci tool labels 0.5. Everything in the shaded band above that line trades at a premium, and everything below it trades at a discount.
Now price the difference. A long taken at 1.35300 pays about 68 pips above fair value, while the same idea executed at 1.34000 starts 62 pips below it. Same range, same bias, radically different price paid — and only the split makes that visible before entry.
Notice what the split changes. It never generates signals; it only vetoes trades taken at bad prices. Yet that veto alone removes the most common retail mistake: chasing longs into strength near range highs.
The idea has old roots, too. Floor traders talked about value areas long before ICT, and the 50 percent retracement traces back to W. D. Gann’s work in the early twentieth century. ICT’s contribution is the strict pairing: a liquidity-defined range plus a hard rule about which half you may trade from.
Whose orders define value
The behavioral claim has a simple engine. Institutions work large positions over hours, and chasing strength moves the market against their own fills. So their buying clusters where sellers stay active — in the lower half, at a discount. Retail flow mirrors the opposite: it buys excitement near highs and sells fear near lows. Hence the two halves separate the crowd from the size, which is why the rule reads buy discount, sell premium, never the reverse.
Hold the claim to an honest standard, though. No public study measures how often institutional fills cluster below a retail-drawn midpoint, so the evidence stays qualitative: repeated observation, not audited statistics. Treat the split as a discipline tool with a plausible story behind it, and let your own journal supply the numbers that matter.
The Dealing Range: Draw It Right or the Split Lies
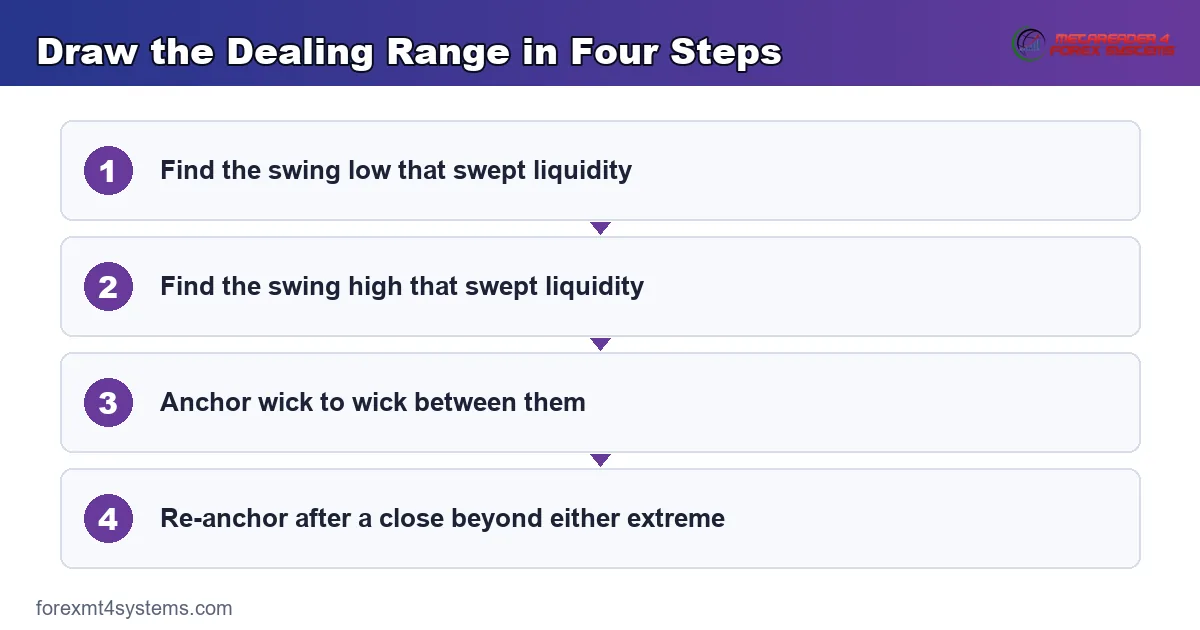
The midpoint is only as good as the range around it, and this is where most beginners go wrong. Plainly, a valid dealing range runs between a swing high and a swing low that swept liquidity — points where price traded beyond a prior extreme and reversed. Random consolidation boundaries never qualify.
- First, find the most recent swing low that traded below an older low and reversed.
- Next, find the most recent swing high that traded above an older high and reversed.
- Then anchor the range between those two points, wick to wick.
- Last, re-anchor whenever price closes beyond either extreme; the old range dies and a new one begins.
Higher timeframes rule. A daily dealing range frames the trading week, while a 1-hour range only guides intraday decisions inside it. Also, keep both on the chart and let the larger range settle any conflict between them. Weekly ranges outrank daily ones the same way whenever the two disagree.
Wicks belong in the range. Indeed, ICT anchors from the true extreme of each swing, wick included, because the stop run that created the wick is exactly the liquidity event that validates the level.
Equilibrium: The 50 Percent Level
Equilibrium sits exactly halfway across the dealing range. Traders mark it with the standard Fibonacci retracement tool, keeping only the 0, 0.5, and 1.0 levels visible. Then drag the tool from the range low to the range high for a bullish read, or from high to low for a bearish one; the 0.5 line lands on equilibrium either way.
Also, deeper levels refine the entry. The optimal trade entry (OTE) pocket spans the 62 to 79 percent retracement, with 70.5 percent as the sweet spot — our optimal trade entry guide covers it fully. Prefer exact numbers over chart tools? The free Fibonacci calculator outputs every retracement level from just two prices.
One refinement matters here. ICT applies the split fractally: the daily range has an equilibrium, and so does each impulse leg inside it. Thus deep discount of the daily range plus discount of the current leg marks a stronger long location than either alone.
Fractal ranges in practice
Run the layering on the GBPUSD chart above. The full range spans 1.33662 to 1.35582, so the daily-scale equilibrium sits at 1.34622. Now suppose the latest impulse leg inside it rallied from 1.34100 to 1.35200; that leg’s own midpoint sits at 1.34650 — nearly the same line. When two equilibrium levels stack within a few pips like this, the zone between them becomes a high-interest area, because both the range and the leg call it fair value.
Stacks disagree just as often, though. A leg equilibrium deep inside the daily premium still argues against longs, whatever the smaller structure says. Resolve every conflict the same way: the larger range wins, and the smaller one only refines timing inside the approved half.
The first graphic below labels the whole anatomy — range extremes, equilibrium, both halves, and the OTE pocket — in one reference card.
A Session Workflow for the 50 Percent Level
Here is how the split runs in practice, start to finish, on any pair.
- First, mark the daily dealing range before the London open and note where price sits inside it.
- Second, set the working bias — bullish reads want price in discount, bearish reads want it in premium.
- Next, drop to a 15-minute chart and wait for a liquidity sweep inside the correct half.
- Then look for displacement and a fresh array — a gap or block — forming at or beyond the 0.5 line.
- Now execute only if the array still sits on the correct side of equilibrium when price returns.
- Last, record the range, the half, and the outcome in your journal.
Ten minutes of preparation covers the first two steps. The rest is patience. Most sessions offer one clean alignment at best, and many offer none — a slow cadence that beginners misread as a flaw when it is the design.
A full session narrative helps set expectations. Before London, you mark the range and note price resting just under equilibrium with a bullish bias. London dips into discount, sweeps a minor low, and stalls — no displacement, so no trade. Then the New York kill zone delivers the full sequence: a deeper sweep, a strong break of structure, and a gap forming at the 0.6 level. That single entry, hours after the preparation, is what a good day with this tool actually looks like.
Timeframe pairing for the split
The routine layers cleanly across timeframes. The daily range answers where value sits for the week, an H1 range frames the session inside it, and an M15 structure break times the entry within the chosen half. Also, respect the clock: mark the daily range before the London open at 2:00 AM New York time, then expect the halves to get tested during the London or New York kill zones rather than the Asian drift. When the daily and session ranges disagree, the daily wins, and the session range only sizes the retrace.
Buy Discount, Sell Premium: A EURUSD Example
Suppose EURUSD reverses at 1.13400 after sweeping an old low, then rallies to 1.14400 and stalls under an old high. The dealing range spans 100 pips, so equilibrium sits at 1.13900. Now assume the daily bias is bullish, targeting the buy-side liquidity resting above 1.14400.
Price then retraces to 1.13790, where a fair value gap waits — eleven pips into discount. The rule approves a long: bias up, zone below equilibrium. Yet the same gap sitting at 1.14010 would fail the filter, because a long from premium pays above fair value. Stops go below the discount array near 1.13760, and the first target is the pool above 1.14400. Indeed, the filter changed nothing about the setup except the one thing that compounds: the price paid.
Run the same audit on your last twenty trades. Mark where each entry sat inside its range, and the pattern — good ideas taken at poor prices — usually appears within minutes.
Worked Example 2: Selling Premium on USDJPY
The filter works identically on the short side. The chart below shows the full sequence on a USDJPY 1-hour chart, from range to entry.

- First, the range: a swept low at 161.800, a swept high at 163.400, equilibrium at 162.600.
- Next, the bias: daily structure had displaced lower, so sell-side liquidity under 161.800 stood as the draw.
- Then the location: the New York morning lifted price to 163.100 — half a yen into premium.
- The trigger: price swept a session high by a few pips and displaced down through 162.850.
- The array: the drop left a bearish fair value gap from 162.950 to 163.020, comfortably above equilibrium.
- Last, the trade: short the retrace into the gap, stop at 163.250, first target equilibrium, final target 162.000 ahead of the range low.
Price paid does the quiet work again. A short filled near 162.980 sells roughly 38 pips above fair value, and the equilibrium target alone spans more than the stop distance. Also, note the discipline the range enforces: the same gap printed below 162.600 would offer no trade at all, however clean the displacement looked.
Manage the position by the same map. Many traders bank a partial at equilibrium, slide the stop to entry, and let the rest work toward 162.000. Others exit everything at the midpoint on range-bound days and only hold runners when the daily bias backs the move. Choose one plan before entry and write it down; the range gives you the levels, and the journal keeps you honest about following them.
Download the complete indicator database
Put these concepts on your charts. One email unlocks the full library of 1,380+ indicators with compiled MT4 and MT5 files, plus my TradingView scripts. No paywall, no spam, unsubscribe any time.
Get free access to my indicator database
One email unlocks 1,380+ free MT4, MT5 and TradingView indicators — the complete library. No single-tool download; you get the whole database.
Premium and Discount Inside the ICT Workflow
The split is a filter layer, not a standalone system. First, it sorts the PD array matrix: bullish arrays only count in discount, and bearish arrays only count in premium. Also, it sharpens the daily bias routine — a bullish bias with price in deep discount is the highest-quality alignment the model offers.
Range extremes double as liquidity pools, which is why sweeps of those extremes matter so much; the full guide to liquidity sweep trading covers that interaction. Meanwhile, on charts, our Premium and Discount ICT indicator draws the dealing range and equilibrium automatically on MT4 and MT5, and the wider catalog of smart money indicators maps the arrays inside each half.
Five Dealing Range Mistakes and Their Fixes
Range errors sink more premium-discount trades than entry errors, and these five dominate beginner journals. Each one carries a plain correction you can apply on the very next chart.
- Anchoring to random consolidation edges. Fix: only swings that swept liquidity define a dealing range.
- Anchoring to candle bodies. Fix: include the wick — the stop run that built it validates the level.
- Letting a session range overrule the daily. Fix: the higher-timeframe half holds veto power, always.
- Treating equilibrium as an entry signal. Fix: the 0.5 line filters trades; it never fires them.
- Keeping a dead range on the chart. Fix: re-anchor the moment price closes beyond either extreme.
The second graphic pairs each mistake with its correction for a fast pre-session review.

A Pre-Trade Checklist for the Split
Run these seven lines before any entry that leans on the range. A single failure sends the trade back to the watchlist.
- Range anchored wick to wick between two liquidity-sweeping swings.
- Daily and session ranges both marked, with conflicts settled by the daily.
- Bias set before London: bullish wants discount, bearish wants premium.
- Price currently sits in the half that matches the bias.
- A sweep plus displacement happened inside that half.
- The entry array rests on the correct side of equilibrium.
- Stop beyond the sweep, and the journal line written first.
Also, score a month of trades against the list. The line you skip most often is the leak, and fixing one leak beats learning three new concepts.
Related Concepts to Study Next
Two companion reads sharpen the split quickly, and both slot straight into the workflow this guide teaches. The guide to buy-side and sell-side liquidity explains why range extremes attract raids — the pools resting there define the dealing range in the first place. Then the market structure shift article covers the displacement evidence that ends one range and starts the next. Also, the PD array matrix linked above shows how every zone type slots into the two halves.
When Premium and Discount Fail
Strong trends break the rule constantly. In a runaway uptrend, price can hold premium for days while the discount retracement never comes. So traders who wait for the 50 percent pullback simply miss the move — a real cost the framework accepts in exchange for better average entries.
Accept that cost consciously rather than by accident. A value filter always trades some participation for location, and the strongest markets punish the trade-off hardest. Trend-following approaches make the opposite exchange, paying worse prices for more time in the move. Neither choice is wrong; what breaks accounts is switching between them mid-trade.
Range selection is the other failure point. Anchor the tool to the wrong swings and the labels flip: yesterday’s premium becomes today’s discount. Equilibrium is not a magnet either; price crosses it without reacting more often than it respects it. Hence use the split as a context filter on top of structure and liquidity, never as a signal by itself.
Backtesting calibrates expectations here. Replay a month of EURUSD sessions and count how often price actually filled a discount array before running toward the draw; that sample teaches the base rate faster than any opinion. Also, keep the test honest — mark the range before scrolling forward, never after.
A failure walkthrough: discount in a downtrend
One failure repeats more than all others, and the chart below shows it. EURUSD grinds lower for two weeks. A trader anchors a range on the latest bounce, waits patiently for discount, and buys a gap ten pips under the midpoint. Yet the trend never agreed: that bounce was only a pullback, and the range existed mainly on the trader’s chart.

Resolution comes fast. Price closes below the range low, the long stops out, and the honest read appears: the whole “range” sat inside a larger bearish leg, so the bigger structure marked the trader’s discount as premium. Hence the invalidation rule: a decisive close beyond either extreme kills the range and every trade premised on it.
Afterwards, audit the anchors. Log the two swings you used and check whether each one truly swept liquidity; a mis-anchored range fails that test almost every time. Qualitatively, the split behaves best inside balanced, two-sided conditions and worst in fresh trends — no version of the tool removes that limitation, and pretending otherwise only delays the lesson.
FAQ
What is equilibrium in ICT trading?
Equilibrium is the 50 percent midpoint of the current dealing range. It represents fair value for that range: price above it trades at a premium, and price below it trades at a discount. Plainly, it is the reference line every other ICT filter leans on.
Which Fibonacci settings show premium and discount?
Three levels are enough: 0, 0.5, and 1.0. Also, many ICT traders add 0.62, 0.705, and 0.79 to display the optimal trade entry pocket inside the discount or premium half.
How do I pick the swing points for the dealing range?
Use the most recent swing high and swing low that traded through a prior extreme and reversed — the sweeps. Ordinary pullback swings inside a leg do not qualify. When in doubt, zoom out one timeframe and let the larger structure choose the anchors.
Can price stay in premium without dropping?
Yes, and it happens in every strong trend. Premium is not a sell signal on its own; it only tells you what you would pay relative to the range. So bias and structure must agree before any trade makes sense.
Does the premium and discount split work intraday?
It works on any timeframe with clear swing points, and day traders apply it to session ranges constantly. Still, keep the daily range on the chart as well, since the higher-timeframe half usually dominates.
Does premium and discount work on stocks and crypto?
The math applies to any chart with defined swings, and traders use it on indices, metals, and crypto daily. Yet liquidity behavior differs across markets, so test the filter on your instrument first. Results are not guaranteed; past performance is not indicative of future results.
External references
- For background on this concept, see Equilibrium at Investopedia.
- For broader market context, see Mean reversion on Wikipedia.

About the author
Written by Dominic Walsh, a Forex trader and MT4/MT5 indicator, Expert Advisor and script developer. Every tool on forexmt4systems.com is tested on live charts before release and ships with ready-to-use compiled MT4 (.ex4) and MT5 (.ex5) files. Learn more about the trader and developer behind this site.
How we build, test and correct every tool: Editorial & Testing Policy. Trading carries risk; see the disclaimer.