
ICT daily bias is the directional expectation you set before the trading day: will price reach for buy-side liquidity above, or sell-side liquidity below? Michael Huddleston, the Inner Circle Trader (ICT), teaches that every intraday setup should align with that call. So this guide gives you a repeatable seven-step checklist, two worked walkthroughs, and the situations where the honest answer is “no bias today.”
First, understand what the bias is not. It is not a prediction of every candle; it is a working hypothesis about the day’s destination, held only while the evidence supports it.
What ICT Daily Bias Means
Daily bias answers a single question: which pool of resting orders is price most likely to reach next? ICT calls that destination the draw on liquidity. Candidates include the previous day’s high and low, the previous week’s high and low, old daily swings, and untouched gaps. When the higher-timeframe evidence points at one pool you have a bias; if it points both ways, you have none. Hence bias work is mostly about destinations, not entries — the entry comes later, from a separate trigger.
Also, the bias sets your risk posture. A clear bullish day means longs only, pullback entries, and patience at premium prices, while a no-bias day means smaller size or no trades at all. Sizing built on that logic keeps quiet days cheap and clear days meaningful.
Think of the bias as a filter on attention as much as on trades. With a bullish call written down, every sell signal on the 15-minute chart becomes noise you can ignore, and screen time shrinks to the windows where a long could trigger. Focus, not prediction, is the routine’s quiet payoff.
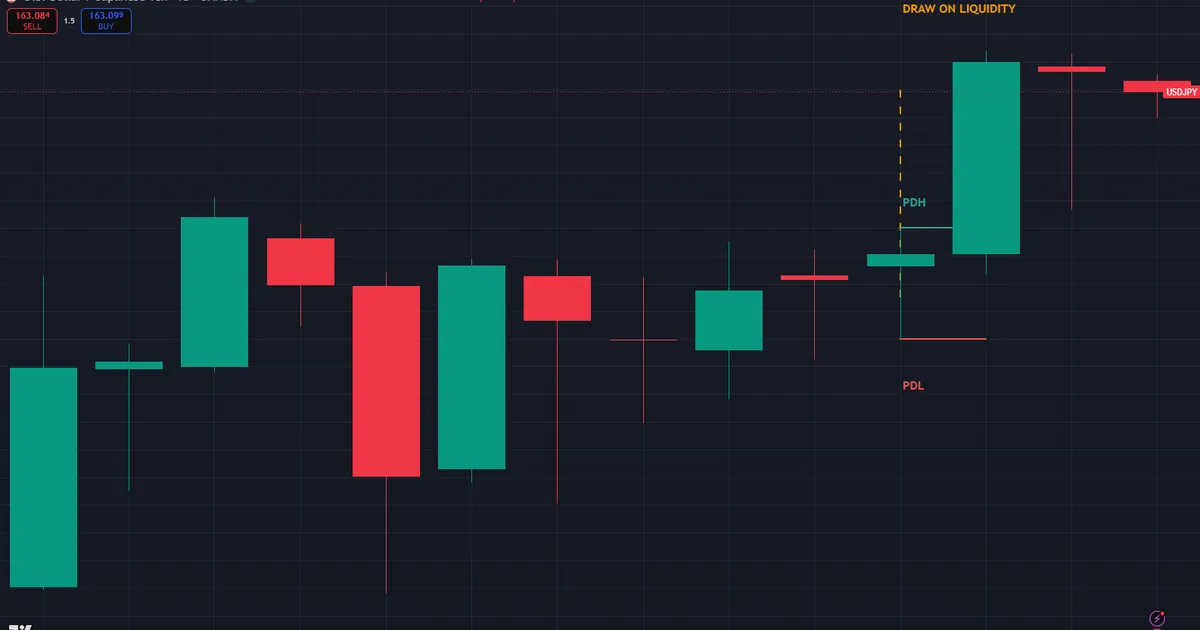
The chart below shows the routine’s raw material: a USDJPY daily chart from July 21, 2026, with the previous day’s levels marked ahead of the session.
Reading the July 2026 USDJPY chart
Two lines define that day. The previous day high (PDH) sits at 162.602 and the previous day low (PDL) at 162.200 — a tight prior range of roughly 40 pips. Daily structure had climbed into the date, and the cleaner untapped pool rested above the PDH, so the draw on liquidity pointed up. The session resolved along that read: price ran through 162.602 and extended to 163.241, nearly 64 pips beyond the raided level.
Note what the bias claimed and what it did not. It named a destination — the buy-side pool over the PDH — plus the evidence that would confirm the run. It never promised the path, and the tight prior range warned that the early session could whip both ways first.
The three evidence sources behind every bias
Every daily bias rests on the same three inputs, weighed together. Structure supplies the first vote: the most recent daily displacement says which side currently holds control. Liquidity supplies the second: the cleaner, closer, untapped pool marks the likelier destination. Time supplies the third, because a draw usually resolves during a kill zone rather than at random hours.
Conflicts between the votes are information too. Bullish structure with the nearest clean pool below price warns of a raid-first day — the kind that dips before it runs. All three votes aligned, as on the USDJPY chart above, is the A-grade read the scorecard later in this guide reserves full risk for.
How to Find Your ICT Daily Bias Step by Step
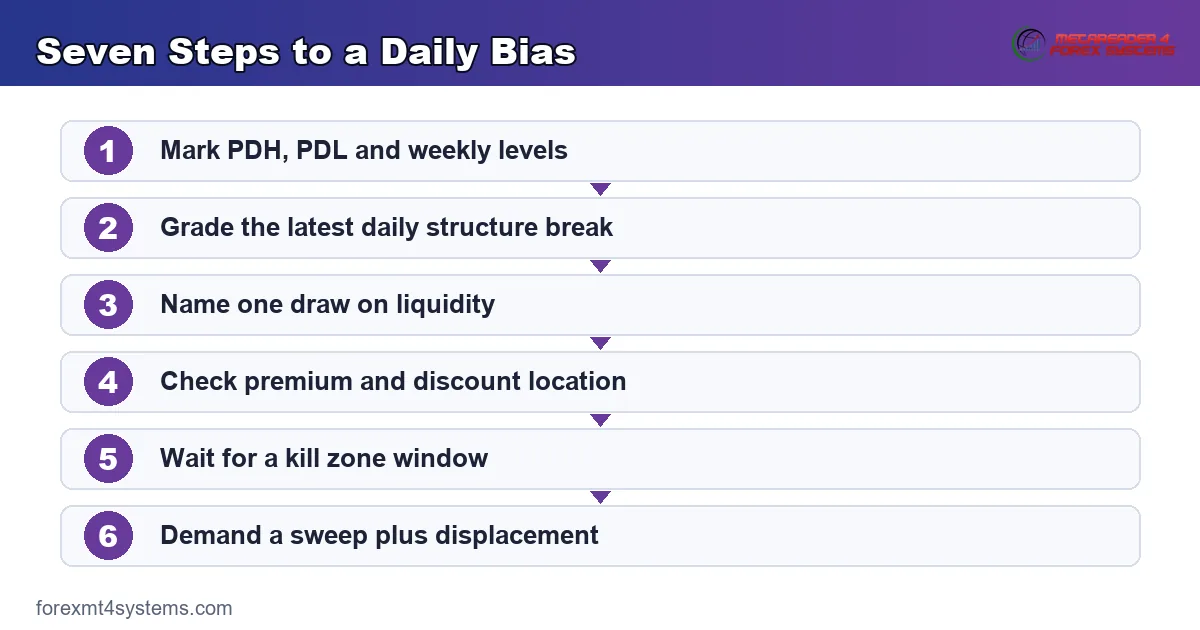
Run the checklist in order, ideally before the London session opens at 2:00 AM New York time. Truly, the whole routine takes about ten minutes once practiced. Then spend the session executing the plan, not re-deciding it.
Step 1: Mark the reference levels
Draw the previous day high (PDH) and previous day low (PDL), plus the previous week’s high and low. These four lines are the most common intraday liquidity pools. Also mark any equal highs or equal lows nearby, since matched extremes attract price strongly. Color-code the set so the chart stays readable at a glance.
Step 2: Read the daily structure
Ask what the daily chart last did. A recent displacement through a swing high argues for higher prices, while a break below a swing low argues for lower ones. So grade the most recent break, not an old one — our guide to the market structure shift shows how.
Step 3: Pick the draw on liquidity
Now choose the destination. If daily structure is bullish and the PDH sits untouched above, that pool is the natural draw. Meanwhile, weigh buy-side against sell-side liquidity: the side holding the cleaner, closer, untapped pool usually wins the argument. Untouched daily gaps count as candidates too, since price often returns to fill them before continuing.
Step 4: Check premium and discount
Next, locate price inside the current daily dealing range. A bullish bias is strongest when price sits in discount, below the range midpoint, with room to run toward the draw. See our premium and discount guide for drawing the range correctly.
Step 5: Add the time-of-day context
Institutional volume clusters in the kill zones: London from 2:00 to 5:00 AM and New York from 7:00 to 10:00 AM, New York time. Thus plan for the bias to express itself inside those windows. The full guide to ICT kill zones details each window, and our free forex market hours tool converts them to your local clock.
Step 6: Demand confirmation before trading
A bias alone is not an entry. Instead, wait for a sweep of an opposing pool followed by displacement — a fast, full-bodied move — in the bias direction. Without that sequence, stand down and keep the bias on paper.
Step 7: Write it down and grade it
Log the bias, the reasoning, and the outcome every single day. Indeed, a month of graded calls tells you honestly whether your process reads the market or just your mood.
The first graphic below compresses the seven steps into one pre-session card.
Worked Example: EURUSD
Suppose yesterday’s EURUSD range ran from a PDL at 1.14060 to a PDH at 1.14680, and the daily chart displaced through a swing high two days ago. Structure is bullish, so the untouched PDH and the weekly high at 1.14800 stack together as the buy-side draw. Price opens the London session at 1.14240 — the lower third of the range, in discount. Hence the map is bullish before London even opens.
During the London kill zone, price dips to 1.14010, sweeping the PDL by five pips. Then it displaces up through 1.14300, and every box is ticked: bullish structure, buy-side draw overhead, discount location, kill-zone timing, and a sweep-plus-displacement trigger. Longs target 1.14680 first and 1.14800 second, with stops below 1.13980. Truly, the bias did the heavy lifting before the first trade even appeared.
Also, note the counterfactual. Had price opened at 1.14660 instead — deep in premium under the draw — the same bullish bias would stand, yet the long entry would wait for a much deeper retracement first.
From Bias to Entry: The SMC Workflow
Bias is layer one of a four-layer routine that Smart Money Concepts (SMC) traders run in fixed order. The bias names the destination. Next, the zones along the path — blocks, gaps, breakers — become candidate entry areas. Then the lower timeframe supplies the trigger: a sweep plus displacement at one of those zones. Only when all three layers agree does the fourth, the order itself, exist.
Each layer also protects the ones below it. A wrong bias gets filtered when no zone in its path produces a trigger, and a wrong zone gets filtered when the sweep never displaces. Skip a layer and the protection disappears — which is exactly how a plausible-looking morning turns into three unplanned trades. Respect the order, and the routine stays boring in the best sense.
Timeframe pairing and session timing
Split the work across charts deliberately. The daily and 4-hour set the bias and the destination pool, an H1 chart maps the zones in the path, and an M15 or M5 chart times the trigger. Also, the clock filters everything: set the bias before the 2:00 AM New York time London open, then let it express inside the London or New York kill zones. A bias that has not moved by the London close often completes during the New York morning instead.
Worked Example 2: A Bearish Bias Day on GBPUSD
Bearish days mirror the routine exactly, and the chart below walks one from levels to target, step by numbered step.
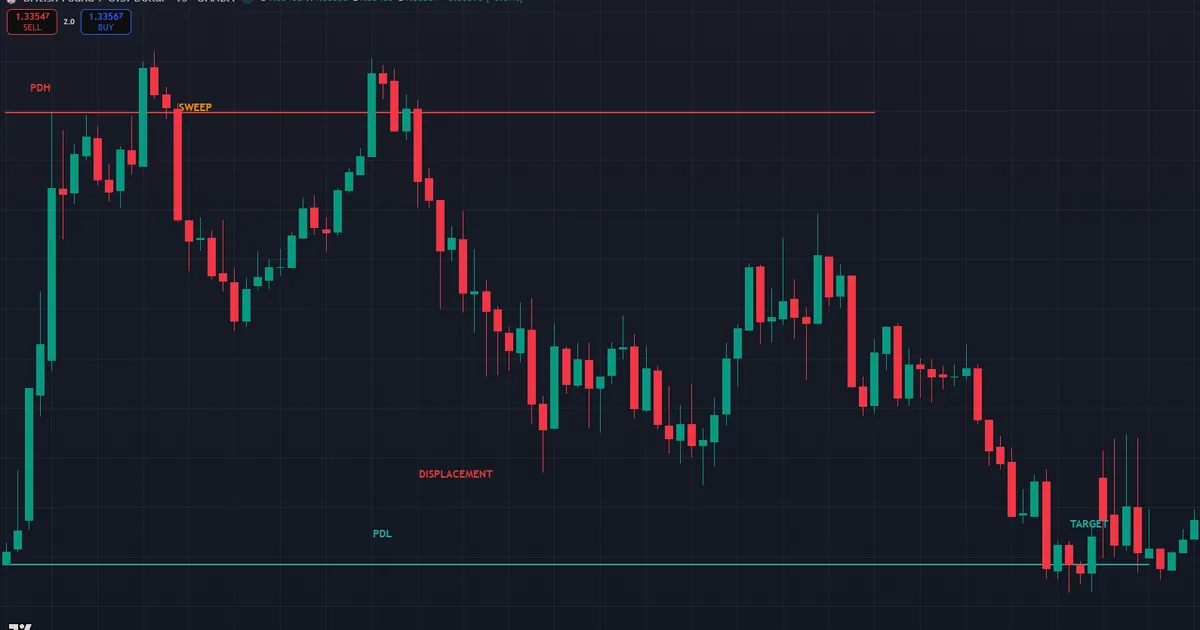
- First, the levels: PDH at 1.35210, PDL at 1.34440, and daily structure fresh off a displacement lower.
- Next, the draw: the PDL and the equal lows beneath it held the cleaner pool, so the bias pointed down.
- Then the location: London opened near 1.34980, the upper third of the prior range — premium for a seller.
- The trap: the New York kill zone pushed price to 1.35260, five pips through the PDH, raiding buy stops against the bias.
- The trigger: displacement broke 1.34900, leaving a bearish fair value gap between 1.34980 and 1.35050.
- Last, the trade: short the retrace into the gap, stop at 1.35300, first target the PDL at 1.34440.
The raid is the feature, not a flaw. A bearish bias day frequently opens with a run on the PDH, because the buy stops above it fund institutional selling. Hence the checklist’s insistence on confirmation: the sweep alone proved nothing until displacement followed it. Also, the stop hides above the raid high, where the bearish case is factually wrong rather than merely uncomfortable.
Manage the trade along the marked levels. A mid-gap short near 1.35010 risks about 29 pips to the stop, while the PDL waits roughly 57 pips below — close to two times the risk on the first target alone. Many traders bank a partial there and trail the rest toward the equal lows, while others exit fully and re-enter only on a fresh trigger. Either way, decide before the fill; the bias supplies the map, not the discipline.
Download the complete indicator database
Put these concepts on your charts. One email unlocks the full library of 1,380+ indicators with compiled MT4 and MT5 files, plus my TradingView scripts. No paywall, no spam, unsubscribe any time.
Get free access to my indicator database
One email unlocks 1,380+ free MT4, MT5 and TradingView indicators — the complete library. No single-tool download; you get the whole database.
When to Stand Aside
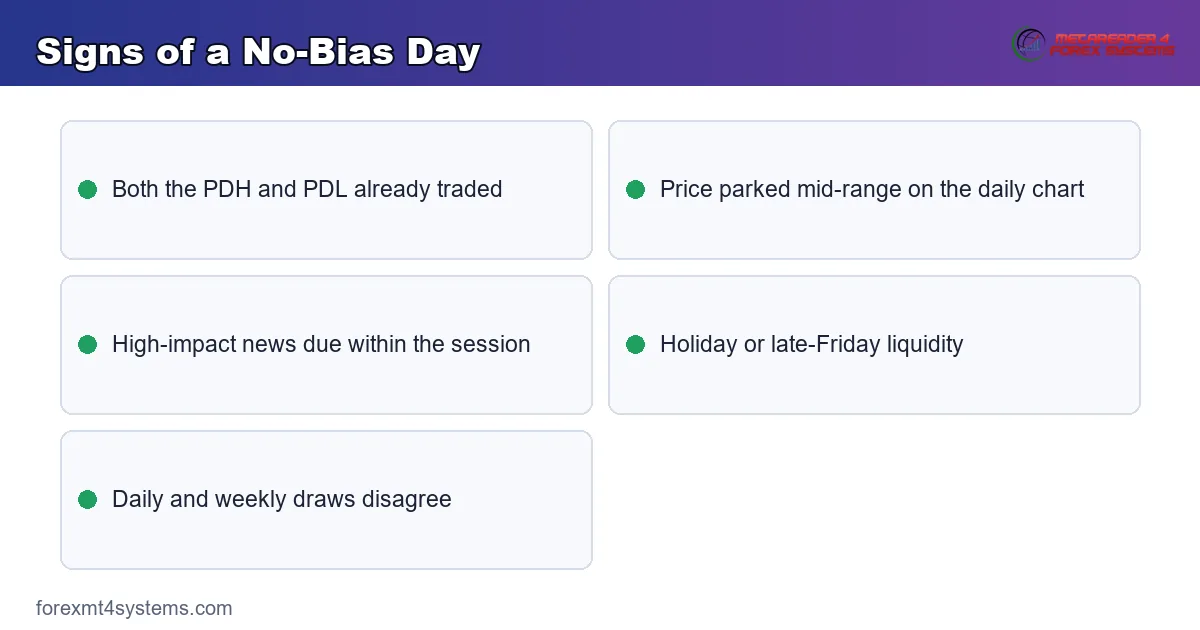
Some days deserve no bias at all. Plainly, skipping them is part of the skill, and these conditions are the tells.
- Both the PDH and PDL already traded — the obvious pools are spent.
- Price sits mid-range on the daily chart, far from any clean pool.
- High-impact news looms: the Consumer Price Index (CPI) release, Federal Open Market Committee (FOMC) decisions, or Nonfarm Payrolls (NFP) can void every technical read. Check timings on our economic calendar before committing.
- Friday afternoons and holiday sessions, when volume thins and ranges drift.
Standing aside costs nothing. Yet forcing a bias on a directionless day costs spread, stops, and confidence. News days deserve special respect: the first move after a release often raids one pool before the true move begins, which wrecks early entries. Waiting for the second setup after the release usually reads far cleaner.
Weekly rhythm helps the call as well. Mondays often build the week’s range rather than resolve it, and many ICT traders expect the week’s true directional move to begin on Tuesday or Wednesday. Thursday and Friday then either extend that move or retrace it. None of this is mechanical, yet a Monday mid-range chart plus a spent PDH-PDL pair is a textbook stand-aside combination.
Common Daily Bias Mistakes
Five errors show up in almost every beginner journal, and each has a plain fix.
- Flipping the bias mid-session after one adverse candle. Fix: one bias per session, re-planned only after the daily close.
- Targeting the far pool when a nearer one blocks the path. Fix: expect a pause at the first pocket of liquidity and manage there.
- Fading the weekly draw because a 15-minute chart looks heavy. Fix: the higher timeframe owns the destination, always.
- Skipping the journal. Fix: log the bias, the reasoning, and the outcome daily — it is the only feedback loop the process has.
- Sizing every day the same. Fix: scale risk to the day’s evidence grade.
None of these errors are exotic. Still, each one quietly converts a sound routine into coin-flip trading, and only the written record makes them visible.
A simple scorecard fixes most of this. Grade each day A, B, or C on evidence quality before the session, and only take full risk on A-days. Over a quarter, the grades expose whether your best reads actually cluster where you thought they did.
The second graphic pairs the five mistakes with their fixes for a quick pre-session review.
Quick Pre-Session Checklist
Run these seven lines before the first kill zone, in order and without exceptions. Any failed line downgrades the day’s grade or removes the day entirely.
- PDH, PDL, and weekly levels marked before London.
- Daily structure graded on its most recent break.
- One draw on liquidity named, or the day skipped.
- Premium-discount location checked against the bias.
- Red-news times noted before the session plan is set.
- Kill-zone windows set as the only entry hours.
- Bias, grade, and plan written down before the open.
Also, keep the completed lists. A month of them shows which line you skip under pressure, and that line — not a new concept — is usually the next improvement.
Related Concepts for Bias Work
Two companion reads deepen the routine, and both answer questions this checklist raises daily. The guide to liquidity pools in forex catalogs the pool types a draw can target, from equal highs to old weekly levels. Then the ICT market maker models article frames the whole day as one engineered curve — consolidation, manipulation, distribution — which explains why a bias day so often opens with a raid against the true direction.
Limitations of the Daily Bias
Bias work fails in specific, predictable ways. Ranging weeks flip the read daily, and each flip tempts you to chase the newest story. Trending weeks are kinder, yet they breed their own trap: overconfidence after a streak of easy calls. Also, a bias can be right about direction yet wrong about path — price may raid the opposite pool first and stop you out before it reaches the draw.
The process stays discretionary, too. Two traders can weigh the same levels differently, and hindsight makes every finished day look obvious. Hence the guards: the journal habit from Step 7, fixed risk per trade, and a hard rule against re-forming the bias more than once per session. Meanwhile, purpose-built ICT indicators for MT4 and MT5 can standardize the levels you mark, which removes one source of noise.
Keep expectations qualitative and honest. No public dataset measures how often a well-formed bias resolves at its draw, and any precise percentage you meet online is somebody’s guess. What a month of your own graded calls can show is a pattern: whether A-days genuinely outperform C-days in your hands. That private evidence is the only statistic this routine can offer, and it is enough to steer the work.
A failure walkthrough: the bias that reversed
The chart below shows the loss that teaches bias discipline fastest. Picture USDJPY with a bullish read: structure up, PDH untouched overhead, price in discount. The New York session runs the PDH — and instead of extending, the pair snaps back inside the prior range within the hour.
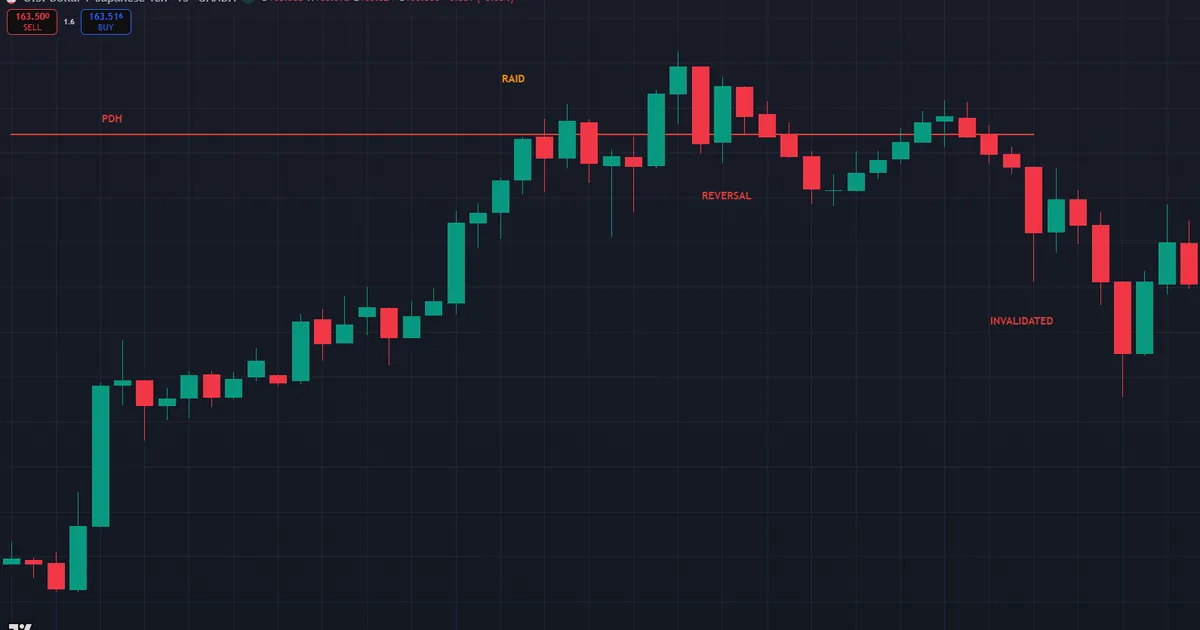
That pattern is a raid on the draw itself. The run through the PDH consumed the buy-side pool, and displacement back below the session open flipped the evidence; some traders call the shape a turtle soup reversal. The invalidation rule is strict: once price displaces through the level your read leaned on, the bias dies with it. No averaging, no second long.
Log the day as a bias failure, not bad luck. Record which step over-weighted the structure read, how far the raid ran before reversing, and what the re-entry rule would have required. Truly, one honest failure entry teaches more than a week of easy days, because it shows exactly where the routine bent.
One consolation deserves mention. A failed bullish bias often hands the observant trader tomorrow’s read: the reversal through the PDH is itself a displacement, and the pool it now draws toward sits below. Yesterday’s failure becomes today’s evidence — provided the journal captured it while the details were fresh.
FAQ
What time should I set my ICT daily bias?
Most traders set it between the daily close at 5:00 PM New York time and the London open. So the first kill zone can confirm or deny the call early in the day, while the levels are still fresh. Weekend analysis works too, though Sunday gaps can shift the levels.
What is the draw on liquidity?
The draw on liquidity is the resting-order pool price appears to be targeting — a previous day high or low, a weekly high or low, or an untouched gap. Plainly, it is the destination that gives a bias its direction.
Do I need the previous week’s levels too?
Yes. Weekly highs and lows are larger pools than daily ones, and price often trades through a PDH on its way to the weekly level. Thus marking both stops you from targeting the smaller pool when the larger one is the true draw.
What if price takes out both the PDH and PDL?
Both pools consumed usually means a ranging or news-driven session. Instead of forcing a read, stand aside, let the daily candle close, and rebuild the bias tomorrow with fresh levels.
Does the daily bias routine work on gold and indices?
The logic transfers, because PDH-PDL pools and daily structure exist on any liquid chart. Still, session behavior differs: indices concentrate their volume around the New York open, and gold reacts hard to dollar news. So test the routine per instrument on a demo before risking capital.
Can I trade without a daily bias?
You can, yet the ICT model treats bias as the anchor for every other decision. Indeed, trading counter to it, or without it, turns each setup into a coin flip on context. Results are not guaranteed; past performance is not indicative of future results.
External references
- For background on this concept, see Market Maker at Corporate Finance Institute.
- For broader market context, see Intraday at Investopedia.

About the author
Written by Dominic Walsh, a Forex trader and MT4/MT5 indicator, Expert Advisor and script developer. Every tool on forexmt4systems.com is tested on live charts before release and ships with ready-to-use compiled MT4 (.ex4) and MT5 (.ex5) files. Learn more about the trader and developer behind this site.
How we build, test and correct every tool: Editorial & Testing Policy. Trading carries risk; see the disclaimer.