
A liquidity pool in forex is a price zone where resting orders, mostly stop losses and pending entries, cluster in unusual density. Price gravitates toward these zones because large positions need that resting volume to get filled. So by the end of this guide, you will be able to find the pools on your own charts and treat them as targets instead of getting caught inside them.
The idea sits at the core of smart money concepts (SMC) and the teaching of Michael Huddleston, the Inner Circle Trader (ICT). It needs no special tools or data feeds. Plainly, it is a method for reading where other traders’ orders sit.
What Is a Liquidity Pool in Forex?
Every stop loss is a pending market order in disguise. A sell stop under a swing low becomes a market sell the instant price touches it. Likewise, a buy stop above a swing high becomes a market buy. So when hundreds of traders anchor stops to the same obvious level, those separate orders merge into one dense pool.
Institutions care because size needs counterparties. A bank building a large long cannot buy quietly at mid-range without pushing price against its own fill. Instead, it can absorb the flood of sell orders released when a pool under equal lows gets triggered. Hence pools behave like magnets: price gets drawn to them, trades through them, and often reverses once the orders are consumed.
The Hero Chart: Five Rejections, One Pool
Now see the pattern on a real chart. The GBPUSD 1-hour chart below covers July 17 to July 20, 2026. Across those sessions, price rejected the same ceiling five separate times, and every stall landed inside a band from 1.34788 to 1.34814, barely three pips wide. The rectangle frames that cluster.
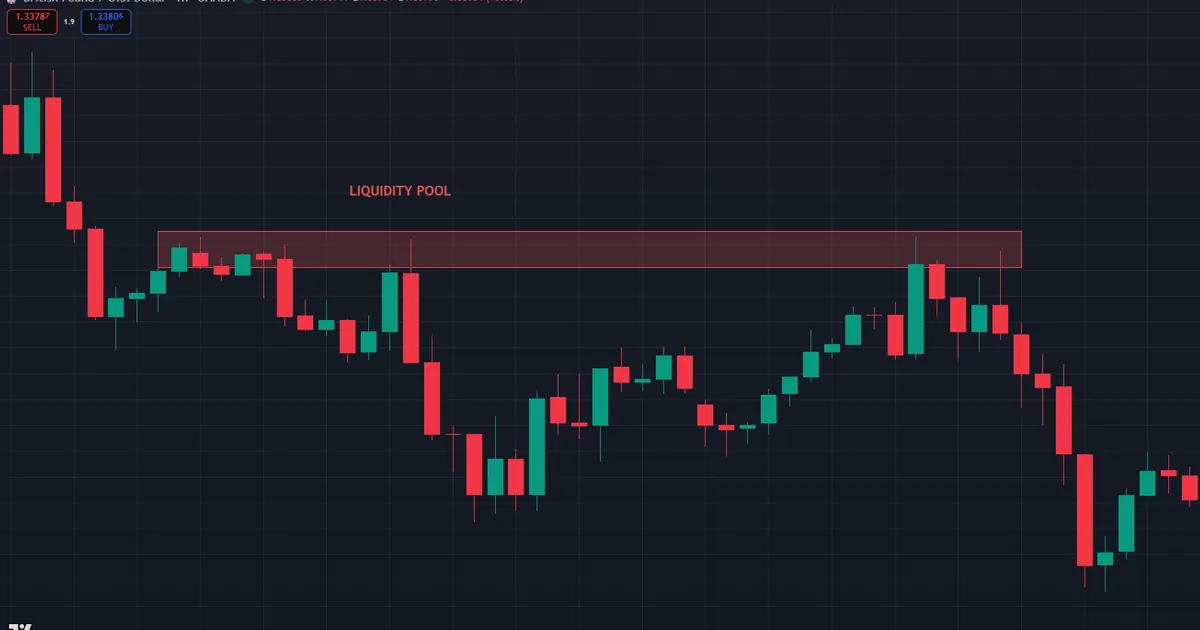
Read it the way a liquidity trader would. Each rejection looks like resistance holding, so each one convinces more shorts to sell the level and park buy stops just above 1.34814. Breakout traders add buy stop entries at the same spot. Thus five ordinary stalls quietly built one dense buy side pool across those sessions. The longer a level holds, the fatter the pool beyond it grows, and the more attractive the sweep becomes.
Also notice what the rectangle is doing. It marks a zone, not a line, because the five rejection wicks did not stop at one identical price. Sweeps behave the same way: they overshoot single levels and probe bands. Marking pools as boxes keeps your expectations honest before any raid happens.
Not the DeFi Kind
Search results mix two unrelated meanings, so let’s separate them immediately. In crypto, a liquidity pool is a smart contract that holds token pairs so a decentralized exchange can settle swaps. That is a decentralized finance (DeFi) structure with deposits, fees, and yield paid to providers.
In forex trading, no such contract exists. Here the phrase describes a zone of clustered resting orders on a price chart. Nothing gets deposited, and nothing pays yield. So if you arrived looking for DeFi pools, that is the other meaning; everything below covers order clusters in the currency market. Hence no wallet, no staking, and no yield appear anywhere in this article.
Whose Orders Fill the Pool
Break the hero chart’s pool into its authors. Shorts who sold the five rejections keep protective buy stops above the band. Breakout traders rest buy stop entries at the same prices, waiting for the ceiling to crack. Later, anyone short from lower prices trails a stop up into the cluster as price climbs. Three separate motives, one shelf of orders, and all of them become market buys the moment 1.34814 trades.
Nobody coordinates this. Instead, shared textbooks and shared chart patterns do the coordinating, which is why the inference works without any order book. Retail habits are uniform enough that structure alone reveals placement.
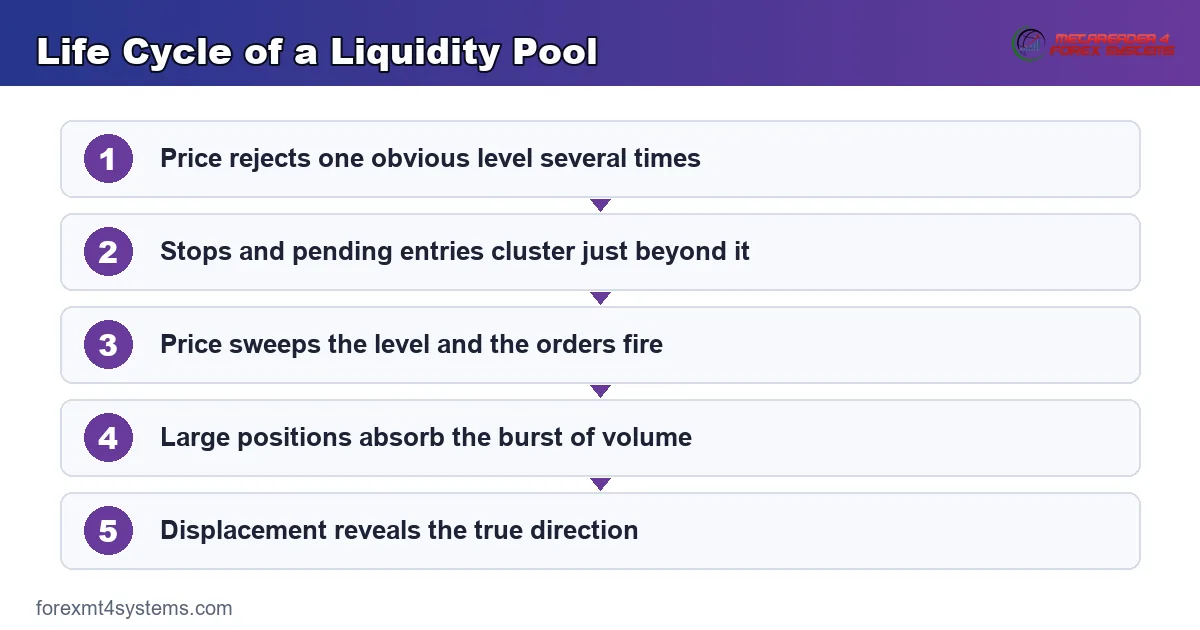
Anchoring then keeps the pool intact once it forms. After five visible rejections, the level feels proven, so shorts add on each new test rather than question the trade. Every added position deepens the pool that eventually fuels the break against them. Each order is invisible individually and obvious collectively. The stronger a level looks, the more fuel collects behind it, and that inversion is the core insight of liquidity analysis. The flow below maps the full life cycle of a pool, from first rejection to resolution.
Where Liquidity Pools Form
Pools build wherever many traders anchor orders to the same visible reference. Four zones dominate:
- Equal highs and equal lows. Two or more swings stall within a pip or two of each other. They look like firm support or resistance, so stops pile up just beyond them.
- Trendline stops. Every touch of a rising trendline adds fresh sell stops beneath it. Indeed, the longer the line survives, the fatter the pool below it grows.
- Session highs and lows. Asian range extremes, the London high, the previous day high and low. So check exact session windows with our forex market hours tool.
- Round numbers. Levels such as 1.2700 on GBPUSD or 150.00 on USDJPY collect stops because traders think in clean figures.
Direction matters as much as location. Pools above highs hold buy orders, while pools below lows hold sell orders. Our guide to buy side and sell side liquidity breaks down that split in full.
Why Obvious Levels Hold the Most Orders
Uniform education creates uniform behavior. Nearly every trading course teaches stops under the swing low, entries on the break of resistance, and targets at round numbers. Thus millions of accounts translate the same lesson into orders at the same prices. Nobody needs to see your ticket. Truly, the textbook placement is visible in the structure itself, which is why obvious levels become reliable pool locations while messy mid-range prices stay thin.
How to Find a Liquidity Pool Step by Step
Run this routine on each pair you trade. It takes a few minutes once practiced.
- Open a clean 1-hour chart and remove every indicator.
- Mark the previous day high and low, plus the current week high and low.
- Draw a line across any equal highs or equal lows from the past week.
- Note trendlines that price has touched three times or more; stops rest beyond them.
- Flag round numbers sitting within the current daily range.
- Where two or more references overlap within a few pips, mark the zone as a pool.
Then rank the pools. Older, untouched zones on higher timeframes carry more weight than fresh intraday ones. Also keep the map current: once price trades through a pool, the orders are spent and the label comes off. A tidy chart with five meaningful zones beats a cluttered one with twenty. Next, screenshot the marked chart and note your ranking; the habit builds pattern memory quickly.
Ranking Pools by Weight
Not all pools deserve equal attention, so score each zone on three inputs. Age comes first: an untouched weekly extreme outranks yesterday’s intraday stall. Density comes second: count the references stacked in the band, because equal highs plus a round number plus a session high beats any single line. Position comes third: a pool sitting in the path of the higher timeframe trend gets reached far more often than one behind it. The heaviest pool on your list becomes the draw, and the rest become waypoints along the route.
Liquidity Pools in the SMC Workflow
Pools serve two jobs in a complete SMC process. First, they act as targets: the higher timeframe pool is the draw on liquidity, the level price has a reason to reach. Second, they act as entry triggers: a sweep of a pool, followed by displacement, marks the moment large orders filled and direction may flip.
Scale changes the meaning, not the mechanics. Weekly pools set the destination, while tiny intraday pools often serve as bait. SMC traders call that engineered bait an inducement, and it deserves its own study; see our guide to inducement in trading. Meanwhile, if you prefer software to hand-marking, several of our smart money indicators plot equal highs, equal lows, and swept levels automatically on MT4 and MT5.
Multi-Timeframe Pairing and Session Timing
Work top-down: higher timeframe (HTF) context first, then the point of interest (POI), then the lower timeframe (LTF) trigger. Mark pools on the daily and H1 charts, and hunt the sweep trigger on M5 or M15 once price reaches the zone. Timing matters as much as location. Most session pools resolve in the London window, roughly 2:00 to 5:00 a.m. New York time, or the New York window, about 7:00 to 10:00 a.m. Between the opens, pools mostly just sit there. So plan your watching hours around the opens instead of chasing every candle.
Using Pools for Targets and Stops
Two practical habits follow from the map. First, aim exits at the nearest untouched pool in your direction, because price has a mechanical reason to reach it. Second, never park your stop inside a pool. If the obvious cluster sits at 1.2640, your stop belongs beyond the deeper swing, past where a sweep would probe. Thus the same zones that give you targets also tell you exactly where not to place risk. Still, treat each target as a zone rather than a single price.
Worked Example 1: GBPUSD Asia Range Pool
Say GBPUSD spends the Asian session ranging between 1.2668 and 1.2645, printing equal lows at 1.2645 and 1.2646. Longs place stops under the range, around 1.2640. Also, the round number 1.2650 sits just above those lows, thickening the cluster. So a clear sell side pool now rests beneath the Asian range.
Then London opens at 3:00 a.m. New York time. Price breaks down, spikes to 1.2637, and snaps back above 1.2650 within fifteen minutes. The raid consumed the pool and trapped late sellers. Next, displacement carries price to 1.2695, straight toward the buy side pool above the Asian high.
Note what separated the two sides of that trade. The trader with a stop at 1.2640 funded the move; the trader who waited for the sweep rode it. Indeed, this sweep-then-reverse behavior is the standard way pools resolve at session opens, and the entry models built on it are covered in our full guide to liquidity sweep trading.
Download the complete indicator database
Put these concepts on your charts. One email unlocks the full library of 1,380+ indicators with compiled MT4 and MT5 files, plus my TradingView scripts. No paywall, no spam, unsubscribe any time.
Get free access to my indicator database
One email unlocks 1,380+ free MT4, MT5 and TradingView indicators — the complete library. No single-tool download; you get the whole database.
Worked Example 2: Fading the Buy Side Pool
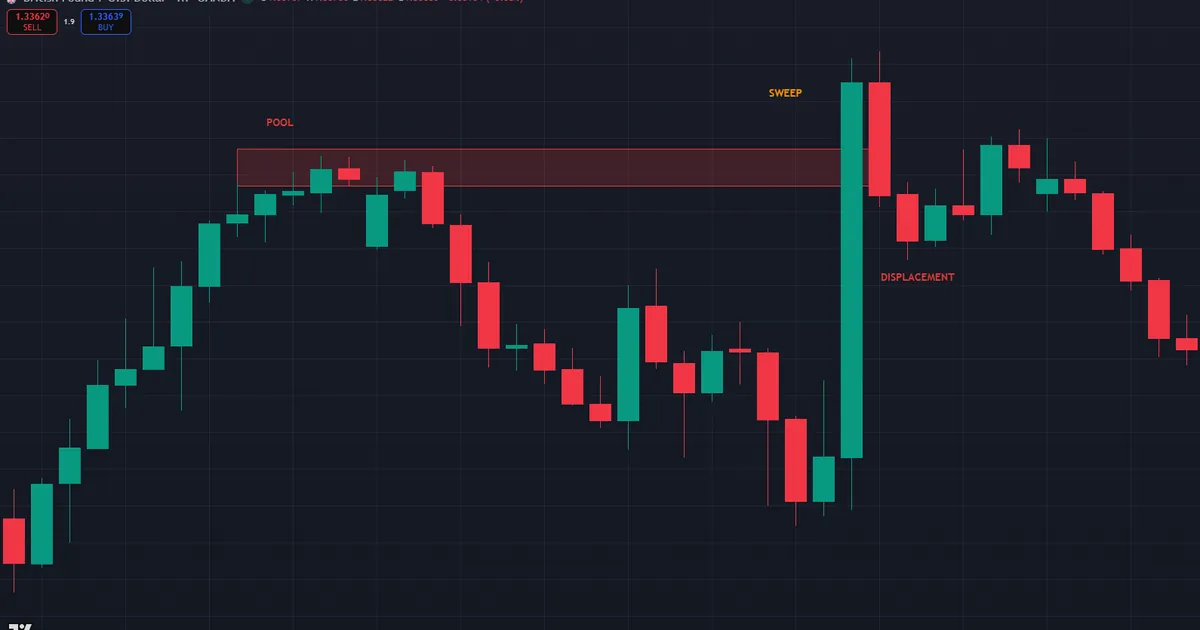
Now run the mirror-image trade against a pool above price, using the hero chart’s own geometry. Five rejections built a buy side pool between 1.34788 and 1.34814, while the higher timeframe pointed lower, toward the equal lows near 1.3457. That alignment, pool above, draw below, is exactly what a fade needs.
Here is the sequence step by step:
- Draw the rectangle over the rejection cluster and label the pool above it.
- Confirm the HTF draw points down, toward the sell side resting near 1.3457.
- Wait for the sweep. A spike to 1.34830 trades through the band and stalls.
- Demand displacement. A wide bearish H1 body closes back below 1.34780.
- Short the retrace near 1.34800 with a stop above the spike, around 1.34860.
- Target the opposite pool near 1.3457, taking partials at each H1 swing low.
The annotated chart below shows the same sequence with each stage labeled, from rectangle to sweep to displacement.
Why the Stop and Target Sit Where They Do
The stop lives beyond the sweep extreme because a second push through the band would say the breakout is real. Meanwhile, the target sits at the opposite pool because a rejected sweep hands price a mapped reason to seek the other side. Risk stays small and defined while the draw sits far away. That asymmetry is the appeal; it is never a promise about any single trade. Manage it at structure: trail behind each lower high as the move extends, and close the remainder if price prints its own sweep of a minor low ahead of the target.
Common Mistakes When Trading Pools
Five errors repeat constantly. Each has a direct fix:
- Marking twenty pools per pair. Clutter buries the signal. Fix: keep the five heaviest zones, ranked by timeframe and age, and delete the rest.
- Trading the touch instead of the reaction. Arrival at a pool proves nothing. Fix: wait for the sweep plus displacement before acting.
- Parking stops inside a pool. Your order becomes part of the fuel. Fix: place stops beyond the deeper swing, past the probable probe.
- Fading pools against the HTF draw. Counter-trend sweeps fail far more often. Fix: only fade a pool when the higher timeframe points the other way.
- Treating the rectangle as an exact line. Sweeps overshoot single prices. Fix: mark zones a few pips deep and expect probes beyond them.
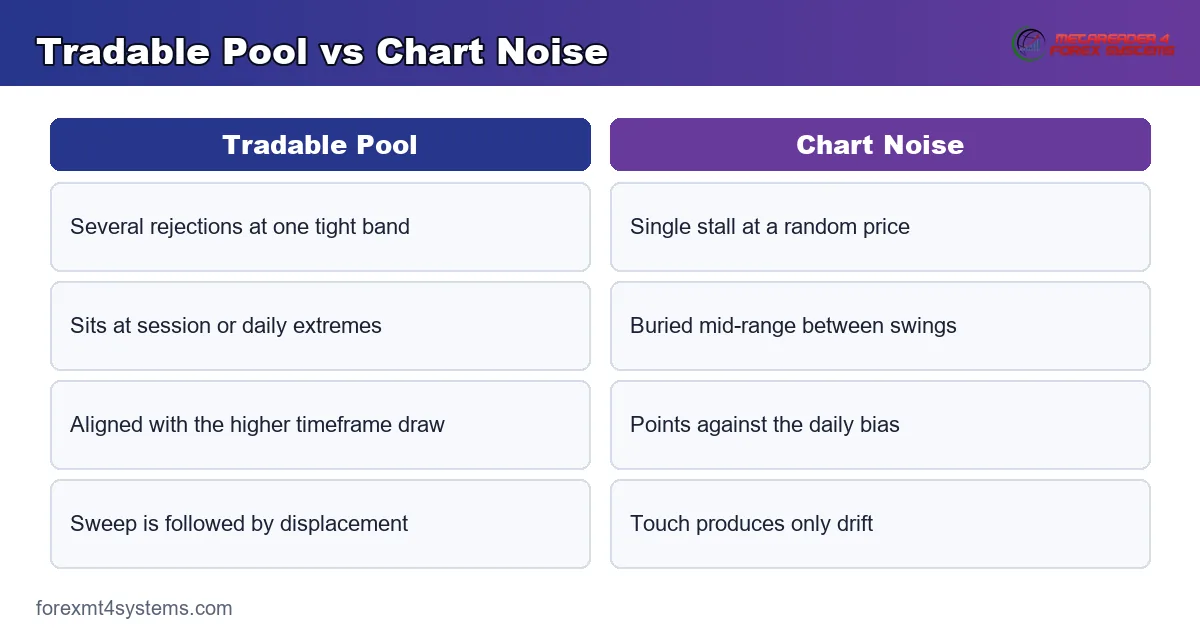
The comparison below separates a pool worth trading from ordinary chart noise.
Pool Trading Checklist
Run these checks before any pool-based entry:
- Is the pool built from several rejections or references, not one stall?
- Does it sit at a session extreme, daily extreme, or equal highs or lows?
- Does the HTF draw point away from the pool I want to fade?
- Has price actually swept the zone within the last few candles?
- Did displacement close back inside the range after the sweep?
- Is my stop beyond the sweep extreme, outside the cluster?
- Is my target the next untouched pool, marked before entry?
- Have I logged the setup, with the references that built the pool, before the outcome?
When a Pool Fails: The Run-Through
The failure case every pool trader must expect is the run-through. Price sweeps the zone, pauses briefly, then keeps trending with full-bodied candles, because the orders in the pool fed a genuine breakout rather than a reversal. No reclaim ever prints. Anyone who faded the sweep on touch alone is now trapped on the wrong side.
Context makes the run-through more likely. Sweeps that fire during major news, or in the direction of a fresh daily breakout, tend to keep going rather than reverse. Quiet-session sweeps against a stretched move reverse more readily. Neither tendency is a rule; both belong in the journal as tags you can count later.
The chart below shows that failure: a marked pool gets swept, and price trades straight through the zone without a single displacement candle back inside the range.

Invalidation and What to Log
The invalidation rule is mechanical. A fade idea stays valid only while price closes back inside the prior range within a few candles of the sweep. Once a candle closes beyond the zone and holds, the pool is spent fuel for a breakout, so stand aside or reassess with the new direction. Then log the event: pair, session, the references that built the pool, and how the run-through unfolded. Reviewing failed pools weekly shows which contexts betray you most, and cutting those contexts improves the process without new theory.
Honest Caveats
No public order book exists for spot forex. The market is decentralized, so every pool you mark is an inference from chart structure, not a verified ledger of orders. Good inferences work often. Still, they fail regularly, and pretending otherwise leads to oversized positions. News releases can blow through several pools in one candle, leaving no tradable reaction, and price can also ignore a pool for weeks or trend away from it entirely. Spread widening around releases fakes sweeps on the lowest timeframes too, since the quoted band can touch a level real trades never reached. Just treat the concept as probability, never as promise.
Resist the urge to quantify what cannot be measured. Public data does not reveal how many orders sat in any pool, so precise claims about how often pools reverse price are guesses dressed as research. Your own tagged journal is the only sample that reflects your pairs, your sessions, and your execution. Build it, count it, and trust it over any borrowed number.
Related Concepts to Study Next
Two neighbors complete the picture. First, our guide to stop hunting in forex covers the raid from the perspective of the trader whose stop sits inside the pool, with placement rules that keep orders outside the fuel. Second, ICT daily bias teaches how to choose the day’s draw on liquidity, which decides whether a given pool is a target or a trap. Then revisit the hero chart above and rank its pools yourself; five rejections in three pips should now read as fuel, not resistance. Read the three articles in that order and the map, the raid, and the bait become three views of one mechanism.
FAQ
Is a forex liquidity pool the same as a crypto liquidity pool?
No. A crypto pool is a smart contract holding tokens on a decentralized exchange. Meanwhile, a forex pool is a chart zone where stop losses and pending orders cluster. Plainly, the two share a name and nothing else.
Where do liquidity pools form most often?
Beyond equal highs and equal lows, under long-standing trendlines, past session extremes, and around round numbers. Zones where several of these references overlap hold the densest clusters. Then confirm each zone on the higher timeframe before trusting it.
Can I see a real order book for forex pools?
Not for spot forex, because the market is decentralized. Futures depth data and broker sentiment feeds offer partial views. Instead, most SMC traders infer pools from structure, which works because stop placement habits are so uniform.
Do liquidity pools work on every timeframe?
The mechanics scale from 1-minute charts to weekly charts. Yet higher timeframe pools carry more resting volume, so their sweeps produce cleaner reactions. Most traders map pools on the daily and 1-hour charts, then execute lower.
What is a draw on liquidity?
The draw on liquidity is the pool price has the strongest mechanical reason to reach next, usually the largest untouched cluster in the trend direction. SMC traders pick it from the daily or weekly chart, then frame intraday trades toward it. Think of it as the market’s current destination rather than a signal.
How does price react when it hits a pool?
Commonly it sweeps the zone, consumes the orders, and reverses once displacement appears. Yet a pool can also fuel a genuine breakout. The reaction after the touch, not the touch itself, carries the information. Results are not guaranteed; past performance is not indicative of future results.
External references
- For background on this concept, see Order at Investopedia.
- For broader market context, see Decentralized Finance on Wikipedia.

About the author
Written by Dominic Walsh, a Forex trader and MT4/MT5 indicator, Expert Advisor and script developer. Every tool on forexmt4systems.com is tested on live charts before release and ships with ready-to-use compiled MT4 (.ex4) and MT5 (.ex5) files. Learn more about the trader and developer behind this site.
How we build, test and correct every tool: Editorial & Testing Policy. Trading carries risk; see the disclaimer.