
Learning how to evaluate a forex EA takes an evening, and it saves far more than it costs. The work is not glamorous, because most of it means reading a trade list rather than admiring a curve.
Nothing here will tell you that a program makes money. No test can settle that in advance, so the honest goal stays narrower: find out what the thing actually does, then find the ways it could fail.
How to Evaluate a Forex EA in One Sitting
Start from a simple position. Assume nothing about the program until evidence says otherwise.
Two questions carry most of the weight. What rule does it follow, and on what data has anyone shown that rule behaving well?

The panel above makes the first point visible. Both paths finish at the same total, yet only one of them describes a repeatable process.
Start With the Rule, Not the Curve
Ask the seller to state the rule in two sentences. Entry, exit, stop and sizing should fit inside that space.
Vague answers matter more than they look. If nobody can describe the logic plainly, nothing exists for you to test or to repair later.
Secrecy carries a cost as well. An opaque rule cannot be reviewed, and a program nobody can explain cannot be fixed once it stops working.
Two Curves, One Total
The left path in the panel climbs steadily across many trades. The right path sits flat, then jumps once on a single outsized result.
Both end at the same number. Only the first suggests a process that might repeat, while the second describes one lucky trade surrounded by losses.
So read shape before totals. A total hides everything that matters about how the result arrived.
The Order of Checks That Saves Time
Evaluation runs faster with a fixed sequence. Each step either kills the program or earns it the next step.
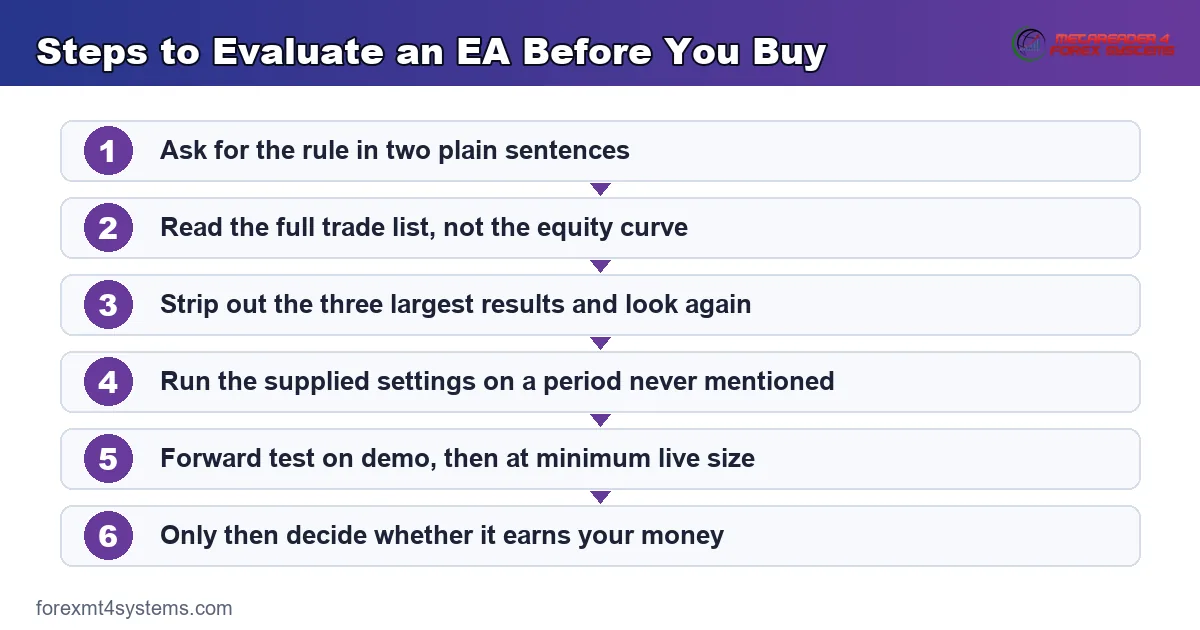
The diagram above sets that sequence out. Notice that money changes hands at the very end, after five cheaper filters have already run.
Why Order Matters
Most programs fail the first two checks. Running those first means you rarely reach the expensive ones.
People usually do the opposite. They read the curve, feel excited, then rationalise everything afterwards.
Where to Stop
Any failed step ends the process. Partial credit does not apply, because a missing trade list cannot be repaired by an impressive chart.
Move on quickly. Thousands of programs exist, and your time costs more than any single one of them.
Reading the Trade List Properly
The trade list holds the truth. An equity curve only summarises it, and a summary can hide almost anything.

The histogram above shows the classic distortion. One enormous winner sits far to the right, and it carries a record that would otherwise look poor.
Trade Count
Count the trades before anything else. Thirty results tell you very little, while several hundred across changing conditions start to mean something.
Small samples throw up impressive streaks by accident. So a short record with a beautiful curve deserves more suspicion than a long record with a rough one.
The Shape of the Outcomes
Sort results by size, then look at the top three. If removing them turns a profit into a loss, the record rests on luck rather than on a rule.
Repeat that at the other end. One catastrophic loss often reveals a stop that failed, or a rule that never carried one.
Holding Time and Frequency
Check how long trades last and how often they open. A program trading forty times a day pays forty spreads, so its edge has to clear a much higher hurdle.
Frequency also decides where it can run. Very short holding times breach the rules on many funded accounts.
Expectancy Rather Than Headlines
Work out the average result per trade after costs. That single figure describes a program better than any total, because it survives changes in position size.
Our expectancy calculator handles the arithmetic from your own numbers. Feed it the trade list rather than the marketing figures.
How Often It Wins Tells You Less Than You Think
A program that wins nine trades in ten can still lose money. One large loss undoes many small gains, and the reverse holds equally well.
Pair the frequency of wins with their average size. Neither number means much on its own.
Sales Page Claims Against What You Can Verify
Marketing rarely lies outright. It simply omits the context that would let you judge a claim.

The comparison above pairs each claim with the check that tests it. Every row on the right costs you time rather than money.
Screenshots Are Anecdotes
An image of a strong week says nothing about the weeks around it. Nor does it show the account size or the risk taken to produce it.
Ask for the whole record from the first live order. A slow answer already answers you.
Selected Start Dates
Shift a start date by three months and many records change character. A history that begins just after a bad stretch describes the calendar rather than the rule.
Survivorship
You see the programs that survived. Ones that failed left the shelf quietly, and nobody writes a page about those.
Run a hundred variations, publish the three that prospered, and a catalogue looks remarkable. Nothing in that process requires dishonesty.
Download the complete indicator database
Put these concepts on your charts. One email unlocks the full library of 1,380+ indicators with compiled MT4 and MT5 files, plus my TradingView scripts. No paywall, no spam, unsubscribe any time.
Get free access to my indicator database
One email unlocks 1,380+ free MT4, MT5 and TradingView indicators — the complete library. No single-tool download; you get the whole database.
Drawdown Depth and Drawdown Duration
Two numbers describe the pain of a strategy. Most reports mention only the first.

The panel above shades the underwater stretch of an account. Depth measures how far it fell, while duration measures how long it stayed there.
Depth Decides Survival
Take the worst historical drawdown, then double it. Ask whether your balance and your patience would both survive that figure.
Model it against your own account with our drawdown calculator. Seeing the number in your own terms changes how it feels.
Duration Decides Behaviour
A shallow drawdown lasting eight months breaks more traders than a sharp one lasting three weeks. Boredom and doubt do the damage rather than the loss itself.
Find the longest flat stretch in the record. That period, not the peak, describes what owning the program feels like.
Recovery Arithmetic
Losses and gains do not cancel evenly. A fall of one third needs a rise of one half to get back to level, and deeper falls get worse quickly.
Our note on drawdown in trading works through those numbers. They explain why depth deserves a hard limit rather than a preference.
Tests You Can Run Yourself
Vendor evidence only starts the process. Three tests cost nothing and settle most questions.
Run It on Unseen Data
Take the settings exactly as supplied, then run them on a period the seller never mentioned. Change nothing at all.
Results usually fade. A rule tuned on one stretch of history rarely repeats on another, and that single test filters out most of what circulates online.
Check the Neighbours
Move each input slightly, then run again. A robust rule leaves a broad patch of acceptable outcomes around its settings.
A fitted rule leaves a lonely spike. If a period of fifty works and forty eight fails, the program found an accident in the data.
Forward Test on Demo
Run it live on demo for several weeks. Session errors, symbol errors and broken filters all appear quickly, and none of them cost anything there.
Then step to the smallest live size your broker allows. Demo fills flatter reality, so a small live log tells you what demo cannot.
Keep both logs side by side. Our guide to keeping a trading journal covers what to record while the test runs.
What a Test Report Cannot Contain
Every simulated report leaves four things out. None of them appears as a line item, and together they explain most of the gap between a chart and an account.
Slippage That Varies
A test applies one assumption to every fill. Live markets move the price between your decision and your execution, and they move it most in exactly the conditions a breakout rule likes.
Spread That Widens
Most simulations use a fixed spread. Real spread widens on releases, at the daily rollover and through thin hours, so a test systematically understates cost when it matters.
Requotes and Rejections
Orders sometimes come back unfilled. A simulated report never shows the trade you did not get, and a rule that depends on precise entries suffers badly from that omission.
Your Own Hesitation
Reports assume the program ran untouched. Most real records end by hand, when somebody disables the thing during a drawdown or changes an input mid week.
Decide your stopping rule before you start. Otherwise the log stops describing either the program or your judgement.
A Worked Example of the Top-Three Test
The single most useful check takes five minutes. Here it runs from start to finish.
Take the Numbers Apart
Imagine a record of two hundred trades showing a healthy total. Sort every result from largest gain to largest loss, then note the top three.
Suppose those three together exceed the whole net profit. Remove them and the remaining one hundred and ninety seven trades lose money.
Read What That Means
The rule did not produce a steady edge. It produced a lot of noise plus three exceptional events, and nothing in the record shows those events repeating on demand.
Some strategies genuinely look like this. Trend following often earns most of its total from a handful of long runs, and that shape suits the method.
Ask Which Story Fits
So the test does not condemn a program by itself. It forces a question the seller must answer: does the strategy intend that shape, or did luck supply it?
A trend follower says yes and shows many years. A scalper claiming steady daily gains has a problem, because the record contradicts the pitch.
Questions Worth Asking the Vendor
Good answers arrive quickly and specifically. Evasion tells you as much as a bad number would.
What Cost Model Did the Test Use?
Ask for the spread, the commission and the slippage assumption. A rule that only survives at zero cost was never viable.
How Many Settings Were Tested?
Every extra optimisation pass costs credibility. A single run with fixed inputs means far more than a thousand passes with the best one shown.
Where Does the Live Record Start?
Ask for the date of the first live order and the account it ran on. Anything shorter than a year describes a sample rather than a history.
What Happens When It Stops Working?
Ask how you would know. A program with no stopping rule keeps trading a broken idea until somebody intervenes.
Our honest look at whether forex robots work covers that failure mode in more detail.
Warning Signs in a Track Record
Six patterns account for most disappointments. Each one has a quick check beside it.
| Warning sign | What it usually means | Quick check |
|---|---|---|
| No stop loss on any trade | Losses stay open until they reverse or ruin the account | Search the trade list for a stop price |
| Position size grows after losses | Recovery logic that scales exposure the wrong way | Compare lot sizes down a losing run |
| Very smooth curve, few trades | Open losses hidden until they close | Read floating drawdown, not closed results |
| Record starts mid-year | An earlier stretch left out of the picture | Ask for the first live order date |
| Only demo results shown | Fills that live execution never produces | Request a small live account statement |
| Settings supplied per broker | Tuning to a specific feed rather than a market | Test the same inputs on a second broker |
Any single row deserves a question rather than a verdict. Two or three together usually settle the matter.
Note how each check costs minutes rather than money. Sellers who resist these questions save you the rest of the evaluation.
Hidden Recovery Logic
Some programs add to a losing position instead of closing it. Their reports look flawless until the one occasion price refuses to come back.
Read the input list for words like multiplier, recovery, grid and averaging. Those inputs describe exposure, not protection.
Costs Left Out
Swap charges and commission rarely appear in a marketing chart. On a program holding trades for days, swap alone can turn the total around.
Checking the Data Behind the Test
A report inherits every flaw in the history it ran on. Three checks expose the worst of them.
Modelling Quality
Simulators state how faithfully they reconstructed each bar. A low figure means the engine guessed heavily about what happened inside the bar, and that guess decides whether your stop or your target came first.
Ask for the reported figure alongside the results. A strong curve built on a rough model tells you about the model.
Gaps in the History
Missing quotes distort fills. Reports often flag mismatched chart errors, which point at a data problem rather than at a strategy result.
Treat a flagged report as untested. Fix the history, run it again, then read the numbers.
One Bar, Two Prices
On many bars, price touches both your stop and your target. The simulator has to choose one, and different settings choose differently.
That single choice can flip a curve from good to poor. Check which assumption the report used before you read a single total.
Matching a Program to Your Own Account
A program can behave well and still suit you badly. Three checks settle that quickly.
Balance Against Minimum Size
Some rules need room. If the smallest lot your broker allows already risks more than your limit, the program does not fit your account yet.
Drawdown Against Temperament
Most people say they would sit through a bad run, then act otherwise. Test the honest answer on demo before you find out with money.
Hours Against Your Life
A rule trading the Asian session needs a server rather than a laptop. Match the program to your setup, since fighting your own schedule rarely lasts.
Risk inputs deserve a separate pass, and our guide to expert advisor risk settings covers the ones that decide survival.
Deciding Without Emotion
Evaluation fails most often at the last step. The evidence looks mixed, hope fills the gap, and the purchase happens anyway.
Write the Verdict Before You Buy
Note down what would make you reject the program, then check that list after the tests. Deciding the criteria first removes the temptation to bend them later.
Keep the note. In three months it will explain a decision you no longer remember making.
Set the Stopping Rule Now
Choose the drawdown that ends the experiment, and choose it while you feel calm. A limit set during a bad week gets moved during a worse one.
Write the number into the program where possible. Code obeys a threshold that a tired trader will argue with.
Size the First Run Small
Start at the minimum your broker allows. The first live months buy information rather than returns, so paying a small price for that information makes sense.
Scale only after the live log matches the demo log. If the two disagree, the disagreement is your result.
What You Cannot Establish
Honesty about limits improves every decision that follows. Three things stay unknowable.
Nobody can tell you a program will make money. That claim needs knowledge of future conditions, and no report contains it.
Nobody can rank programs reliably either. Ranking assumes comparable costs, comparable periods and comparable account rules, which rarely exist together.
Nobody can promise the market stays the same. A rule built for quiet ranges keeps firing when volatility doubles, because nothing inside it measures the change.
What you can establish looks modest and helps enormously. You can establish what the rule does, how it behaved on data it never met, how deep its worst stretch ran, and whether you would sit through it.
Signals and Copied Accounts Face the Same Test
The same questions apply when somebody else does the trading. Our review of forex signal services shows how the evidence gaps repeat there.
Tools help either way. Browse our MT5 indicator library as raw material for a process you control, never as a finished answer.
FAQ
How long should a track record be before I take it seriously?
Long enough to contain a losing run, which usually means a year or more of live trading rather than a quarter. Short records cannot separate an edge from an ordinary streak, and randomness produces streaks constantly. Ask for the record from the very first live order, not from a date the seller chose.
Is a backtest worth anything at all?
Yes, as a filter rather than as proof. A backtest can disprove a strategy quickly and cheaply, and it can show you how a rule behaves through different conditions. What it cannot do is establish future results, because the assumptions inside it were chosen by somebody who already knew what happened.
What single number matters most?
Average result per trade after costs, measured across a decent sample. It tells you whether the rule clears its own friction, and it stays meaningful when position size changes. Read it beside the worst drawdown, since one number describes the reward and the other describes the price.
Should I trust a program that hides its logic?
Treat secrecy as a cost you accept knowingly. An unexplained rule cannot be reviewed before you run it, and it cannot be diagnosed when it starts losing. If the seller will not describe the logic in plain sentences, at least insist on a full trade list and an unseen-data test.
Does a demo test tell me enough?
It catches the mechanical faults and misses the expensive ones. Demo servers fill more kindly than live ones, and they never requote or widen a spread the way a real feed does during a release. Run demo first for the errors, then run minimum live size for the execution reality, and compare the two logs honestly. Results are not guaranteed; past performance is not indicative of future results.
External references
- For background on this concept, see Optimization Results in the MQL5 Documentation.
- For broader market context, see The Sharpe Ratio in the BabyPips Forexpedia.

About the author
Written by Dominic Walsh, a Forex trader and MT4/MT5 indicator, Expert Advisor and script developer. Every tool on forexmt4systems.com is tested on live charts before release and ships with ready-to-use compiled MT4 (.ex4) and MT5 (.ex5) files. Learn more about the trader and developer behind this site.
How we build, test and correct every tool: Editorial & Testing Policy. Trading carries risk; see the disclaimer.