
Grid trading vs martingale is the comparison behind most of the automated systems sold to retail traders. Both add positions while a trade goes against them, so people file them under one heading.
They are not the same mechanism. One spaces orders across a range, the other doubles size after a loss, and the difference decides how fast an account can empty.
Grid Trading vs Martingale: The Difference in One Line
A grid places orders at fixed distances and adds a fixed size at each one. A martingale places the next order larger than the last, usually double, so that one winner clears the sequence.
Both depend on price coming back. That single requirement explains every good month and every ruined account.
The Market a Grid Wants
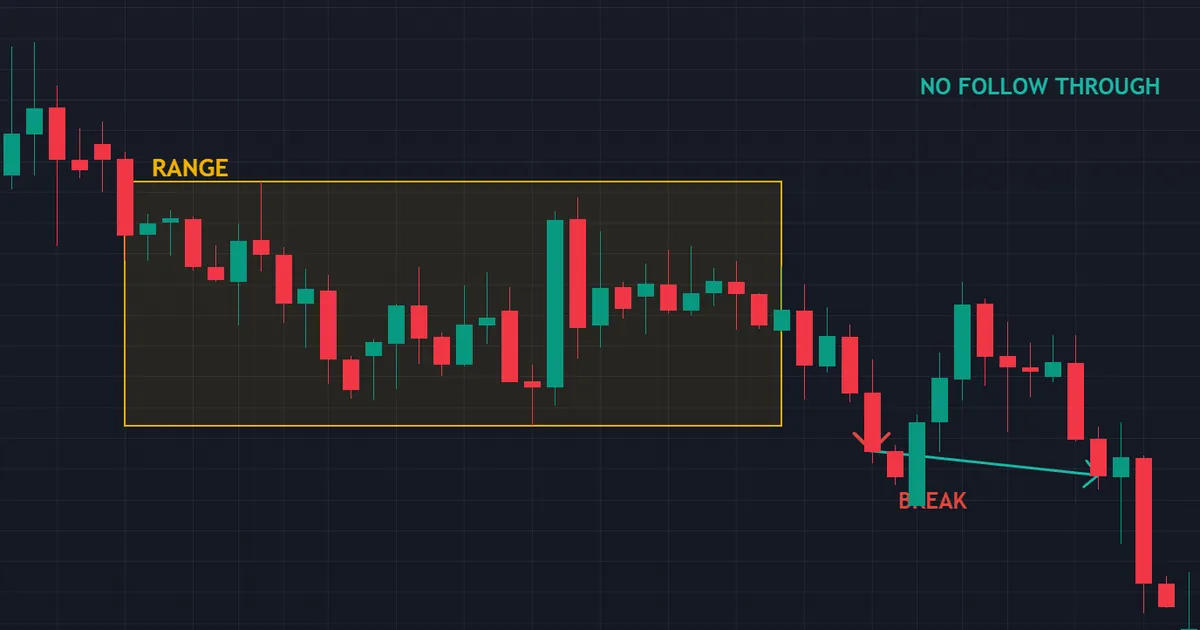
The chart above shows the behaviour a grid feeds on. The box held for 28 bars, then price closed down out of it on 2026-07-10 and travelled 0.3 ATR further in that direction over the next 10 bars.
Look at what that means. The break went almost nowhere: within two days price had climbed back inside the lower half of the range, refilling the levels it had just left.
A grid earns its small profits in exactly that market. Nothing about it forecasts anything, since the range does the work.
How a Grid Actually Works
Strip away the marketing and a grid holds three settings. Spacing, size per level, and the number of levels the account will carry.
The Ladder of Orders
The program marks levels above and below the current price at a set distance. Each time price reaches one, an order opens, and each small move back closes it for a small gain.
Profits therefore come in a steady drip. That drip looks like income on a monthly statement.
The Position Nobody Mentions
While the closed trades accumulate, the open ones stack in one direction. A fall fills every buy level below, and none of them closes until price rises again.
So the account carries a growing loss underneath a growing list of small wins. Our explainer on what grid trading is shows the ladder in full.
Hedged and Directional Versions
Some grids trade both directions at once, holding buys and sells together. Others take one side only, then wait for the range to hold.
Hedged versions feel calmer and cost more in swap. Directional versions cost less and expose the account to a single move.
How a Martingale Actually Works
A martingale answers a loss with a larger position. The classic version doubles, so the next winner recovers everything before it plus one unit.
The Recovery Arithmetic
One unit loses, then two units go on. If that loses as well, four units follow, then eight, then sixteen.
Each step assumes the same distance to target. The sequence closes profitably the moment one trade wins, which is why it looks elegant on paper.
Where the Elegance Breaks
The maths needs an unlimited balance and an unlimited number of steps. Real accounts have neither, and brokers cut the sequence off at the margin limit.
Our page on the martingale strategy in forex walks through the step arithmetic in detail.
The Disguised Versions
Not every martingale announces itself. A system that adds to a losing trade at wider and wider sizes runs the same logic under a different name.
Read the size progression rather than the label. If the next order exceeds the last after a loss, the exposure profile matches a martingale.
Where Each Idea Came From
History explains a fair amount about the sales pitch. Both ideas predate retail forex by a long way.
The Martingale Came From Betting
Eighteenth century gamblers doubled their stake after a loss on even money bets. It failed there for the same reason it fails here, since the table limit and the purse both run out.
The Grid Came From Ranges
Traders working quiet markets have always bought lower and sold higher inside a band. Automation simply made the ladder faster, larger and easier to leave running.
Neither idea began as a swindle. Both turned into one in marketing, once somebody attached a monthly figure to the output.
How Grid and Martingale Differ
Five practical differences separate them. Read the table as mechanics rather than as a verdict.
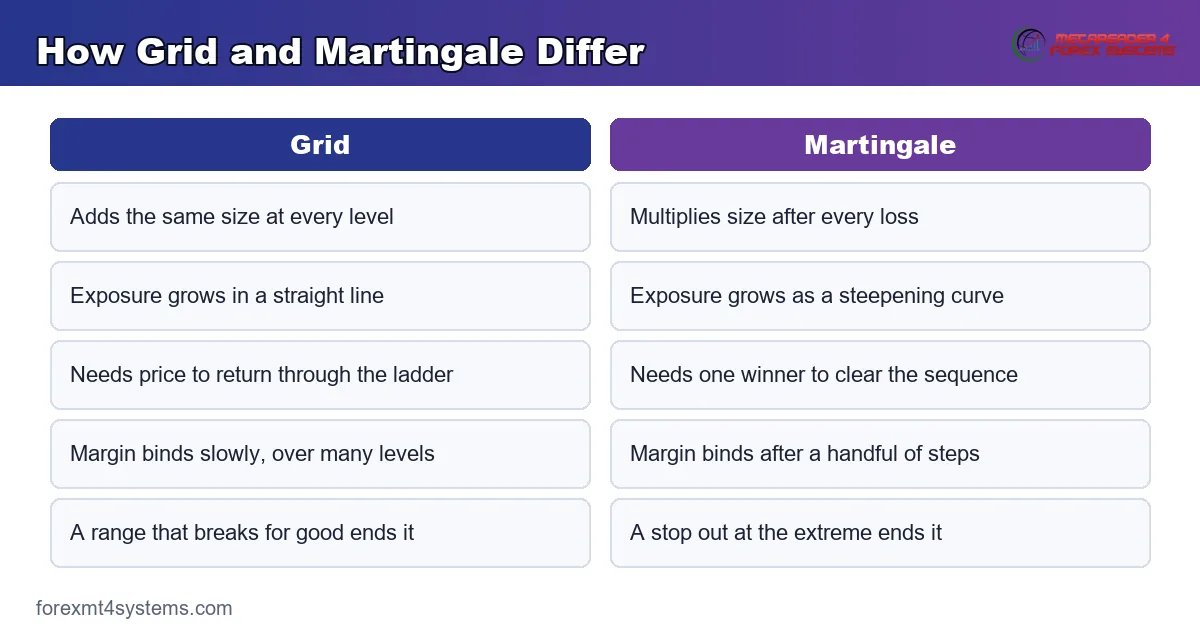
The middle row carries the most weight. Fixed size grows exposure in a straight line, while doubling grows it as a curve that turns vertical.
Download the complete indicator database
Put these concepts on your charts. One email unlocks the full library of 1,380+ indicators with compiled MT4 and MT5 files, plus my TradingView scripts. No paywall, no spam, unsubscribe any time.
Get free access to my indicator database
One email unlocks 1,380+ free MT4, MT5 and TradingView indicators — the complete library. No single-tool download; you get the whole database.
The Market That Ends Both
Both systems need price to return. A market that simply keeps going supplies no return at all.
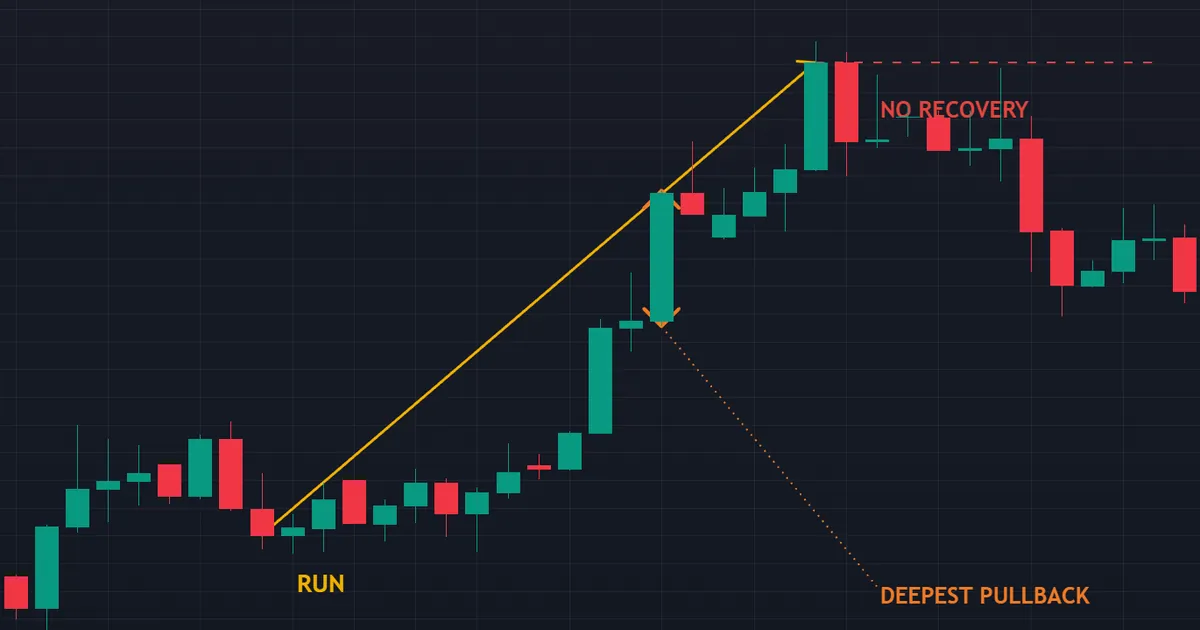
The chart above is that market. Price ran up 6.4 ATR over 18 bars and the deepest pullback against that run was only 29 percent of the distance travelled, so a sequence adding into the climb stayed underwater at every step of it.
Why That Run Is Fatal
A grid selling into the move fills every level above and closes none of them. A martingale doing the same doubles into it, so the loss grows faster than the move does.
Neither system contains anything that notices. The rule fires, the size goes on, and the account carries whatever comes next.
Price did drift back afterwards, handing back roughly a third of the run over the following ten bars. A ladder built during the climb needed all of it back, not a third.
Runs Like That Are Not Rare
Trends of that shape appear across currencies, metals and indices every year. A central bank decision, a data surprise or a policy shift can produce one in hours.
So the honest question is not whether such a run happens. The question is where your account sits when it does.
Exposure Grows Differently
The two systems build risk at different speeds. That difference matters more than any entry rule.
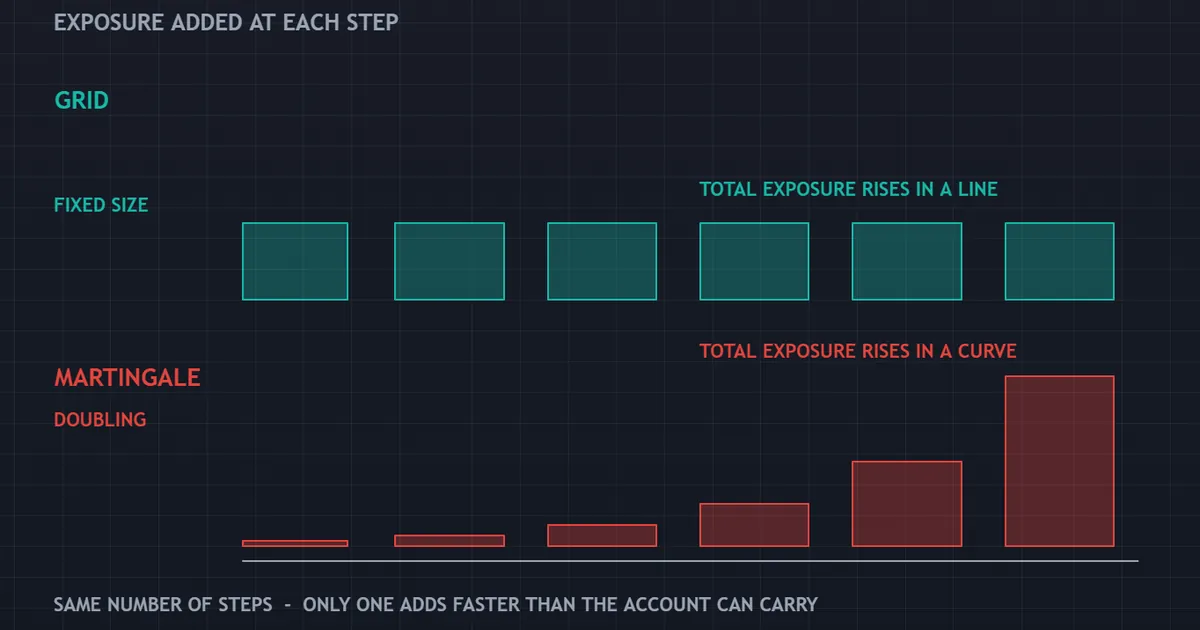
The panel above puts them side by side across the same number of steps. Flat bars for the grid, rising bars for the martingale, and a gap that widens with every level.
Linear Against Exponential
Ten grid levels at a fixed size hold ten units. Ten martingale steps starting at one unit hold over a thousand.
Nothing about the entry logic causes that. The sizing rule alone produces it.
What the Difference Buys You
A grid gives you more time before margin becomes the binding constraint. It does not give you an exit, and time without an exit only delays the same decision.
The Arithmetic of Doubling
Numbers settle this faster than adjectives. Follow one sequence from a single unit.
| Step | Size this step | Total size on the account | Prior losses to clear |
|---|---|---|---|
| 1 | 1 unit | 1 unit | none yet |
| 2 | 2 units | 3 units | 1 unit |
| 4 | 8 units | 15 units | 7 units |
| 6 | 32 units | 63 units | 31 units |
| 8 | 128 units | 255 units | 127 units |
| 10 | 512 units | 1,023 units | 511 units |
Ten losing trades in a row sounds unlikely. Across thousands of sequences it stops sounding unlikely at all, and it only has to happen once.
Test that against your own balance with our risk of ruin calculator. The number surprises most people the first time.
What Ends Each System
Different limits bite at different moments. Knowing which one arrives first changes how you read any product page.
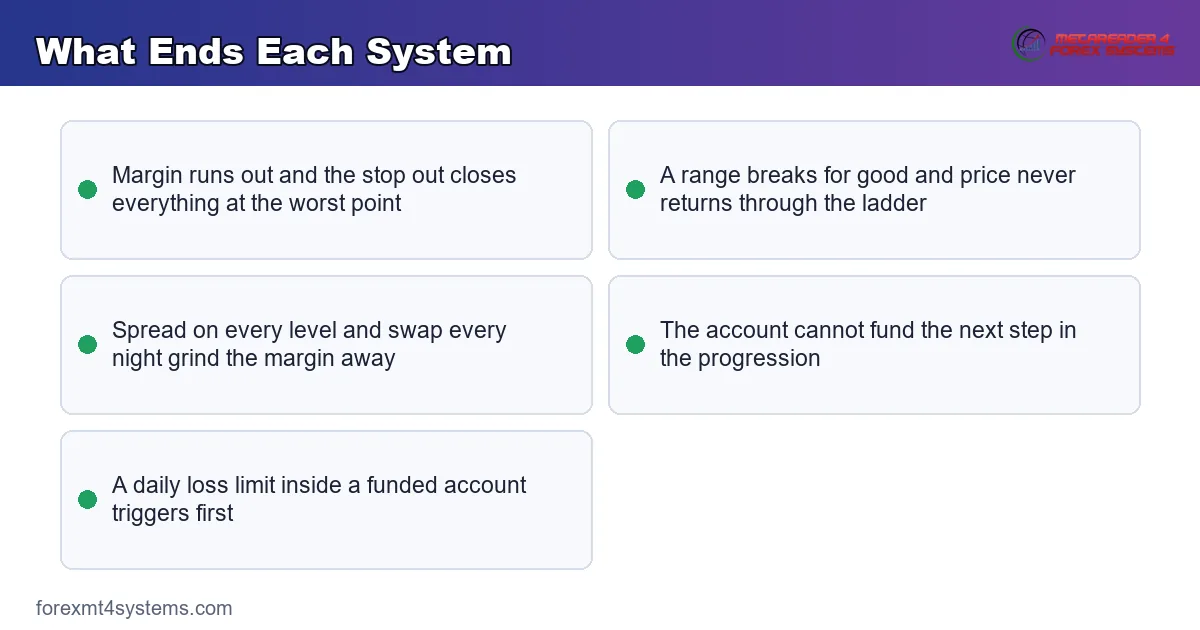
Margin Ends the Martingale
Doubling reaches the broker’s limit quickly. The stop out then closes the sequence at its worst point, which removes the recovery the whole design relied on.
Our note on margin calls and stop outs covers what happens at that moment.
A Broken Range Ends the Grid
Grids survive on ranges. When a range gives way and price leaves the region for good, the open side keeps growing and the small closed profits stop mattering.
Cost Ends Both Slowly
Every level pays a spread, and held positions pay swap. High activity plus long holds makes friction a permanent drag on the whole design.
Settings That Change the Risk Profile
Five inputs decide almost everything about behaviour. Read them before you read any equity curve.
Spacing Between Levels
Tight spacing fills more orders inside a small move. That speeds up the small profits and speeds up the growth of the open position just as effectively.
Size Multiplier
A multiplier of one keeps a grid linear. Anything above one turns the design into a martingale in all but name.
Maximum Levels
This single cap converts an unbounded design into a bounded one. Without it, the broker sets your limit on your behalf.
Take Profit Distance
Short targets close trades often and make the record look busy and healthy. They also leave the open side of the ladder completely untouched.
Instrument Choice
Ranging pairs suit the design, and trending ones dismantle it. Nobody can tell in advance which behaviour the next quarter brings.
What These Systems Assume About You
Every automated design assumes something about its owner. These two assume quite a lot.
That You Will Not Intervene
The design needs every level to run as written. A position you close by hand breaks the sequence, so the remaining orders then chase a target that no longer exists.
That Your Balance Runs Deeper Than It Does
Both designs quietly assume large reserves. An account that cannot fund the whole ladder meets the margin limit instead of the recovery.
That the Next Range Resembles the Last
Settings tuned on a calm period assume calm continues. Nothing inside either system measures that change when it arrives.
Why Backtests Flatter Both
Grid and martingale reports look wonderful on history. Four reasons explain why, and none involves dishonesty.
The Sample Missed the Move
A test that never met a sustained trend never met the failure case. Extending the same test by two years often changes the picture completely.
Fixed Spread Assumptions
Testers usually apply one spread to every fill. Real spreads widen exactly when a grid holds its largest exposure.
The Curve Hides the Depth
An equity line drawn on closed trades looks smooth while the open loss builds underneath. Read the floating drawdown instead, since that number describes the real position.
Survivorship Among Sellers
Sequences that survived get published. The accounts that ended quietly do not appear anywhere, which makes the surviving records look representative.
Measure the depth you could tolerate with our drawdown calculator before believing any curve.
What the Small Closed Profits Really Are
A steady drip of closed trades reads like income. Accounting says something else.
Closed and Open Sit on One Account
Every small gain sits beside a growing floating loss on the same balance. Equity describes what you own, and the closed total does not.
Why the Statement Misleads
Most statements list closed trades first and floating positions last. So the eye reads a long run of green figures before it reaches the number that matters.
How to Read It Properly
Track equity against balance on one chart. When those two lines separate and stay apart, the system has moved risk out of the closed column and into the open one.
Reading a Grid or Martingale Product Honestly
Product pages for these systems follow a pattern. Four checks cut through it in minutes.
Find the Floating Drawdown
Ask for the worst open loss, not the worst closed one. Most reports quote the closed figure because it flatters the design.
Count the Levels
Ask how many positions the system will carry and at what total size. Then work out whether your balance covers that at the worst spacing.
Check the Sizing Progression
Read whether size grows after a loss and by how much. A multiplier above one puts the product in martingale territory whatever the sales page calls it.
Ask What Stops It
A hard stop per sequence changes the risk profile completely. Systems without one hand the decision to the margin engine.
Signs a Product Hides a Recovery Mechanism
Vendors rarely print the word martingale now. Five signs give the mechanism away anyway.
- A multiplier input above one. Read the settings file rather than the sales page.
- Talk of averaging down. Adding to a losing position at a better price describes the same behaviour.
- A very large share of winning trades. Long strings of small closed profits point to an open position carrying the risk.
- No stop loss anywhere in the inputs. Recovery designs depend on the position staying open.
- Drawdown quoted on closed trades only. The floating figure describes the real exposure.
None of these signs prove a bad product. Each one simply tells you which question to ask next.
Margin, Stop Out and the Real Limit
The broker decides when the experiment ends, not the strategy. That fact deserves more attention than it gets.
Floating Loss Consumes Free Margin
Open positions tie up margin, and an open loss eats the equity that supports them. Both effects run at once, which is why the last few levels arrive quickly.
The Stop Out Picks the Worst Moment
Forced closure happens at the extreme of the move by definition. So the account books the maximum loss of the sequence rather than an average one.
Leverage Changes the Timing, Not the Outcome
Higher leverage lets more levels open before margin binds. It also enlarges the position that gets closed, so the account arrives at the same place faster.
These Designs Inside Funded Accounts
Funded programmes rarely welcome recovery systems. Rules vary by firm and change often, so read your own rulebook rather than a forum thread.
Daily Loss Limits Cut the Sequence Short
A floating loss counts against most daily limits. A doubling sequence can therefore breach the limit long before it reaches the recovery it was designed around.
Consistency Rules Catch the Pattern
Many rulebooks ask for even results across days. A long run of small closed profits followed by one enormous loss looks exactly like the shape those rules exist to catch.
If You Study These Systems Anyway
Plenty of traders want to understand the mechanism rather than adopt it. That is a reasonable goal, and it needs guard rails.
Cap the Sequence
Decide the maximum number of levels and the maximum total size before anything runs. A rule the program obeys itself beats a plan you intend to follow.
Test on the Worst Period You Can Find
Point the test at the most violent trending stretch in the data, not at a calm year. A system worth studying has to survive its own failure case.
Run It Where Mistakes Are Cheap
Demo accounts and minimum lots teach the same lessons at a fraction of the cost. Our guide to expert advisors covers how the automation side works.
You can also study the entry logic on its own. The MT4 indicator library gives you the building blocks without the recovery mechanism attached.
Which One Is Riskier
People want a single answer here. The honest one comes with a condition attached.
Per Step, the Martingale
Doubling produces a far larger position after a handful of losses. Measured at any given step, martingale exposure dwarfs grid exposure.
Over Time, Both Depend on the Same Thing
Each design needs price to come back. Neither contains a rule that recognises a market which refuses, so both hand the outcome to conditions rather than to logic.
What Neither One Is
Neither system is a scam by construction, and neither is an income plan. They are exposure profiles, and the arithmetic above describes them better than any adjective could.
How to Frame the Choice
Ask what you are trading away. Both designs swap a long series of small, reliable-looking gains for the possibility of one very large loss.
Some traders accept that trade knowingly and cap it hard. Others accept it without noticing, then meet the cap the broker set for them.
Write down which group you belong to before anything runs. That single sentence does more work than any setting in the file.
FAQ
What is the main difference between grid trading and martingale?
Sizing. A grid adds the same volume at each level, so total exposure grows in a straight line. A martingale multiplies volume after every loss, usually by two, so exposure grows as a curve. Both add into an adverse move, and only the speed differs. The practical effect shows up at the margin limit, which a doubling sequence reaches after a handful of steps while a fixed-size ladder takes far longer.
Can a grid system survive a strong trend?
Not without an exit rule. A grid depends on price returning through the levels it filled, and a sustained move in one direction supplies no return. The closed profits continue to look healthy while the open loss grows underneath them, so the account statement flatters the position right up to the margin limit.
Does a martingale recover the loss if I keep doubling?
Only while the balance and the broker allow another step, and both run out. The sequence needs a winner before margin binds, and nobody can know how many steps a given move will demand. That uncertainty is the whole problem, since the design assumes a resource that no account actually has.
Why do these systems show such good backtests?
Because most test windows contain more ranges than sustained trends, and because equity curves drawn on closed trades hide the open loss. Fixed spread assumptions help too, since real spreads widen exactly when exposure peaks. Read the floating drawdown and the length of the test period before anything else.
Is a hedged grid safer than a directional one?
It feels calmer and costs more. Holding both sides smooths the equity line while swap accumulates on the held positions, and the underlying exposure remains. When the range finally breaks, the hedged version simply arrives at the same problem with a longer bill attached. Watch the swap column on any hedged account, because that quiet cost runs every night whatever price does.
Should a retail trader use either system?
That decision belongs to you, and it deserves the arithmetic rather than a slogan. Both designs trade a long series of small gains for the chance of one very large loss, which suits some risk appetites and ruins others. If you study them, cap the sequence, test them against the worst trending period you can find, and size them so that the failure case leaves your account intact. Results are not guaranteed; past performance is not indicative of future results.
External references
- For background on this concept, see The Martingale Approach at Investopedia.
- For broader market context, see Order Properties in the MQL5 Documentation.

About the author
Written by Dominic Walsh, a Forex trader and MT4/MT5 indicator, Expert Advisor and script developer. Every tool on forexmt4systems.com is tested on live charts before release and ships with ready-to-use compiled MT4 (.ex4) and MT5 (.ex5) files. Learn more about the trader and developer behind this site.
How we build, test and correct every tool: Editorial & Testing Policy. Trading carries risk; see the disclaimer.