
What is grid trading? At heart it describes a way of placing orders rather than a way of reading a market. A grid lays a ladder of buy and sell orders at fixed intervals, then lets price fill them as it wanders up and down.
So the honest answer to what is grid trading has two halves. Coding the mechanism takes an afternoon. Living with the exposure it creates is a different matter, and it turns entirely on what price does next.
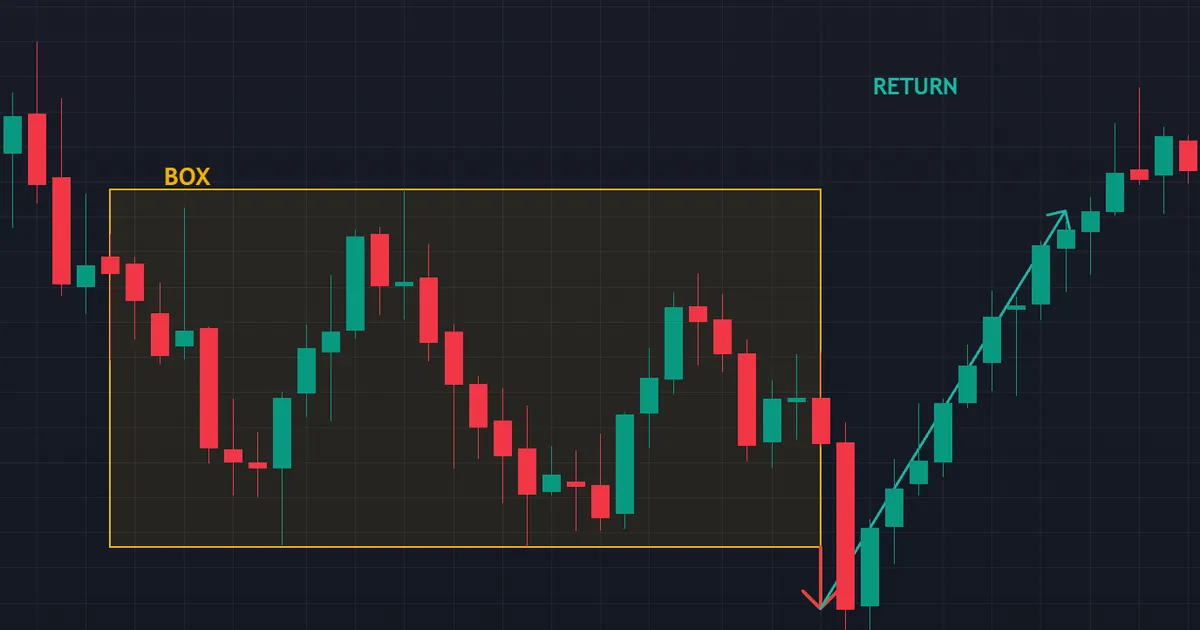
The box held for 28 bars, then price closed down out of it on 2023-07-09 but the break failed: it came back 3.4 ATR against the break within 10 bars.
That weekly dollar index chart shows the market a grid is built for. Price leaves the range, comes back, and every level inside gets traded more than once.
What Is Grid Trading? The Mechanism in Plain Terms
Picture a ladder drawn across the chart. Rungs sit at equal distances, perhaps twenty pips apart, above and below the current price.
The Ladder Itself
Each rung holds a pending order. Buys sit below the market, sells sit above it, and a small take profit attaches to each one.
Price drifts down, so a buy fills. Price ticks back up by one rung, so that buy closes for a small gain and the level resets.
Repeat this a few hundred times and the account records a long line of tidy little profits. Nothing about the process requires a forecast.
Two Common Layouts
A neutral grid places orders in both directions and holds no view at all. It simply harvests movement in either direction.
A directional grid only adds in one direction, usually as price moves against an opening bias. Traders sometimes call that averaging in, and it behaves quite differently from a hedged version.
Why the Idea Attracts People
The equity curve looks marvellous for a while. Wins arrive constantly, losses appear rarely, and the strike record flatters everybody involved.
That shape sells products. But the shape describes the closed trades only, and the risk lives in the open ones.
How a Grid Builds Positions Step by Step
Six mechanical steps describe almost every grid program on the market. Nothing here is proprietary.
- Choose the spacing. A fixed pip distance, or a multiple of average true range.
- Place the ladder. Pending orders go above and below the current price, often several levels deep.
- Fill and open. Each touched level opens a new position, so the number of open trades climbs.
- Close the small target. A move of one rung in your favour books a small profit and frees that level.
- Refill the level. The program replaces the order, ready for the next pass.
- Carry the rest. Any level filled but not yet closed remains open, and the total sits against your margin.
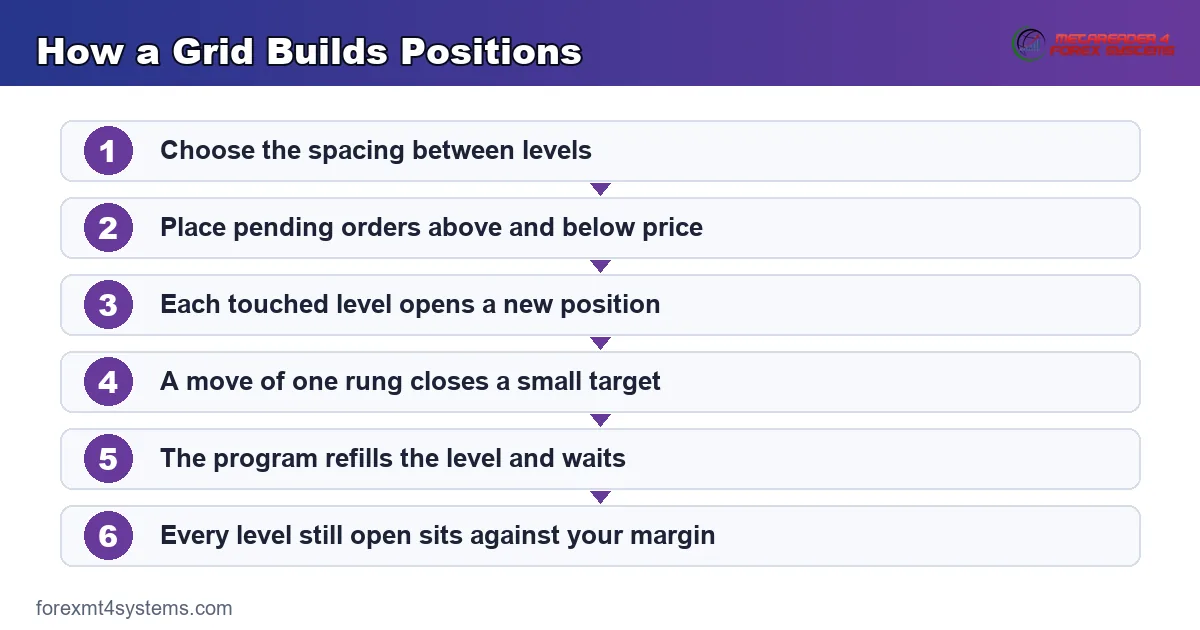
Step six carries the whole story. Steps one to five look like a business, while step six decides whether the account survives.
The Arithmetic Nobody Puts on the Sales Page
Look at the two sides of the ledger separately. Closed trades and open trades behave in opposite ways.
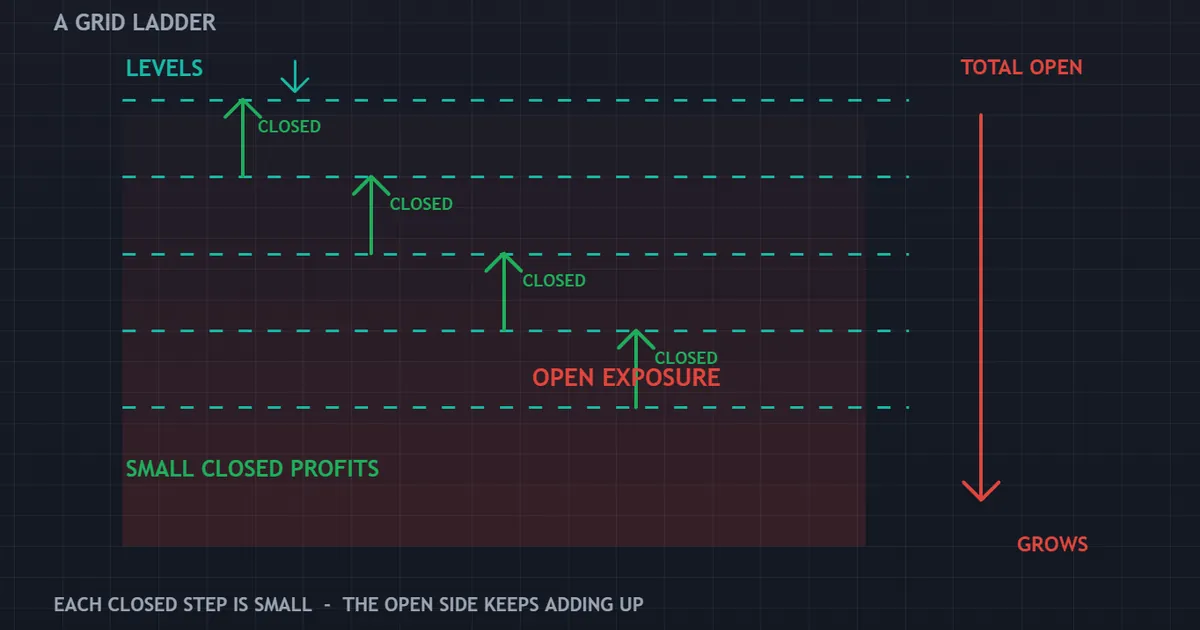
The ladder panel above marks small closed profits between the levels, and total open exposure growing downward beneath them. Both numbers move at once, though only one of them appears in a strike record.
Closed Profit Grows Slowly
Each closed level returns a small fixed amount. Ten closed levels return ten small amounts, and the total climbs in a straight, comforting line.
Nothing accelerates. The gain per level stays the same however far price has travelled.
Open Loss Grows Faster
Now count the open side. When price falls through five levels, the first position sits five rungs underwater, the second sits four rungs down, and so on.
Add those together and the open loss rises with the square of the distance, not in proportion to it. Twice the move produces roughly four times the paper loss.
That single difference explains the shape of most grid disasters. Profit adds, while loss compounds.
Margin Runs Out Before Price Turns
Every open position consumes margin. As the ladder fills, free margin shrinks while the floating loss deepens.
Eventually the broker acts rather than the trader. Our page on margin calls and stop outs covers what happens at that point, and the sequence rarely favours the account.
Download the complete indicator database
Put these concepts on your charts. One email unlocks the full library of 1,380+ indicators with compiled MT4 and MT5 files, plus my TradingView scripts. No paywall, no spam, unsubscribe any time.
Get free access to my indicator database
One email unlocks 1,380+ free MT4, MT5 and TradingView indicators — the complete library. No single-tool download; you get the whole database.
What a Grid Needs to Work
State the requirement plainly and the risk becomes obvious. A grid needs price to keep coming back.
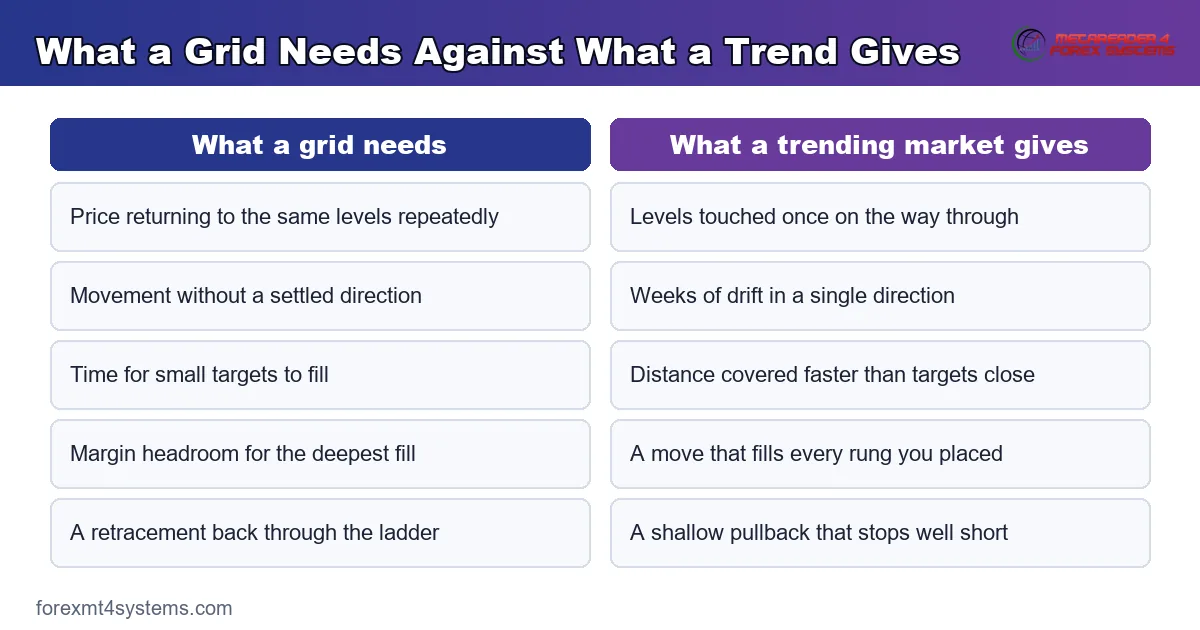
The comparison above sets what a grid needs against what a trending market actually supplies. The two columns disagree almost line by line.
Range, Not Direction
Ranges refill levels repeatedly, which is exactly the behaviour the ladder monetises. A choppy, directionless week is the ideal environment.
Direction breaks the arrangement. Levels fill on the way through and never get revisited, so positions accumulate on one side.
Room in the Account
Deep grids need capital that most retail accounts do not hold. The spacing decides how much of a move the ladder can absorb before margin becomes the binding constraint.
Halving the spacing doubles the number of fills across the same distance. That change feels minor in the settings and lands heavily on the balance.
An Exit Nobody Enjoys Using
Any survivable grid needs a hard limit. A basket stop, a maximum drawdown cut-out, or a rule that closes everything at a set floating loss.
Programs sold without one are not safer. They simply move the decision to the broker’s stop out level, which sits wherever your leverage puts it.
What Kills a Grid
One market condition ends the arrangement, and it arrives regularly. A sustained move in one direction gives the ladder nothing to work with.
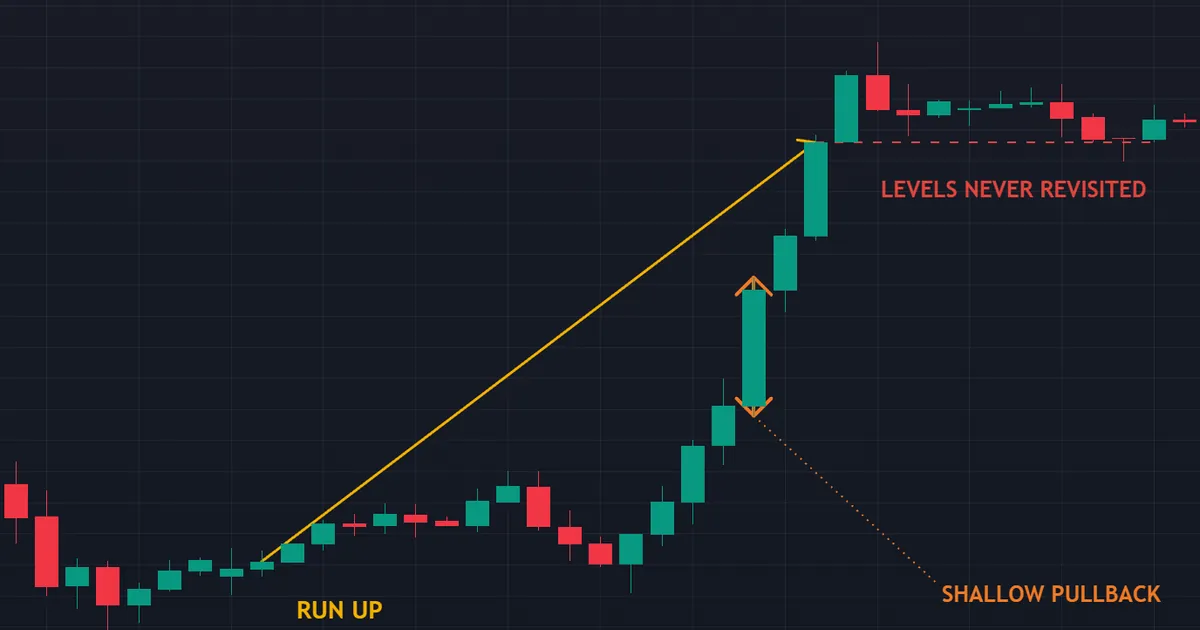
Price ran up 6.9 ATR over 18 bars and the deepest pullback against that run was only 33 percent of the distance travelled — a position sold into it was never given a recovery.
That hourly sterling chart is the environment a grid cannot handle. Sell levels fill all the way up, none of them closes, and the floating loss deepens with every rung.
Read the Pullback Figure Carefully
A third of the distance sounds like plenty of retracement. It is not, because the ladder needs price back at each level, not merely somewhere nearer.
Recovery would require price to travel back through every filled rung. The move above never offered that, and no rule says a later move will either.
Trends Are Not Rare
Central bank repricing, a shifting rate differential, a commodity shock: each one can produce weeks of one-way drift. Currency markets do this several times a year.
So the failure case is not an outlier. It is an ordinary market that happens to be the wrong market for this order arrangement.
Never Assume the Bounce
Plenty of grid marketing implies price must come back. Nothing in market structure requires it, and a currency can settle at a new level for months.
Treat any promise of recovery as an assumption rather than a property. The account carries the position while the assumption gets tested.
A Worked Example of the Exposure
Numbers make this concrete faster than any explanation. Take a simple ladder and follow it down.
The Setup
Suppose the spacing runs at twenty pips, each level trades a tenth of a standard lot, and the take profit sits one rung away. Buy levels stretch downward from the current price.
On a major pair, a tenth of a lot moves about one unit of account currency per pip. Keep that figure in mind while the ladder fills.
Price Drops One Hundred Pips
Five buy levels fill on the way down. The first now sits one hundred pips underwater, the second eighty, then sixty, forty and twenty.
Add those distances together and you get three hundred pips of floating loss. Meanwhile the closed side has booked nothing at all, because price never came back up a single rung.
Price Drops Another Hundred
Five more levels fill, and the first position now sits two hundred pips down. Total the ladder again and the floating loss reaches eleven hundred pips.
Notice what happened there. Price doubled its move, and the paper loss grew by well over three times.
The Lesson From the Arithmetic
Each extra rung costs more than the rung before it. That relationship holds whatever spacing or lot size you choose, since it comes from the geometry rather than the settings.
So the danger is not the first level or the fifth. Danger arrives from the levels beyond the point where you stopped imagining price could go.
Grids Meet Broker and Programme Rules
Rules outside the code can end a grid before the market does. Two areas catch people out.
Hedging and Order Restrictions
Some jurisdictions block holding both directions on one account, and some brokers net positions rather than listing them separately. A hedged grid behaves differently under netting, sometimes in ways the program never anticipated.
Check the account type first. A program written for one model can misread its own positions on the other.
Funded Account Limits
Funded programmes usually enforce a maximum daily loss measured on floating equity. A grid’s floating loss therefore counts against the limit long before any position closes.
Consistency rules cause trouble as well. A method built on many tiny wins and one huge loss sits awkwardly beside a rule demanding even results.
Costs That Compound Along the Way
Grids trade a lot, and frequency multiplies every cost. Three of them deserve attention.
Spread on Every Level
Each fill pays the spread. A grid that opens and closes forty positions a day pays forty spreads, whatever the closed profit shows.
Tight spacing makes this worse. If the target sits at ten pips and the spread runs at one and a half, cost eats a large share of every win. Our note on why spreads widen explains when that share grows.
Swap on Held Positions
Unclosed levels stay open overnight, sometimes for weeks. Swap accrues on each of them separately.
A stack of ten positions pays ten times the nightly charge. Check the rate in your terminal with our swap calculator before you assume it rounds to nothing.
Commission and Slippage
Commission-based accounts charge per lot in and out. Slippage adds a little more during fast moves, precisely when several levels fill at once.
Together these three costs form a fixed hurdle on every rung. A grid must clear that hurdle before a single unit of profit reaches the balance, and tighter spacing raises the hurdle relative to the target.
Common Variants and What They Change
Vendors dress the same mechanism in different clothes. Four variants come up constantly.
Hedged Grids
Both directions run at once, so the account holds longs and shorts together. Net exposure looks small while gross exposure and cost both grow.
Hedging also freezes the loss rather than removing it. Someone still has to unwind the pair, and that decision usually arrives late.
Grids With Position Scaling
Some versions increase size at deeper levels. That change converts a grid into something closer to a doubling sequence, with far sharper consequences.
Read our comparison of grid trading against martingale before running any product that sizes up as it loses.
Volatility-Spaced Grids
Spacing tied to average true range widens in fast markets and tightens in quiet ones. That adjustment helps a little, and it changes nothing about the trend problem.
Grids That Close as a Basket
Basket logic closes every open level together once the group reaches a small net gain. Individual levels then matter less than the combined position.
That design smooths the equity curve and hides the exposure even better. The account still holds everything until the basket target arrives, so the underlying risk stays exactly where it was.
Grids With a Directional Filter
A filter allows buy levels only while a longer-term trend points up. Sensible in principle, and it converts the system into a trend-following method with grid entries.
How to Inspect a Grid Program Before Running It
Six questions expose most of what matters. None of them requires the source code.
| Question | What good looks like | Warning sign |
|---|---|---|
| Is there a basket stop? | A stated maximum floating loss, enforced in code | Reliance on the broker stop out |
| How deep can the ladder go? | A fixed maximum number of open levels | Unlimited levels while margin lasts |
| Does size increase with depth? | Same volume at every level | Doubling or multiplying at deeper rungs |
| What is the worst historical stretch? | Floating drawdown published, not just closed results | Only a closed-trade equity curve shown |
| What spread was assumed? | Realistic variable spread plus commission | A single tight fixed spread |
| Which market suited it? | Ranging conditions named honestly | Claims of working in any market |
Test the deepest published floating loss against your own balance with our drawdown calculator. Seeing the figure in your own currency changes the conversation.
Where Grid Programs Sit Beside Other Automation
Grids form one branch of a wider family. Comparing them helps place the risk.
Against a Rule-Based Robot
A trend robot takes a defined loss on most trades and waits for a larger win. A grid inverts that shape, collecting many small wins and holding one large open loss.
Neither shape is inherently better. But the second hides its risk in the open positions, which makes evaluation harder. Our guide to expert advisors covers what any program can and cannot do.
Against a Doubling Sequence
A grid adds fixed size per level, so exposure climbs in a straight line. A doubling sequence climbs geometrically, which shortens the fuse considerably.
Our article on the martingale strategy in forex walks through that arithmetic in full.
Against Manual Range Trading
A discretionary trader can simply stop adding when the range breaks. Code follows its instructions instead, and most grid code has no concept of a broken range at all.
Reading a Grid Backtest Honestly
Grid reports flatter themselves more than most. Three habits keep you out of trouble.
Read the Floating Drawdown, Not the Closed One
Closed drawdown on a grid can look tiny, because losing levels rarely close. Floating drawdown tells the real story, so find that line in the report first.
If the report never shows it, treat the whole document as marketing. The number exists in every tester, and leaving it out is a choice.
Check the Period Covered
A test across one quiet year proves almost nothing. Pick the stretches where a currency repriced hard and rerun the same settings there.
Your goal is disproof rather than confirmation. A grid that survives the ugly periods has at least earned a second look.
Count the Open Positions at the Worst Moment
Find the deepest point of the test, then count how many levels sat open. Compare that number against the maximum your margin allows.
Many programs pass a test simply because the simulated account had more room than yours does. Our note on margin in forex covers how that headroom gets calculated.
If You Still Want to Study Grids
Curiosity is fine, and the mechanism teaches useful lessons about exposure. Three precautions keep the study cheap.
Test on Trending History Deliberately
Do not test on a quiet year. Pick the periods where price ran hard in one direction and see what the ladder does there.
That test tells you the shape of the worst case. Everything else merely tells you the shape of a good week.
Cap the Exposure in Code
Set a maximum level count and a floating loss cut-out. Then check that both limits actually fire in a test rather than sitting in the settings unused.
Size for the Full Move
Work out how far price can travel before margin binds, then compare that distance with an ordinary trending week. Our position size calculator makes the arithmetic quick, and the answer surprises most people. Browse the MT4 indicator library if you would rather build entries you can inspect one at a time.
FAQ
Is grid trading profitable?
Nobody can tell you that in advance, and any confident claim in either direction ignores how the mechanism works. A grid produces steady small gains while price ranges, then accumulates open losses when price trends. Whether the account ends ahead depends on which market arrives and on whether a hard limit exists.
How much capital does a grid need?
More than most people assume, because the requirement scales with the size of the move you plan to survive. Work backwards instead of guessing: pick the distance price could travel against you, count the levels that would fill, and check whether the margin holds. If the answer needs the whole balance, the spacing or the lot size is wrong.
Does hedging make a grid safer?
Hedging locks a loss in place rather than removing it. You still hold both sides, you still pay spread and swap on both, and you still need a plan for unwinding the pair at some point. Many accounts hedge to avoid a decision, then face the same decision later with less margin available.
What spacing should a grid use?
Spacing trades one risk for another, so no single answer fits. Tight spacing fills more often and builds exposure faster, while wide spacing trades less and needs a bigger move before the ladder starts working. Anchor the choice to recent average true range rather than to a round number of pips.
Can a stop loss fix the trend problem?
A basket stop limits the damage, which helps a great deal. It does not turn the method into a trend-friendly one, since the stop simply ends the sequence at a loss you chose in advance. That is the point of it, and any grid without one leaves the choice to your broker.
Why do grid results look so good in a short test?
Short tests usually miss the market that breaks the mechanism. A few quiet months produce a smooth rising curve made of many small closed trades, and the floating exposure never gets stressed. Extend the test across a strongly trending period, then read the floating drawdown rather than the closed profit. Results are not guaranteed; past performance is not indicative of future results.
External references
- For background on this concept, see Range Trading in the BabyPips Forexpedia.
- For broader market context, see Averaging Down at Investopedia.

About the author
Written by Dominic Walsh, a Forex trader and MT4/MT5 indicator, Expert Advisor and script developer. Every tool on forexmt4systems.com is tested on live charts before release and ships with ready-to-use compiled MT4 (.ex4) and MT5 (.ex5) files. Learn more about the trader and developer behind this site.
How we build, test and correct every tool: Editorial & Testing Policy. Trading carries risk; see the disclaimer.