
The Williams %R vs Stochastic comparison confuses a lot of traders, because the two oscillators look almost identical on a chart yet run on flipped scales. Both measure where price closes inside its recent range, so they often turn at the same moment.
So this guide breaks the Williams %R vs Stochastic pairing down to its bones. By the end, you will know why one reads from zero down to minus one hundred, why the other reads from zero up to one hundred, and when each cousin earns a place on your chart.
Williams %R vs Stochastic: The Core Difference
Both tools answer the same question with different arithmetic. Each one asks where the current close sits within the high-low range of the last fourteen bars. So a close near the top of the range reads as strong, and a close near the bottom reads as weak.
Here is the twist that trips people up. Williams %R plots that reading on an upside-down scale, from 0 at the top to minus 100 at the bottom. The Stochastic plots the same idea right side up, from 100 at the top to 0 at the bottom. So the two lines are mirror images of one another.
The overbought and oversold zones follow that flip. On Williams %R, readings above minus 20 mark overbought and below minus 80 mark oversold. On the Stochastic, readings above 80 mark overbought and below 20 mark oversold. So the same market state wears two different number tags.
The chart below stacks both tools under EURUSD on the one-hour timeframe near 1.14. A Williams %R set to 14 sits above a Stochastic set to 14, 3, 3, and the two lines rise and fall in near lockstep.

Notice how the peaks and troughs line up. When Williams %R presses toward its zero ceiling, the Stochastic presses toward its 100 ceiling at the same time. So once you flip the scale in your head, the two tools tell one story.
This near-identical shape is exactly why the choice between them rarely matters much. Because both react to the same closes inside the same range, a signal on one usually shows up on the other within a bar. So the real decision is style and habit, not raw accuracy.
Single Line Versus Two Lines
The clearest visual difference is the number of lines. Williams %R draws one raw line that reacts instantly to each new close. The Stochastic draws two lines, the fast %K and its smoothed average %D, which cross to give signals.
So that extra line changes how each tool feels. Because Williams %R has no signal line, it looks jumpier and fires earlier. The Stochastic trades a little speed for a %K and %D crossover, which filters some of the noise before a signal appears.
Who Built Them
Both tools carry the name of a trading pioneer. Larry Williams popularized %R in the 1970s as a blunt momentum gauge for commodities. George Lane developed the Stochastic around the same era, adding the smoothed signal line that gives it a cleaner trigger.
So the shared heritage is no accident. Because both men worked the same range-based idea, their tools ended up as close relatives. So knowing the history helps you see why two names describe what is really one underlying calculation.
How Each Oscillator Is Built
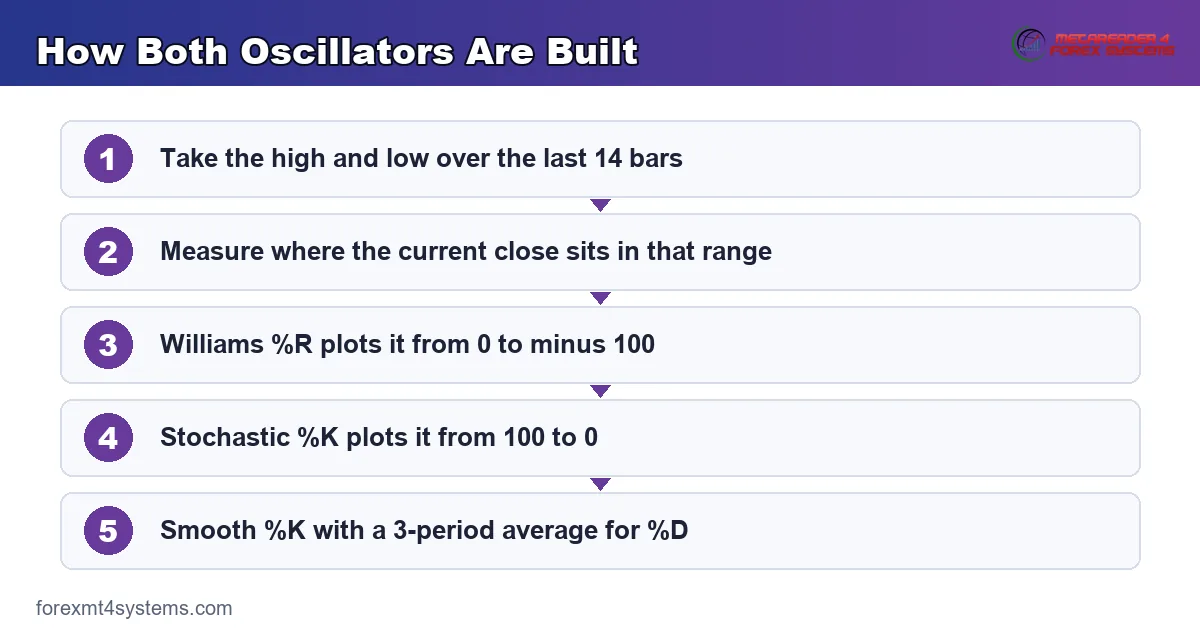
Learn the math once and the behavior makes sense. Both tools share the same range logic, and the steps below cover each in turn.
- Find the range. Take the highest high and lowest low over the last 14 bars.
- Locate the close. Measure where the current close sits inside that range.
- Williams %R. Express that position as a value from 0 at the top to minus 100 at the bottom.
- Stochastic %K. Express the same position as a value from 100 at the top to 0 at the bottom.
- Stochastic %D. Smooth %K with a short 3-period average to create the signal line.
The concept graphic below shows the two scales side by side, so you can see how one flips into the other around the middle of the range.
One fact ties them together neatly. Williams %R is essentially the Stochastic %K turned upside down and shifted. So if you added 100 to a Williams %R reading, you would land close to the raw Stochastic value. The tools are two views of one calculation.
The Settings That Matter
The default periods shape the feel of each tool. A 14-period lookback suits most charts, giving a balance between speed and steadiness. The Stochastic then adds its 3-period %K smoothing and 3-period %D average, written as 14, 3, 3.
Shorten the lookback and both tools grow twitchy. Because a smaller window reacts to every wiggle, a 5-period setting fires constant signals that mostly amount to noise. So lengthen the period for a calmer read on higher timeframes, and change one number at a time with a clear reason.
Fast Versus Slow Stochastic
The Stochastic comes in two flavors worth knowing. The fast version plots raw %K against its %D average, which reacts quickly but jumps around. The slow version smooths %K one extra time, which trims the noise at the cost of a little lag.
Most traders default to the slow Stochastic. Because the extra smoothing cuts down on false crossovers, the slow version behaves more like a steadier cousin to the raw Williams %R line. So the 14, 3, 3 setting most platforms ship is already the slow variant in practice.
Williams %R has no such split. It plots one raw line and leaves the smoothing to you if you want it. So if you crave a calmer %R, you simply apply a short moving average to the line yourself.
Williams %R vs Stochastic Compared
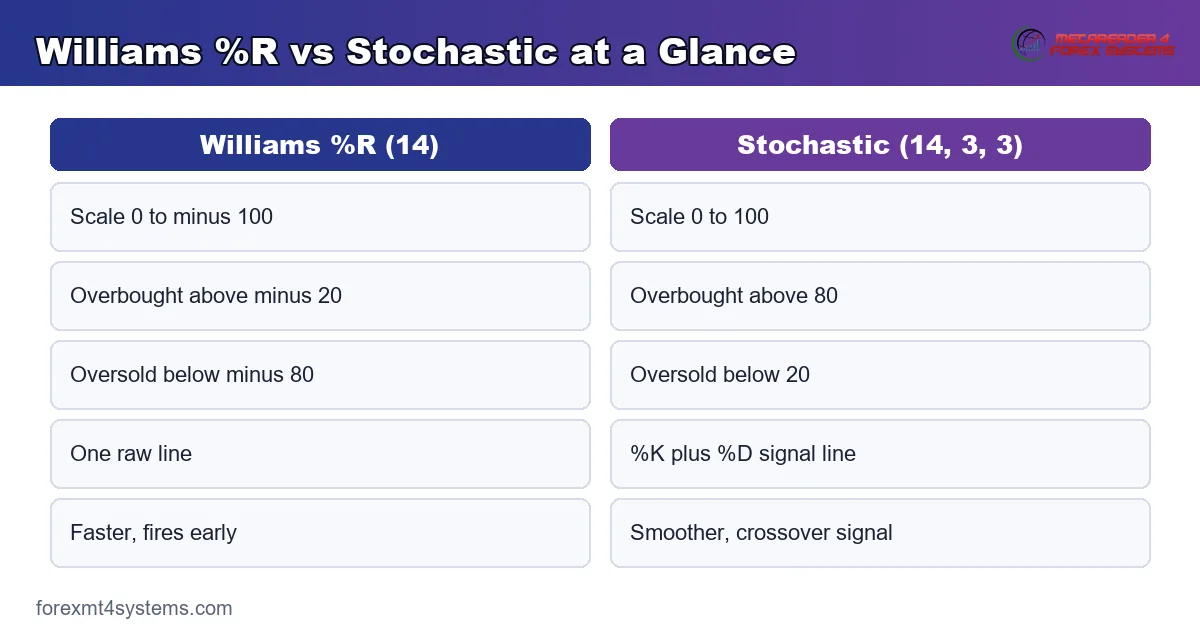
The table below sums up the split at a glance. Keep it nearby until the scales feel automatic.
| Feature | Williams %R (14) | Stochastic (14, 3, 3) |
|---|---|---|
| Scale | 0 to minus 100 | 0 to 100 |
| Overbought | Above minus 20 | Above 80 |
| Oversold | Below minus 80 | Below 20 |
| Lines | One raw line | %K plus %D signal line |
| Speed | Faster, jumpier | Smoother, filtered |
| Main signal | Zone exit | %K and %D crossover |
How Each Fits a Real Workflow
Neither oscillator names a trend direction, so both belong beside a trend read. So the workflow starts with context: figure out whether the market trends or ranges before you trust any overbought or oversold tag.
In a range, the tools shine as fade signals. When price stretches to the top of a sideways range and the oscillator hits overbought, a reversal back toward the middle grows likely. So range traders sell the overbought edge and buy the oversold edge.
Trends Change the Rules
A strong trend flips the meaning of an extreme reading. In a powerful uptrend, the oscillator can pin itself in overbought for a long stretch while price keeps climbing. So an overbought tag in a trend signals strength, not an automatic sell.
This trap catches beginners on both tools equally. Because the scales differ but the logic matches, a Williams %R pinned near zero means the same thing as a Stochastic pinned near 100. So read the trend first, then decide whether an extreme is a fade or a green light. Our guide to what is Williams %R digs deeper into that pinning behavior.
Using Divergence With Either Tool
Both cousins spot divergence the same way. When price makes a higher high but the oscillator makes a lower high, momentum is fading beneath the surface. So that gap warns that a trend may be running out of fuel, even while price still climbs.
Read divergence as a caution light, not a stop sign. Because a trend can keep pushing long after momentum thins, the signal alone rarely justifies a trade. So wait for price structure to break before you act, and let the oscillator merely raise the early flag.
Choosing Between the Two
Pick the tool that matches your temperament. If you want the earliest possible read and can tolerate false starts, Williams %R fires first. If you prefer a filtered signal that waits for a crossover, the Stochastic suits you better.
Many traders simply pick one and master it. Because the two overlap so heavily, running both at once mostly doubles the same information. So the oscillator indicators archive lets you test each, and the overbought and oversold indicators archive groups the whole family for comparison.
Worked Example: A GBPUSD Range Fade
Picture GBPUSD stuck in a range on the one-hour chart, drifting between roughly 1.335 and 1.345. Price now pushes up toward the top of that range, and you want a low-risk fade back toward the middle.
Watch the oscillator as price reaches 1.345. The Williams %R climbs above minus 20 into overbought, and the Stochastic pushes above 80 with %K rolling under %D. So both cousins flash the same warning at the range high. The chart below marks the overbought tag and the fade that follows.
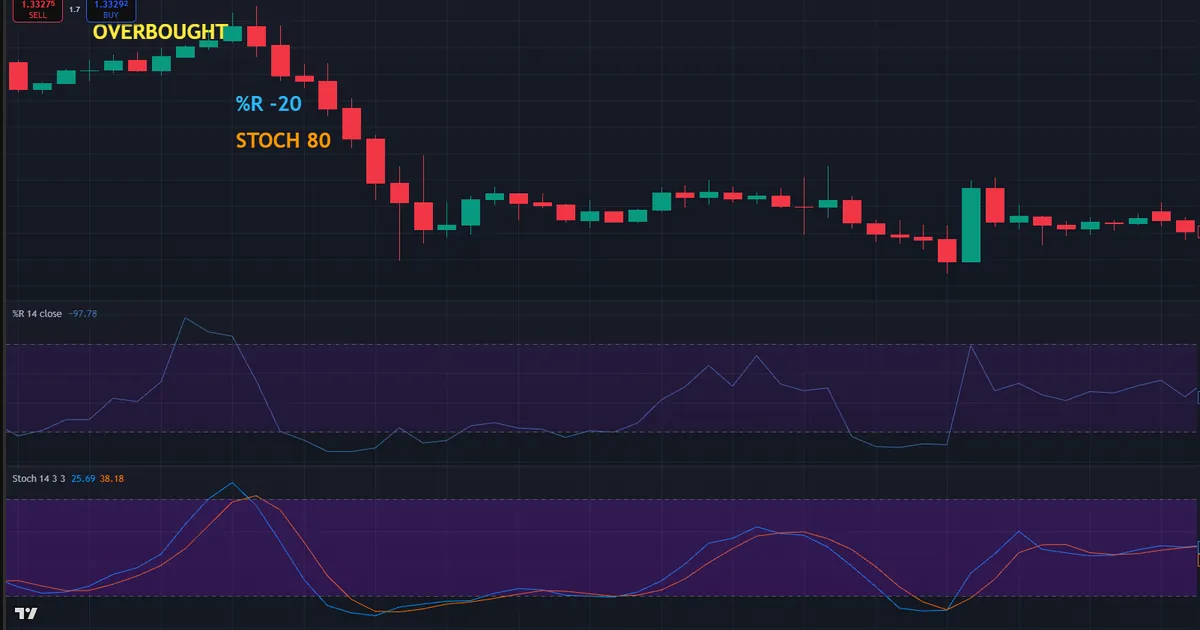
Then build the trade around the range edge. A stop sits just above 1.346, where a real breakout would prove the fade wrong. So the target is the middle of the range near 1.340, which keeps the reward comfortably larger than the tight risk.
Reading the Confirmation
Do not fire on the extreme reading alone. Wait for the oscillator to actually turn back out of the zone, or for the Stochastic %K to cross below %D. So the turn, not the touch, is the real trigger for a range fade.
Price action should agree too. Because a rejection candle at the range high adds an independent voice, a fade backed by both the oscillator turn and a clear rejection carries better odds. So stack the two signals and skip the trade when they disagree.
Managing the Range Fade
Once you are in, let the range guide the trade. Price drifting back toward the middle proves the fade is working, so a partial exit near 1.340 banks the core of the move. So the remainder can aim for the opposite edge if momentum still supports it.
Cut the trade fast if the range breaks. Because a clean push above 1.346 means the range is over, a fade there has lost its whole premise. So honor the stop without hesitation, since a failed range fade often precedes a strong breakout in the other direction.
Download the complete indicator database
Put these concepts on your charts. One email unlocks the full library of 1,380+ indicators with compiled MT4 and MT5 files, plus my TradingView scripts. No paywall, no spam, unsubscribe any time.
Get free access to my indicator database
One email unlocks 1,380+ free MT4, MT5 and TradingView indicators — the complete library. No single-tool download; you get the whole database.
Common Mistakes With Both Tools
Most errors come from misreading the scale or ignoring the trend. Each mistake below has a simple fix, and the graphic sums them up.
Fading Every Extreme Reading
An overbought tag is not an automatic sell. In a strong trend, the oscillator can stay pinned for many bars while faders bleed. So confirm the environment first, and only fade an extreme when the market clearly ranges sideways.
Confusing the Two Scales
Traders new to Williams %R often panic at a minus 90 reading, thinking it signals collapse. In truth, minus 90 marks oversold and hints at a possible bounce. So learn each scale cold, and never map one tool’s numbers onto the other by habit.
Ignoring the Signal Line
On the Stochastic, the %K and %D crossover is the real signal, not the raw level. Traders who watch only the level miss the timing the crossover provides. So use the crossover to time entries and let the level flag the zone.
Running Both at Once
Stacking Williams %R and the Stochastic feels thorough but adds little. Because they measure the same thing, two agreeing lines create false confidence. So pick one oscillator, then pair it with a different family such as a trend or volume tool.
Trading Against a Clear Trend
Selling every overbought tag in a raging uptrend is a fast way to lose. The trend, not the oscillator, sets the dominant odds. So align fades with the higher-timeframe direction, or wait for the trend itself to weaken first.
Oscillator Checklist
Run this quick list before any trade that leans on either tool. A few honest seconds here filters out most weak signals. So keep it in view, and let a missing tick talk you out of a marginal entry.
- Market environment identified as either ranging or trending.
- Correct scale read for the tool in use, either the %R or the Stochastic version.
- Overbought or oversold zone reached at a logical price.
- Turn confirmed by a zone exit or a %K and %D crossover.
- Price action agreeing with a rejection or reversal candle.
- Stop placed just beyond the range edge or swing point.
- Risk fixed as a small percent of the account.
When These Oscillators Fail
Study the failure as hard as the winner. Here is a classic trap. A trader sees Williams %R climb above minus 20 on GBPUSD and sells at once, certain the overbought tag marks a top. Nothing else backs the trade.
Then the market ignores the plan. Price keeps rising, the oscillator pins near zero bar after bar, and the short sits deep underwater. The chart below shows the oscillator stuck in overbought while price grinds higher and the fade bleeds.
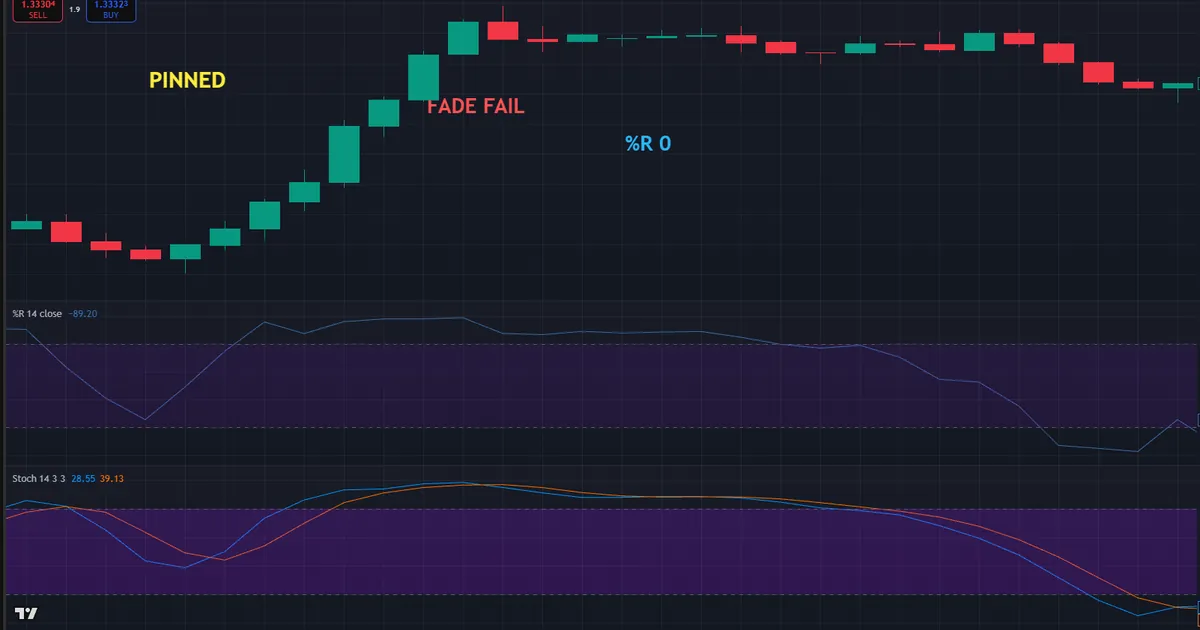
So what went wrong? An overbought reading only means a fade in a range, and this market trended hard. In a strong move, a pinned oscillator signals momentum, not exhaustion. Hence the guard that saves accounts: read the trend before you fade any extreme.
Divergence That Never Pays
Respect the divergence that refuses to resolve. Sometimes the oscillator makes a lower high while price makes a higher high, hinting at a turn that never comes. So a strong trend can print divergence for a long time before anything happens.
Treat divergence as a warning, not a trigger. Because a trend can outlast the signal, wait for price structure to actually break before you act. So let the oscillator raise the flag while price confirms the turn.
The Midline Nobody Watches
Traders obsess over the extremes and forget the middle. Yet the 50 level on the Stochastic, and minus 50 on Williams %R, marks the tipping point between strength and weakness. So a reading holding above the midline hints at buyers in control, even before an extreme appears.
Use the midline as a quiet trend filter. Because momentum crossing the middle often leads price by a hair, that cross adds context to every fade decision. So glance at the midline first, and let it colour whether you trust an overbought or oversold tag at all.
Whipsaws in Fast Markets
Both tools misfire when volatility spikes. A news release can whip the oscillator from oversold to overbought within a few bars, firing signals in both directions. So stand aside around major releases, because no range-based oscillator handles a genuine shock cleanly.
Related Concepts to Study Next
These oscillators connect to a web of sibling tools that sharpen them. The Stochastic pairs naturally with other momentum reads, and understanding its cousins deepens your feel for both scales. Both threads appear in the sections above, ready to round out the picture. So treat each oscillator as one voice, and let a trend or price signal confirm it.
For the fundamentals, our guide to what is the Stochastic oscillator covers that tool from scratch, while our comparison of RSI vs Stochastic weighs it against the other popular momentum read. To size any fade with discipline, our free position size calculator turns a stop into a safe position. So master one oscillator first, then let the others simply confirm what you already see.
FAQ
What is the difference between Williams %R and the Stochastic?
They measure the same thing on flipped scales. Williams %R runs from 0 down to minus 100, while the Stochastic runs from 0 up to 100. Williams %R uses one raw line, and the Stochastic adds a smoothed %D signal line. So the two are mirror-image cousins of a single range calculation.
Which one is faster?
Williams %R reacts faster because it plots a single raw line with no smoothing. The Stochastic trades a little speed for its %K and %D crossover, which filters some noise. So Williams %R fires earlier signals, while the Stochastic waits for a cleaner, confirmed turn before it triggers. That trade-off between raw speed and filtered reliability sits at the very heart of the whole comparison.
What are the overbought and oversold levels?
On Williams %R, above minus 20 is overbought and below minus 80 is oversold. On the Stochastic, above 80 is overbought and below 20 is oversold. So the same market state carries different numbers, which is why learning each scale on its own matters. Mixing the two number sets in your head is one of the fastest ways to misread a chart under pressure.
Should I use both at the same time?
Usually not, since they measure nearly the same thing. Running both mostly doubles one signal and creates false confidence. So pick the one that suits your style, then pair it with a different family such as a trend or volume tool for genuine confirmation. Two tools from the same family rarely disagree, so their agreement tells you nothing new about the trade in front of you.
Do these tools work in a trend?
They work best in a range, where extremes fade back to the middle. In a strong trend, both can pin at an extreme for many bars while price keeps running. So read the trend first, and treat a pinned oscillator as a sign of strength rather than a reversal. A reading that refuses to leave an extreme is often the clearest evidence that the trend still has room to run.
Are these oscillators reliable on their own?
No, they measure momentum, not direction, so they work best with a trend or price-action partner. Used alone, they give false fade signals in trends and whipsaws in fast markets. Pair either tool with a trend read, size every position with care, and manage risk on every trade. Results are not guaranteed; past performance is not indicative of future results.
External references
- For background on this concept, see Williams %R at Corporate Finance Institute.
- For broader market context, see Williams %R at BabyPips.

About the author
Written by Dominic Walsh, a Forex trader and MT4/MT5 indicator, Expert Advisor and script developer. Every tool on forexmt4systems.com is tested on live charts before release and ships with ready-to-use compiled MT4 (.ex4) and MT5 (.ex5) files. Learn more about the trader and developer behind this site.
How we build, test and correct every tool: Editorial & Testing Policy. Trading carries risk; see the disclaimer.