
Elliott wave rules come down to three conditions. Break one of them and the sequence you drew stops qualifying as an impulse, whatever the chart looks like.
Everything else in wave analysis belongs to a softer second category. This guide keeps the elliott wave rules apart from those guidelines, because most articles blur the two and leave readers throwing away perfectly legal counts.
One caution before the detail. Wave counting rests on judgement, two analysts often label the same chart in opposite directions, and counts get revised as fresh price arrives.
What the Elliott Wave Rules Are
A rule here works as a filter. It tells you when a labelled sequence no longer qualifies as a five-wave impulse, and it tells you nothing else.
Elliott left exactly three. Wave two never retraces all of wave one, wave three never ranks as the shortest of waves one, three and five, and wave four keeps out of wave one’s price territory.
Notice how short that list stays. Ratios, channels and alternation all sit outside it, though plenty of traders treat them as binding.
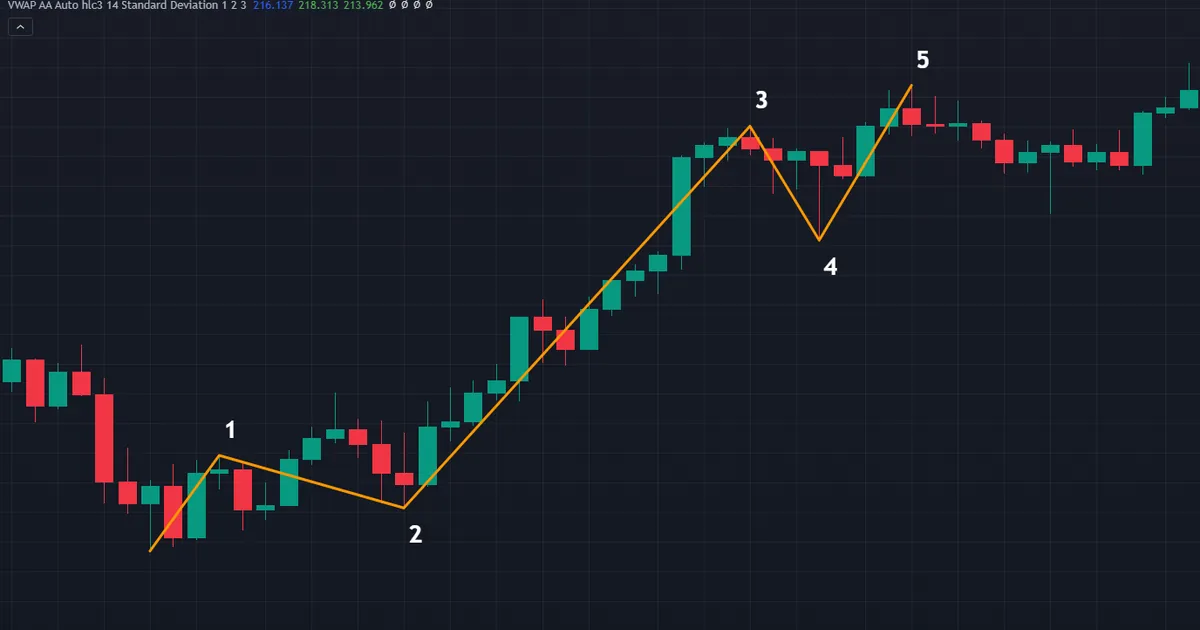
Above sits a clean example. On the GBPJPY weekly chart a five-wave advance tops wave three at 184.02, then carries wave five to 186.771, so all three conditions hold.
Rules Versus Guidelines
Treat the rules as a pass-fail gate. Guidelines behave more like weather forecasts: useful, frequently right, never binding.
So a count that meets all three stays legal even when it looks awkward. A count that breaks one dies immediately, however neat its ratios look.
That split changes what you do next. A rule break forces you to relabel, while a guideline miss only trims your confidence.
Our guide to Elliott wave theory covers the model’s origins and its central claim. This page sticks to the conditions themselves.
What the Rules Never Tell You
Read the three conditions again and notice the gaps. None of them mentions time, none mentions distance, and none names a price where a wave should finish.
So the rules describe shape rather than schedule. They filter labels, and they leave every trading decision to whatever process you already run.
That limit disappoints newcomers. Many arrive expecting a forecasting engine and find a grammar for describing swings instead.
Why the Blur Costs Money
Many traders reject a count because wave two retraced 70 percent. No rule mentions 70 percent, so nothing about that count fails.
Others keep a count alive after wave four cuts into wave one. That count already failed, and any trade built on it rests on nothing.
Both errors flow from the same confusion. Sorting the two categories properly removes a surprising amount of noise from your charts.
How to Test a Count Against the Three Rules
Work in a fixed order every time. After a week the whole check takes about a minute per chart.
- Mark the origin of wave one. That price becomes your first invalidation level, because wave two may not trade through it.
- Measure waves one, three and five in price terms. Use the actual swing distances rather than the visual impression the chart gives.
- Draw a horizontal line at wave one’s extreme. On an advance that means wave one’s high; on a decline it means wave one’s low.
- Check wave four against that line. Any close beyond it in a standard impulse ends the count.
- Write the invalidation price beside the chart. A count with no number attached explains everything after the event and commits to nothing.
Step five carries most of the value. It converts a picture into a plan you can act on and later grade honestly.
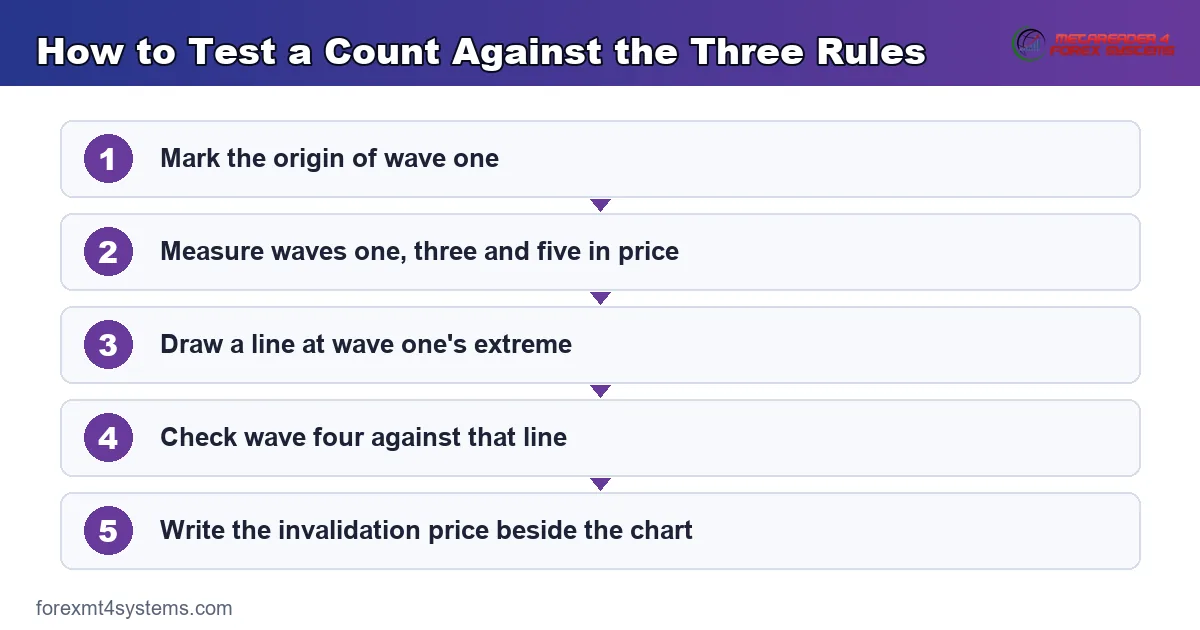
Keep the order fixed even when the answer looks obvious. Traders who start from a preferred conclusion always find the waves that suit it.
The Three Hard Rules in Detail
Each rule attaches to a specific price. That property makes them practical rather than philosophical.
Rule One: Wave Two Never Retraces All of Wave One
Wave two may give back almost everything. A move past wave one’s starting price, though, voids the label at once.
This rule hands you a clean line before the trade begins. Mark wave one’s origin, and you already hold a stop-loss reference.
Depth alone proves nothing. A 90 percent retracement keeps the count alive, while a single tick past the origin ends it.
Rule Two: Wave Three Never Ranks Shortest
Compare waves one, three and five by price distance. Wave three may sit second in that ranking, yet it may not finish shortest.
Note the wording carefully. The rule permits a wave three shorter than wave one, provided wave five ends up shorter still.
In practice wave three usually runs longest and fastest. That tendency, however, belongs with the guidelines rather than here.
Rule Three: Wave Four Stays Out of Wave One’s Territory
Draw the line at wave one’s extreme and leave it on the chart. In a standard impulse, wave four never trades into that zone.
Overlap therefore acts as a live alarm. The moment price closes beyond the line, your five-wave label needs replacing.
One exception exists, and it carries its own conditions. Diagonal formations allow overlap, so leading and ending diagonals follow a separate checklist.
Wick or Close?
Practitioners split on this detail. Elliott worked from price extremes, so a single wick through wave one’s origin technically ends the count.
Others prefer a closing basis, arguing that thin liquidity produces spikes with no information in them. Neither camp holds a monopoly on the truth.
Pick one convention and record it. A trader who switches between wicks and closes depending on the position they hold has stopped following a rule altogether.
Spot forex complicates the choice further, because different brokers print different extremes. Your neighbour’s chart may void a count that yours keeps alive.
How the Diagonal Exception Works
A diagonal looks like a wedge on the chart. Its five legs converge, and waves one and four may share price.
Elliott placed diagonals in specific slots. Leading diagonals appear as wave one or wave A, while ending diagonals appear as wave five or wave C.
So overlap does not always kill a count outright. It kills the standard impulse label, and it pushes you toward the diagonal reading instead.
Our trend indicators archive collects tools that mark swing structure automatically, which speeds up the visual check.
The Guidelines That Get Mistaken for Rules
Now for the softer half. These tendencies show up often enough to guide a count, and none of them can invalidate one.
Alternation
Waves two and four tend to differ in character. A sharp, deep wave two suggests a shallow, sideways wave four, and the reverse holds too.
Use it as a hint about shape. A wave four that mirrors wave two exactly still breaks nothing at all.
Channelling
Draw a line across the ends of waves two and four. Then add a parallel across wave three’s extreme, and you hold a rough landing zone for wave five.
Price ignores channels regularly. Our page on how to use trend lines covers the drawing mechanics and their limits.
Equality
When wave three extends, waves one and five often cover similar distances. Analysts call that the equality guideline.
It hands you a rough zone for the final leg. Treat the result as an area to watch, never as a price that must print.
Fibonacci Relationships
Wave two commonly retraces between half and roughly 62 percent of wave one. Wave four usually gives back less, often near 38 percent of wave three.
Extensions run the other way, with wave three frequently reaching about 162 percent of wave one. Our deep dive on Elliott wave Fibonacci targets works through each relationship.
None of these numbers appears in the rule list. A count that misses every one of them remains perfectly valid.
Wave Personality
Elliott’s followers describe a typical mood for each leg. Wave one starts quietly, wave three attracts crowds, and wave five arrives on thinner participation.
Momentum tools often lag the fifth-wave extreme, which many traders read as a warning. That reading belongs to the guideline pile as well.
Personality helps most when two counts compete. Given a choice, favour the label whose behaviour matches the leg you assigned it.
Rules, Degrees and Sub-Waves
Every wave contains smaller waves. That nesting decides which comparisons the rules actually allow.
Compare Like With Like
The three conditions apply within one degree. Wave four of an hourly count sits far below wave one of a weekly count, so the two never interact.
Label the degree next to every wave you mark. Roman numerals, plain digits and bracketed letters all work, provided you keep one system.
Mixing systems ruins a chart you revisit later. A month on, nobody remembers whether that circled three belonged to the daily or the four-hour reading.
When a Sub-Wave Breaks a Rule
A rule break inside wave three tells you something about wave three. It may also tell you the whole parent label needs rethinking.
Work upward when that happens. Re-read the parent structure first, then rebuild the sub-count underneath it rather than patching the small stuff.
Most tangled counts start here. Traders defend a broken sub-wave for hours instead of asking whether the degree above it ever made sense.
A Worked Count on the Four-Hour Chart
Rules earn their keep on live charts. Consider the AUDUSD four-hour advance that ran from 8 July 2026 into the middle of that month.
Label the first push as wave one and the pullback after it as wave two. Wave two holds above the origin, so rule one survives.
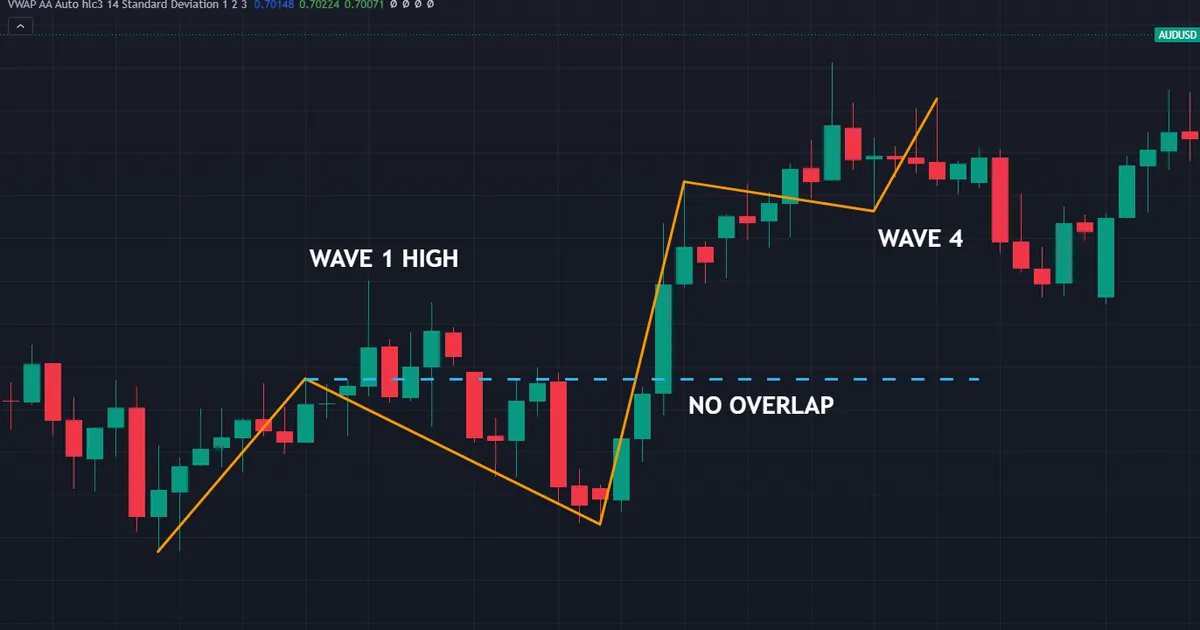
Wave three then extends well past wave one’s high, topping at 0.69932. Rule two clears easily, since wave three outruns both neighbours.
Watching Wave Four
Wave four matters most here. The image marks wave one’s high with a line, and wave four stalls above it rather than cutting through.
No overlap occurs, so rule three holds and the impulse label stands. Wave five then presses on to 0.70126.
Note what the count did not tell you. It gave no entry, no stop and no target, only structural context for the ones you choose.
Turning the Check Into a Trade Plan
Take the entry from a level you can see. The end of wave four supplies a price, and the count merely explains why that price deserves attention.
Then size the position from the distance to your stop. The free risk-reward calculator turns those two prices into a ratio before you commit.
Write the invalidation number in the same note. Without it, a losing trade quietly becomes a still-developing count.
Grading the Count Afterwards
Come back to this chart a fortnight later. Ask whether the rules held throughout, and whether the label you preferred still fits the price that followed.
Two outcomes teach something useful. A count that survived without edits earns more weight next time, and a count you quietly revised twice deserves far less.
Log both in the same place. Our free trade journal gives you somewhere to store the screenshot alongside the invalidation price you wrote.
Consistency beats cleverness here. A rough count reviewed every week outperforms an elegant one you never check again.
Download the complete indicator database
Put these concepts on your charts. One email unlocks the full library of 1,380+ indicators with compiled MT4 and MT5 files, plus my TradingView scripts. No paywall, no spam, unsubscribe any time.
Get free access to my indicator database
One email unlocks 1,380+ free MT4, MT5 and TradingView indicators — the complete library. No single-tool download; you get the whole database.
Common Mistakes With Elliott Wave Rules
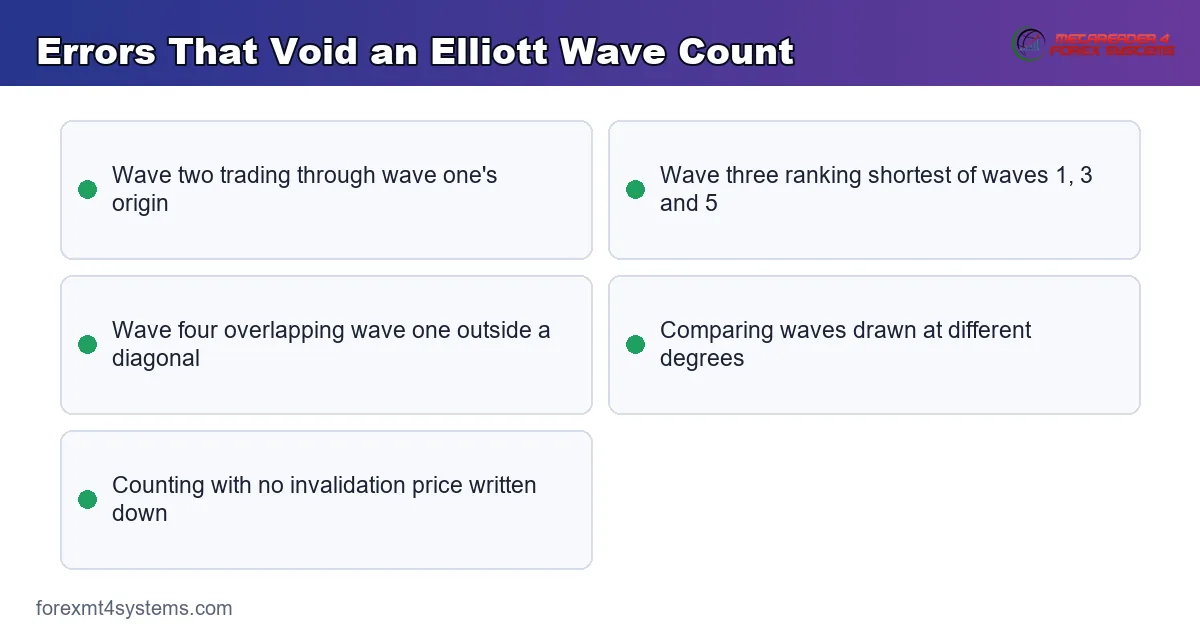
Six errors account for most broken counts. The panel below gathers the ones that void a count outright.
Treating Ratios as Conditions
A wave two at 70 percent breaks nothing. Fix it by keeping a written list of the three rules and checking against that list alone.
Measuring Waves by Eye
Chart scaling distorts relative length badly. Read the actual price distances from the crosshair before ranking waves one, three and five.
Excusing Overlap on a Favourite Idea
Traders often wave away a small overlap when they like the count. Draw the line at wave one’s extreme, then respect it or switch to a diagonal reading.
Mixing Degrees
A wave four on the hourly chart cannot overlap a wave one on the daily. Compare waves of the same degree only, and note the degree beside every label.
Skipping the Invalidation Price
A count with no number attached survives any outcome. Write the price that kills the idea before you place the order.
Counting Every Small Swing
Zoom in far enough and any move splits into five parts. Start from the largest clear swing, then work down only as far as your holding period needs.
Elliott Wave Rules Quick Reference
Keep this table beside the chart while the vocabulary settles. The right column shows what a breach actually costs you.
| Condition | Category | What a breach means |
|---|---|---|
| Wave 2 stays above wave 1’s origin | Rule | Count voided, so relabel immediately |
| Wave 3 not the shortest of 1, 3 and 5 | Rule | Count voided, so relabel immediately |
| Wave 4 clear of wave 1’s territory | Rule | Impulse voided, so consider a diagonal |
| Waves 2 and 4 alternate in character | Guideline | Confidence drops, count survives |
| Waves 1 and 5 run similar lengths | Guideline | Confidence drops, count survives |
| Wave 2 retraces 50 to 62 percent | Guideline | Confidence drops, count survives |
| Wave 3 extends near 162 percent of wave 1 | Guideline | Confidence drops, count survives |
Read the middle column first. Three lines carry real authority, and the remaining four describe habits worth noticing.
When a Valid Count Falls Apart
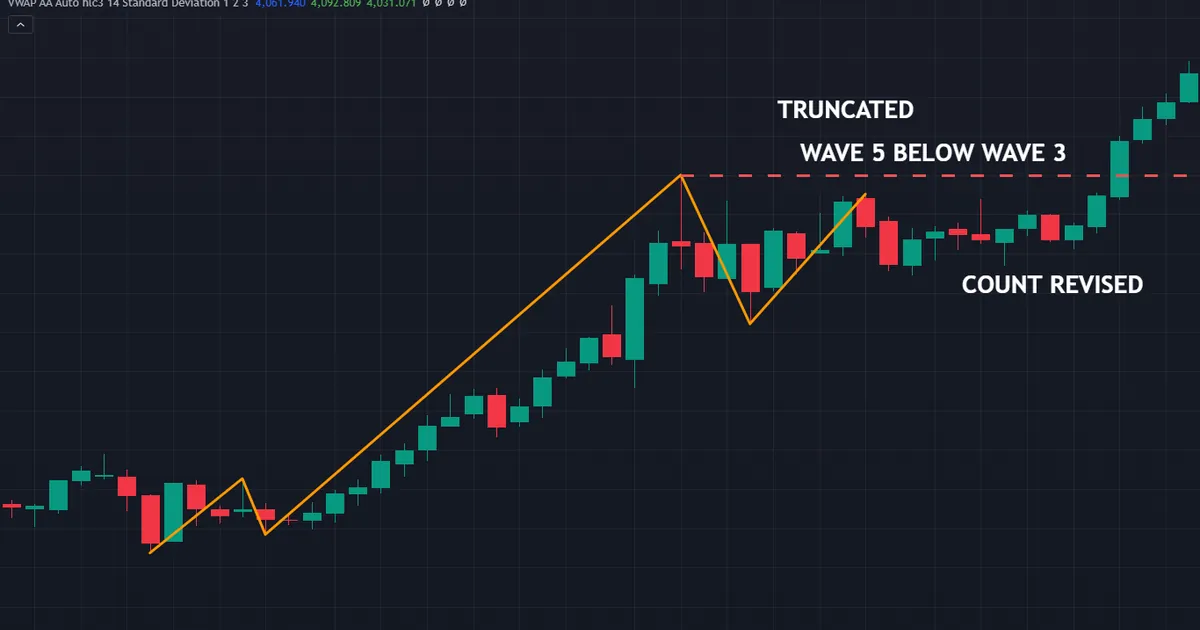
Sometimes every rule holds and the count still lets you down. A truncated fifth causes that outcome more often than any other structure.
Reading the Truncated Fifth
The chart above shows gold on the weekly timeframe. Wave five stalls at 3451.525, below wave three’s 3500.2 high, so the fifth wave truncates.
No rule forbids that outcome. Even so, a fifth wave that fails to clear wave three leaves the sequence looking incomplete, and analysts usually revise the labels afterwards.
Truncation tends to follow an unusually powerful wave three. Buyers exhaust themselves, the final push runs out of fuel, and the turn arrives early.
What to Do About It
Stop assuming a fresh extreme must print. Plenty of traders hold on waiting for wave five to clear wave three, and price simply turns instead.
Protect the position with a level rather than a label. The low of wave four gives you a concrete line, and a close beneath it ends the argument.
Then rank a second count in advance. Our guide on how to use Elliott wave counts covers writing a preferred count with an alternate beside it.
How Much the Rules Really Constrain
Three conditions sound strict on paper. In live analysis they leave far more room than newcomers expect.
The Escape Routes
Diagonals permit overlap, so rule three softens whenever a count needs it. Extensions let a wave subdivide into another five, which changes which swings you compare.
Degrees supply a third exit. Relabel the whole sequence one degree higher and yesterday’s broken rule quietly stops applying.
None of that makes wave analysis dishonest. It does mean a determined counter can keep almost any chart alive, which is exactly what critics point at.
Why That Matters for Testing
Rules that bend on demand resist measurement. Researchers struggle to test a framework whose labels change after the outcome arrives.
So treat published claims about wave analysis with care. Nobody has demonstrated a stable edge from counting alone, and the honest practitioners say as much.
Use the rules for what they do well instead. They stop you defending a structure that price has already contradicted, which alone justifies the effort.
Keeping Yourself Honest
Date every count and store it. A screenshot with the invalidation price written on it costs seconds and settles arguments with yourself months later.
Grade the old ones on a schedule. Count how often your preferred label survived, and how often the alternate turned out closer to the truth.
That record teaches faster than any book. It also shows where your counting habits drift when a position runs against you.
Related Concepts Worth Studying Next
Corrections deserve separate study, since they break more counts than impulses do. Our page on Elliott wave corrective patterns covers zigzags, flats and triangles.
Tooling helps once the vocabulary settles. The Elliott wave indicators archive collects labelling tools you can test on your own charts.
Remember what those tools cannot do, though. They apply somebody else’s counting logic, and you still have to check the three rules yourself.
FAQ
What are the three elliott wave rules?
First, wave two never retraces all of wave one. Second, wave three never ranks as the shortest of waves one, three and five. Third, wave four stays out of wave one’s price territory in a standard impulse. Break any one of them and the count fails.
Does a wick through the level void a count?
Practitioners disagree. Elliott read price extremes, so a wick counts on that reading, while other analysts prefer to wait for a close. Choose one convention, write it down, and apply it whether or not you hold a position.
Do Fibonacci ratios count as rules?
No. Ratios such as the 50 to 62 percent wave two retracement describe tendencies rather than conditions. A count that misses every common ratio still qualifies as valid, provided the three rules hold.
Can wave four ever overlap wave one?
Only inside a diagonal. Leading and ending diagonals permit overlap, and they occupy specific slots: wave one, wave A, wave five or wave C. In a standard impulse, overlap voids the label straight away.
What is a truncated fifth wave?
A fifth wave that fails to exceed wave three’s extreme. It breaks no rule, yet it leaves the sequence looking unfinished and usually forces a relabel. The gold example above stalls at 3451.525 against a wave three high of 3500.2.
How strict do the rules turn out in practice?
Strict in principle, looser in effect. Diagonals, extensions and nested degrees give a skilled counter several legitimate escape routes, which explains why critics argue the framework can fit almost any history after the event.
Do the rules apply to corrections as well?
Not these three. Zigzags, flats and triangles carry their own structural conditions, and the impulse rules simply do not fit a three-wave move. Check the corrective guide for the constraints that apply to A, B and C legs.
Which degree should I count on?
Pick the degree that matches your holding period, then glance one degree above and one below. Daily and four-hour charts suit most swing traders. Below the hourly chart, session opens and data releases create swings that mean little at any useful degree.
Should I trade purely from a wave count?
Treat the count as context and take entries from levels you can see. A wave label supplies no stop and no target on its own. Combine it with structure, a defined risk and sensible position sizing, then review each count on a fixed schedule. Results are not guaranteed; past performance is not indicative of future results.
External references
- For background on this concept, see Impulse Wave Pattern at Investopedia.
- For broader market context, see Robert Prechter on Wikipedia.

About the author
Written by Dominic Walsh, a Forex trader and MT4/MT5 indicator, Expert Advisor and script developer. Every tool on forexmt4systems.com is tested on live charts before release and ships with ready-to-use compiled MT4 (.ex4) and MT5 (.ex5) files. Learn more about the trader and developer behind this site.
How we build, test and correct every tool: Editorial & Testing Policy. Trading carries risk; see the disclaimer.