
Candle range theory reads a single higher-timeframe candle as a complete trading map. Its high and low become a range, and price inside the next lower-timeframe candles works that range like a dealing zone. This idea grows out of the work of Michael Huddleston, the Inner Circle Trader (ICT), and the wider community built on it. After this guide you will frame a candle as a range, spot the sweep of one extreme, and trade the reversal toward the other side.
So candle range theory, often shortened to CRT, turns time into structure. One candle sets the boundaries. The next stretch of price reveals whether the market wants to grab liquidity above, below, or run clean from one edge to the other. Read that intent early and a single candle becomes a full plan for the hours ahead.
What Candle Range Theory Means on the Chart
Every candle carries a high, a low, and a midpoint. Candle range theory treats those three lines as a small dealing range. The chart below shows a EURUSD 4-hour candle with a high at 1.14334 and a low at 1.13828. That 51-pip range becomes the map for the 15-minute candles that follow, with the midpoint at 1.14081.
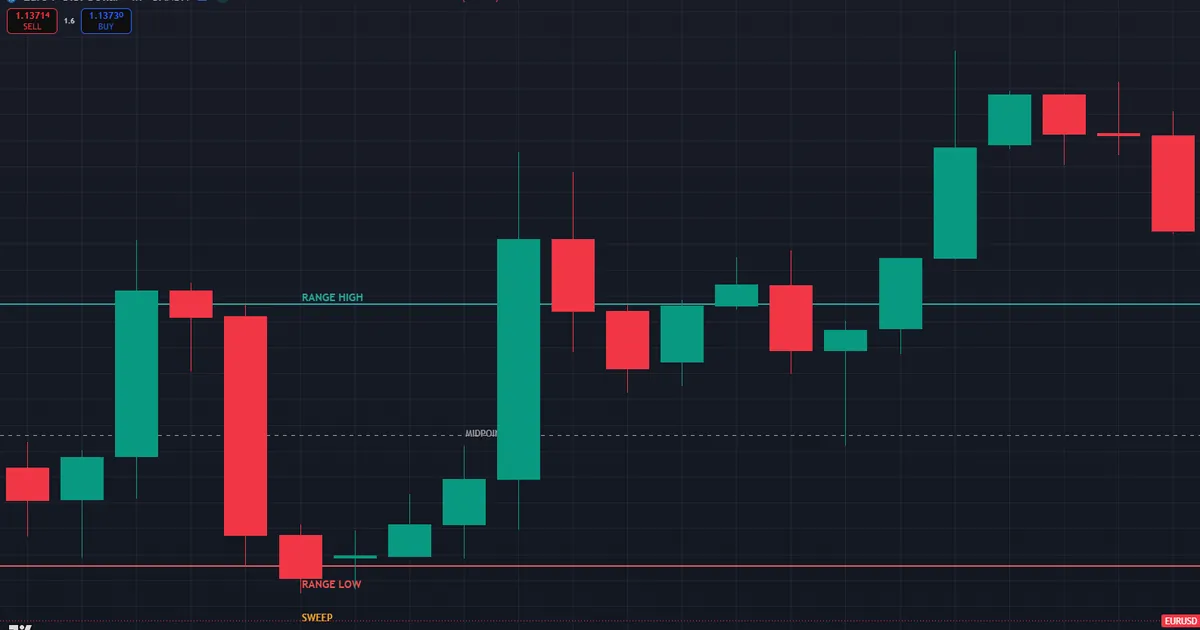
Reading the EURUSD Candle Range
Start with the boundaries, not the middle. The 4-hour high at 1.14334 holds buy-side liquidity, since stops from short sellers rest just above it. Its low at 1.13828 holds sell-side liquidity in the same way. Halfway between them, the midpoint at 1.14081 marks fair value for the range. Those three levels frame everything the lower timeframe does next.
Now watch for the grab. Early in the next period, price pushes down and sweeps the 1.13828 low by a few pips. That poke trips the resting stops, then fails. Price rejects and turns back up. So the sweep of the low signals that the range wants to deliver toward the opposite side, the 1.14334 high, or at least back to the 1.14081 midpoint.
Notice the logic behind the move. The market grabbed liquidity at one extreme to fund a move the other way. That is the whole premise of candle range theory in a single sentence. One side gets raided, and the true delivery runs toward the far edge.
The Three Lines That Matter
Keep the picture simple with three lines. The high is one liquidity pool, the low is the other, and the midpoint is the pivot between premium and discount. Everything above the midpoint trades expensive, and everything below it trades cheap. So a sweep of the high followed by a return under the midpoint tilts the read bearish, while a sweep of the low followed by a reclaim of the midpoint tilts it bullish. Two levels get raided, one level decides fair value, and the reversal does the rest.
How Candle Range Theory Works
CRT follows a rhythm that many traders recognise from quarterly theory. The market accumulates, then manipulates, then distributes. Candle range theory maps that same three-step story onto a candle range, and the sequence repeats across every timeframe.
- First, price builds a range inside the higher-timeframe candle, gathering orders on both sides.
- Next, price sweeps one extreme, grabbing the liquidity resting beyond it.
- Then price rejects that extreme and shifts structure on the lower timeframe.
- Now the real delivery begins, running toward the opposite side or the midpoint.
- Last, price reaches the far pool, where the next candle range starts the cycle again.
Displacement confirms the turn. After the sweep, you want a sharp lower-timeframe move that breaks a small swing point and leaves imbalance. That break is a market structure shift, and it separates a real reversal from a shallow wick. The market structure shift guide covers that confirmation in detail.
The first graphic below lays out the three phases in order. It shows the range, the sweep of one extreme, and the delivery toward the opposite side.
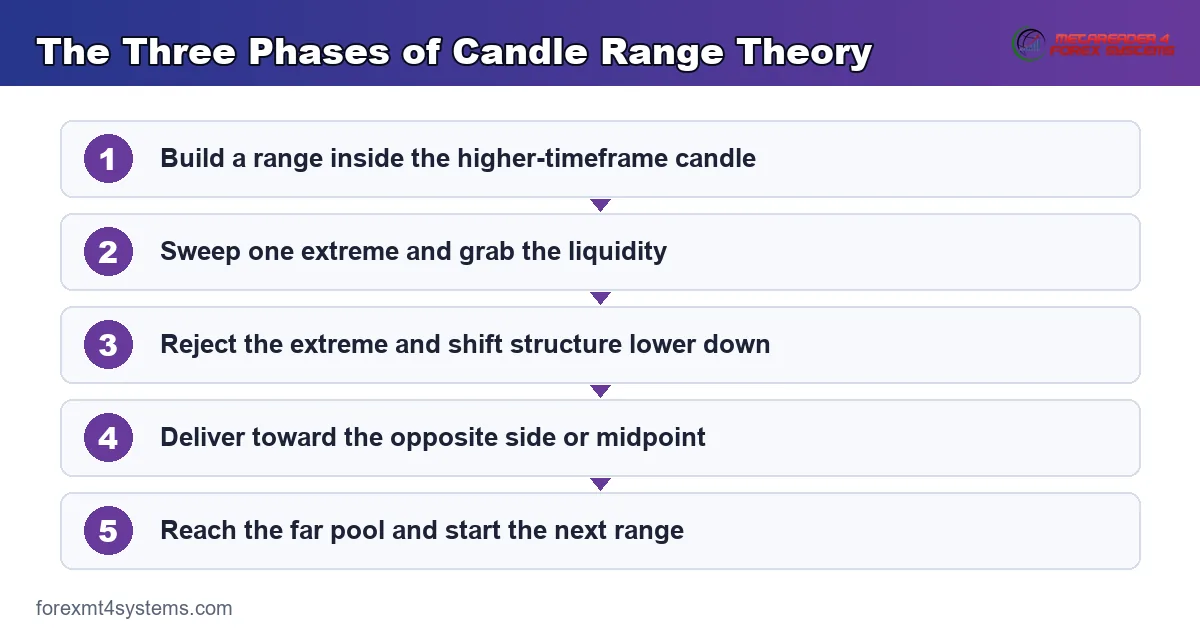
The Higher-Timeframe Candle as a Dealing Range
The link to the dealing range is direct, and it is worth making explicit. A dealing range runs between a swing low and a swing high, split at the 50 percent midpoint. A candle range does the same thing, except the boundaries come from a single candle rather than two separate swings. So candle range theory is a fast, time-based way to build the same premium and discount map.
That connection pays off in practice. Once you frame the candle as a range, every dealing-range rule applies. Buy only after a sweep in the discount half, sell only after a sweep in the premium half, and treat the midpoint as the pivot. Our guide to the ICT dealing range covers the anchoring rules, while the premium and discount guide turns the two halves into a hard filter.
One detail separates the two frames, though. A dealing range only forms once two real swings exist, which can take hours to develop. A candle range exists the moment a candle closes, so you always have a fresh map to work from. That speed is why intraday traders lean on candle range theory when the market has not yet built an obvious swing structure.
Which Candle Pairing to Use
The pairing between candles matters as much as the theory. A common choice reads the daily candle as the range and the 1-hour candle as the delivery timeframe. Another reads the 4-hour candle with 15-minute delivery, which suits intraday traders. Pick a pairing where the higher candle spans a session or more, and the lower candle prints enough bars to show a clean sweep and shift. So match the pairing to your schedule, then keep it consistent long enough to judge it fairly.
Where Candle Range Theory Fits the Workflow
CRT is a timing and location tool, not a standalone signal. First, mark the higher-timeframe candle range and note its high, low, and midpoint. Then set a bias from the wider structure. A bullish read wants price to sweep the low and reverse up, and a bearish read wants a sweep of the high and a turn down.
Next comes the trigger. After the sweep, drop to the delivery timeframe and wait for a structure shift with displacement. That shift is your entry cue, and a fair value gap left by the move gives a precise level. So the sequence reads candle range, then sweep, then shift, then entry on the retrace.
Building the Bias First
Bias comes before every candle range read, so build it deliberately. Look at the last few higher-timeframe candles and note whether they print higher highs or lower lows. That trend tells you which sweep to trust. In an uptrend, favour sweeps of the low that reverse up, and skip sweeps of the high that fail to follow through. In a downtrend, do the reverse. A sweep that agrees with the bigger trend reverses far more cleanly than one that fights it.
Session Timing in New York Hours
Time anchors the whole model, so respect the clock. New candles open at fixed times, and the daily candle in ICT opens at midnight New York time. So the sweep of the prior range often lands during the London kill zone near 2:00 AM New York time or the New York morning from 8:30 to 11:00 New York time. Mark the candle range before those windows and watch for the raid inside them. The forex market hours tool lines every session up against your local clock, which keeps the candle opens honest.
On charts, the catalog of smart money indicators can mark each candle range and its midpoint for you. That saves time when you follow several pairs at once, and it keeps the levels consistent from day to day.
Reading the Manipulation Phase
The sweep sits at the heart of the model, so study it closely. ICT calls this the manipulation phase, the moment the market pushes past an obvious level to trip stops. It looks aggressive and convincing, which is exactly why it traps breakout traders. Price spikes through the high, breakout buyers pile in, and then the move fails and turns on them.
Read the intent behind the spike, not just its speed. A true manipulation sweep grabs liquidity and rejects quickly, often leaving a long wick. A genuine breakout, by contrast, holds above the level and builds from it. So the tell is the reaction. If price snaps back under the swept extreme within a few candles, treat it as manipulation and prepare for the reversal.
Candle Range Theory Across Timeframes
CRT scales because candles nest inside candles. A daily candle contains four 6-hour candles, and each of those holds its own range. So the same sweep-and-reversal story plays out at every level, and a trader can zoom to whichever scale suits the plan. The weekly candle frames the month, the daily frames the week, and the hourly frames the session.
Alignment across scales sharpens the edge. A bullish daily candle range that has swept its low pairs well with a bullish hourly range doing the same thing inside it. When several timeframes point the same way, the reversal carries more weight. So read the higher candle for direction, then let a lower candle time the entry with precision.
Avoiding Analysis Overload
More timeframes can also cloud the read, so keep the stack short. Two candle ranges are usually enough: one for bias and one for timing. Adding a third often introduces conflict rather than clarity. When two ranges disagree, defer to the higher one and let the lower range refine only the entry. That habit keeps candle range theory practical instead of paralysing.
Worked Example: A Bullish CRT on GBPUSD
Rules feel abstract until you price a real setup. The chart below walks a GBPUSD sequence from candle range to entry, and it runs long after a sweep of the low.
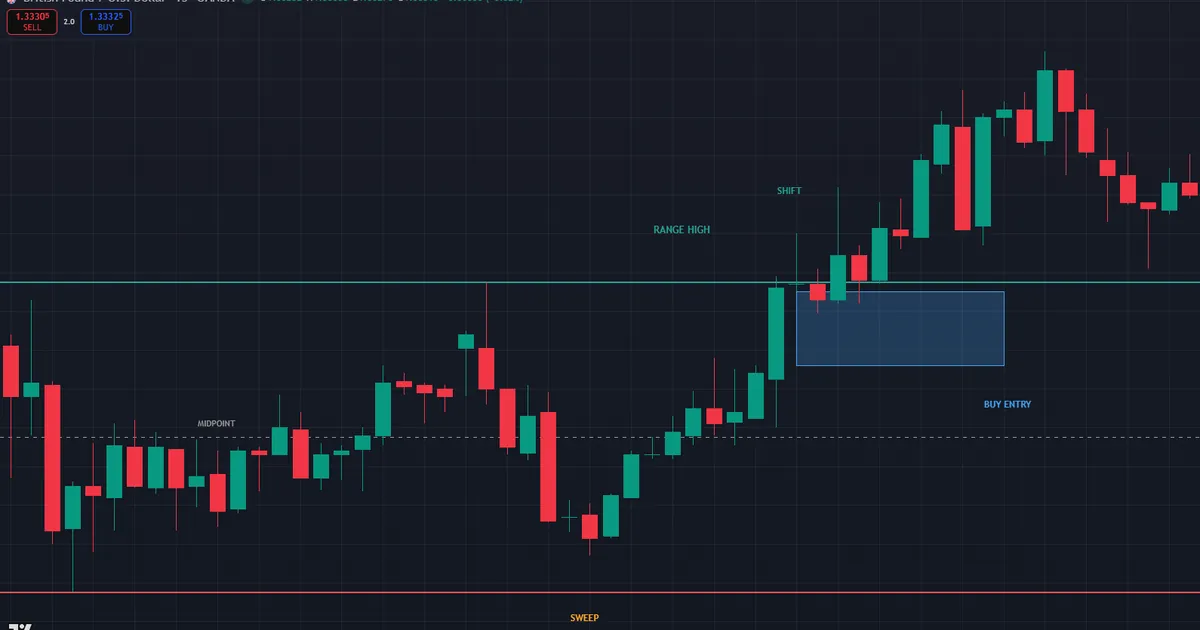
- First, the range: a daily candle with a high at 1.27800, a low at 1.27000, and a midpoint at 1.27400.
- Next, the bias: the weekly chart pointed up, so the model favoured a sweep of the low and a reversal higher.
- Then the sweep: early London dragged price to 1.26950, raiding the sell-side liquidity below the range low.
- The shift: a 15-minute candle rejected the low and displaced up through 1.27080, breaking a small swing high.
- The array: that push left a bullish fair value gap from 1.27010 to 1.27060, just inside discount.
- Last, the trade: buy the retrace into the gap, stop at 1.26880, first target the midpoint, final target 1.27800.
Price paid does the quiet work. A long filled near 1.27040 buys just above the swept low, deep in discount. The range high alone offers more than five times the stop distance as a target. Also notice the discipline the model enforces. Without the sweep and shift, the same gap would be a guess rather than a plan. That single filter, waiting for the raid before buying, turns a hopeful dip-buy into a structured trade with a clear invalidation.
Managing the GBPUSD Trade
Manage the position with the same map that framed it. Many traders bank a partial as price reclaims the midpoint at 1.27400, slide the stop to entry, then let the rest work toward the range high. Others exit fully at the midpoint on quiet days and only hold runners when the higher timeframe backs the move. Choose one plan before entry and write it down. The candle range hands you the levels, and your journal keeps you honest about using them.
Download the complete indicator database
Put these concepts on your charts. One email unlocks the full library of 1,380+ indicators with compiled MT4 and MT5 files, plus my TradingView scripts. No paywall, no spam, unsubscribe any time.
Get free access to my indicator database
One email unlocks 1,380+ free MT4, MT5 and TradingView indicators — the complete library. No single-tool download; you get the whole database.
Common Candle Range Theory Mistakes and Their Fixes
CRT errors sink more trades than entry errors, and a few of them dominate beginner journals. Most come from entering on the sweep alone, before the reversal proves itself. Each mistake below carries a plain correction you can apply on the very next chart.
- Entering on the sweep with no shift. Fix: wait for a structure break with displacement before you commit.
- Ignoring the higher-timeframe bias. Fix: trade sweeps of the low in an uptrend and sweeps of the high in a downtrend.
- Using a random candle pairing. Fix: keep one consistent higher and lower candle pair long enough to judge it.
- Treating the midpoint as a hard target. Fix: it is a milestone, so plan for the opposite extreme as well.
- Forgetting the candle open times. Fix: anchor the range to the fixed New York candle opens, not to a chart guess.
- Chasing after the delivery has started. Fix: enter on the retrace into the gap, not on the breakout candle.
The second graphic pairs each mistake with its fix for a fast pre-session review before you commit any risk.
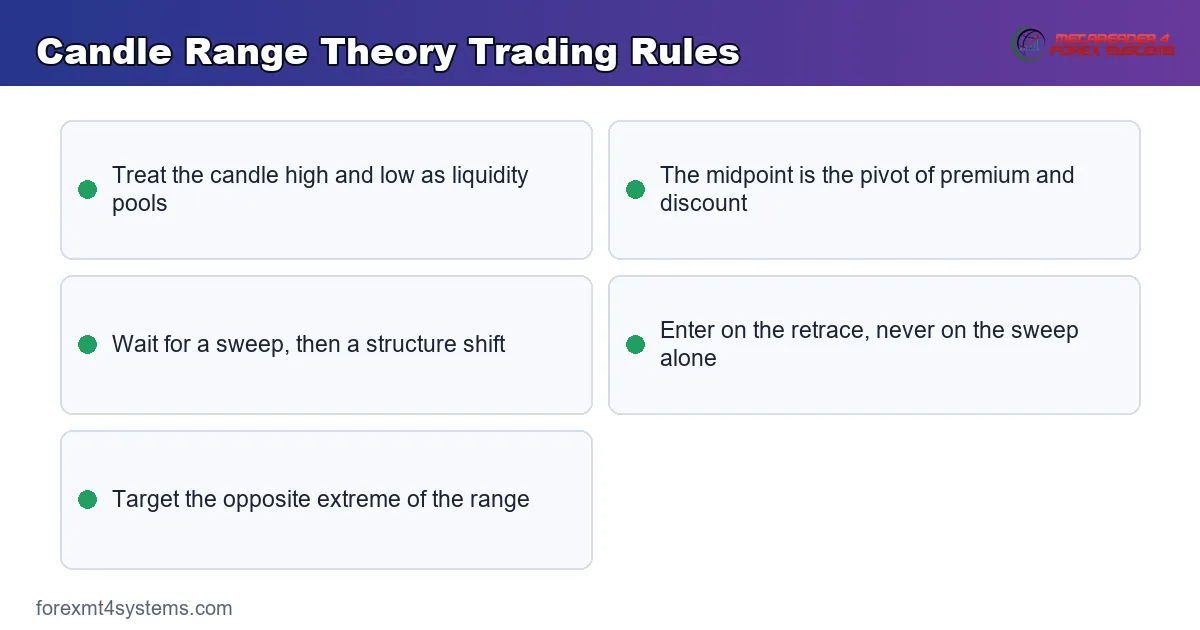
A Candle Range Theory Pre-Trade Checklist
Run these seven lines before any entry that leans on a candle range. A single failure sends the trade back to the watchlist.
- The higher-timeframe candle range is marked with high, low, and midpoint.
- The higher-timeframe bias points the same way as the planned reversal.
- Price has swept one extreme and grabbed the liquidity beyond it.
- A lower-timeframe structure shift with displacement confirms the turn.
- A fair value gap or order block gives a precise entry level.
- The opposite extreme offers a clear target with room to run.
- The stop sits beyond the swept extreme, and the journal line is written first.
Also score a month of trades against this list. The line you skip most often is your leak, and fixing one leak beats learning three new setups every week.
Related Concepts to Study Next
Candle range theory connects to several ideas worth learning together. The market structure guide shows how the shifts inside a candle range fit the wider trend, which sets your bias. Then the full guide to the ICT power of three covers the accumulation, manipulation, and distribution rhythm that CRT compresses into one candle. Also, the dealing range and market structure shift guides linked above sharpen the mechanics behind every sweep and reversal.
When Candle Range Theory Fails
CRT breaks in trending expansion. When a candle opens and simply runs, sweeping neither side cleanly, there is no range to trade. So a trader waiting for the classic sweep and reversal gets left behind while price expands away. That is a real cost the model accepts in exchange for cleaner, more selective entries. Expansion days reward momentum traders and punish anyone insisting on a tidy reversal, which is why matching the model to conditions matters as much as the model itself.
Double sweeps are the other trap. Sometimes price raids the high, reverses, then raids the low too before choosing a direction. Both edges get taken, and an early entry after the first sweep stops out on the second. Hence wait for the structure shift, since it filters most of these two-sided traps before you risk anything.
A Failure Walkthrough on EURUSD
One failure repeats more than the rest, and the chart below shows it. EURUSD sweeps the range low, and a trader buys the reversal expecting delivery to the high. Yet no structure shift printed, and the bounce was shallow. Price rolls back down, sweeps the low again, and this time keeps going.

Resolution comes fast. Price closes well below the range low, the long stops out, and the honest read appears. The first sweep grabbed liquidity, but the range itself was breaking down, not reversing. Thus the invalidation rule stays simple: a decisive close beyond the swept extreme kills the setup. Journal whether a real shift confirmed the turn, because entries without that confirmation cause most CRT failures.
FAQ
What is candle range theory?
Candle range theory treats a single higher-timeframe candle as a small dealing range. Its high and low become liquidity pools, and its midpoint marks fair value. Price then sweeps one extreme and often reverses toward the opposite side, which is the move traders aim to catch.
How is candle range theory different from a dealing range?
They describe the same premium and discount map. A dealing range takes its boundaries from two separate swing points, while a candle range takes them from one candle. So candle range theory is a faster, time-based way to build the same structure. Many traders use both together, letting the candle range time entries inside a wider dealing range.
Which candle timeframes work best for CRT?
Common pairings read the daily candle with 1-hour delivery, or the 4-hour candle with 15-minute delivery. Choose a higher candle that spans a session or more and a lower one that prints a clean sweep and shift. Keep the pairing consistent long enough to judge it fairly. Swapping settings every session makes it impossible to learn how a given pair behaves.
Do I enter on the sweep or the reversal?
Enter on the reversal, never the sweep alone. Wait for a lower-timeframe structure shift with displacement, then buy or sell the retrace into the fair value gap it leaves. That patience filters out the double sweeps that trap early entries. The sweep tells you liquidity was taken, but only the shift confirms the market intends to reverse, so let both events line up before you act.
Where do I place the stop and target?
Place the stop just beyond the swept extreme, since a close through it invalidates the idea. The first target is usually the midpoint, and the second is the opposite extreme of the range. That structure keeps the reward large relative to a tight, defined risk. Many traders bank part of the position at the midpoint and let the rest run toward the far edge.
Does candle range theory work on stocks and crypto?
The framework applies to any market with time-based candles, and traders use it on indices, metals, and crypto. Yet each market sweeps and reverses at its own pace, so test the model on your instrument first. Markets that trade around the clock keep the candle opens clean, while those with session gaps need a little more care. Results are not guaranteed; past performance is not indicative of future results.
External references
- For background on this concept, see Candlestick Chart on Wikipedia.
- For broader market context, see Inside Days at Investopedia.

About the author
Written by Dominic Walsh, a Forex trader and MT4/MT5 indicator, Expert Advisor and script developer. Every tool on forexmt4systems.com is tested on live charts before release and ships with ready-to-use compiled MT4 (.ex4) and MT5 (.ex5) files. Learn more about the trader and developer behind this site.
How we build, test and correct every tool: Editorial & Testing Policy. Trading carries risk; see the disclaimer.