
An ICT dealing range is the span between a clear swing low and a clear swing high. It turns raw price into a simple map of value. Michael Huddleston, the Inner Circle Trader (ICT), splits that span into premium above the midpoint and discount below it. After this guide you will anchor a range correctly. You will place the 50 percent equilibrium line. Then you will project premium and discount before any entry.
So the range is less a pattern than a ruler. It measures where price sits against fair value. That one read filters most of the poor trades beginners take. Better still, it costs nothing beyond two clean anchors and a midpoint line.
What an ICT Dealing Range Looks Like on the Chart
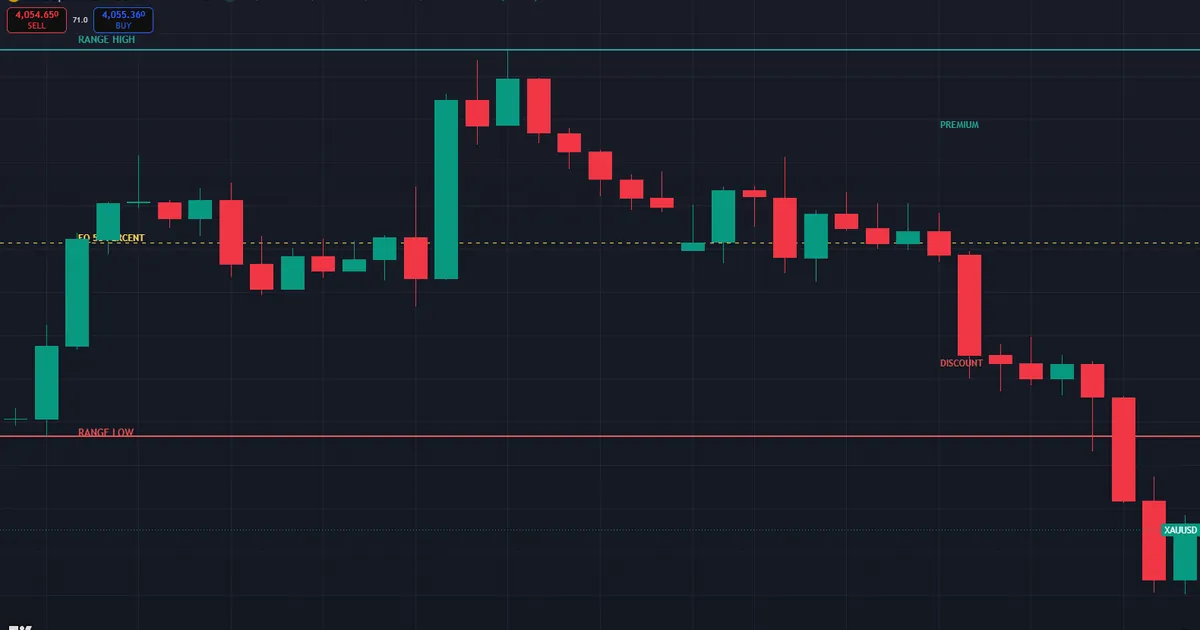
Every range needs two anchors: a swing low and a swing high that both mattered to the market. The chart below shows a gold (XAUUSD) 1-hour dealing range. It runs from a swing low at 4076.76 to a swing high at 4166.13. Halfway between them, equilibrium sits at 4121.45.
Reading the Gold Range Split
Anchor first, then judge price. The low at 4076.76 came from a sweep of an older low, and the high at 4166.13 capped the move with a raid of its own. Equilibrium at 4121.45 marks fair value for the whole span. Above that line, price trades at a premium. Below it, price trades at a discount.
Now price the difference. A long taken at 4150 pays roughly 29 points above fair value. The same idea filled at 4090 starts 31 points below it. Same range, same bias, very different price paid. Only the split makes that gap visible before you click.
Notice what the range does not do. It never fires a signal on its own. Instead it vetoes trades taken at poor prices. Yet that veto alone removes the most common beginner error, which is chasing longs into strength near the range high.
Whose Orders the Range Reflects
The split rests on a simple idea about size. Institutions work large positions over hours, and chasing strength moves the market against their own fills. So their buying tends to cluster where sellers stay active, down in discount. Retail flow mirrors the opposite habit. It buys excitement near highs and sells fear near lows. Hence the two halves separate the crowd from the size.
Hold that claim to an honest standard, though. No public study measures how often institutional fills gather below a retail-drawn midpoint. The evidence stays qualitative, built on repeated observation rather than audited numbers. Treat the range as a discipline tool with a plausible story, and let your own journal supply the figures that matter.
Dealing Range Versus an Ordinary Trading Range
Beginners often blur two different ideas, so pin the distinction down early. An ordinary trading range is any sideways band between rough support and rough resistance. A dealing range is stricter. Its two anchors must be swing points that swept liquidity, and its job is to project premium and discount rather than to mark a box for rotation. One describes congestion. The other describes value.
That difference changes how you act inside each. In a plain trading range, traders fade the edges and scalp back toward the middle. In a dealing range, the middle becomes the decision line, and the edges are liquidity you expect the market to raid. So a dealing range invites directional trades toward a draw, while a trading range invites two-sided rotation. Confusing the two leads to fading the very sweep that should trigger your entry.
When the Two Overlap
Sometimes the same band serves both roles, and that overlap confuses charts fast. Price can coil in a tight trading range while a larger dealing range still frames the bias above it. Read the higher timeframe to break the tie. If the daily structure points down, treat the small congestion as internal noise inside a bearish dealing range, not as a fresh box to fade. The larger frame always sets the story.
How to Draw a Dealing Range Step by Step
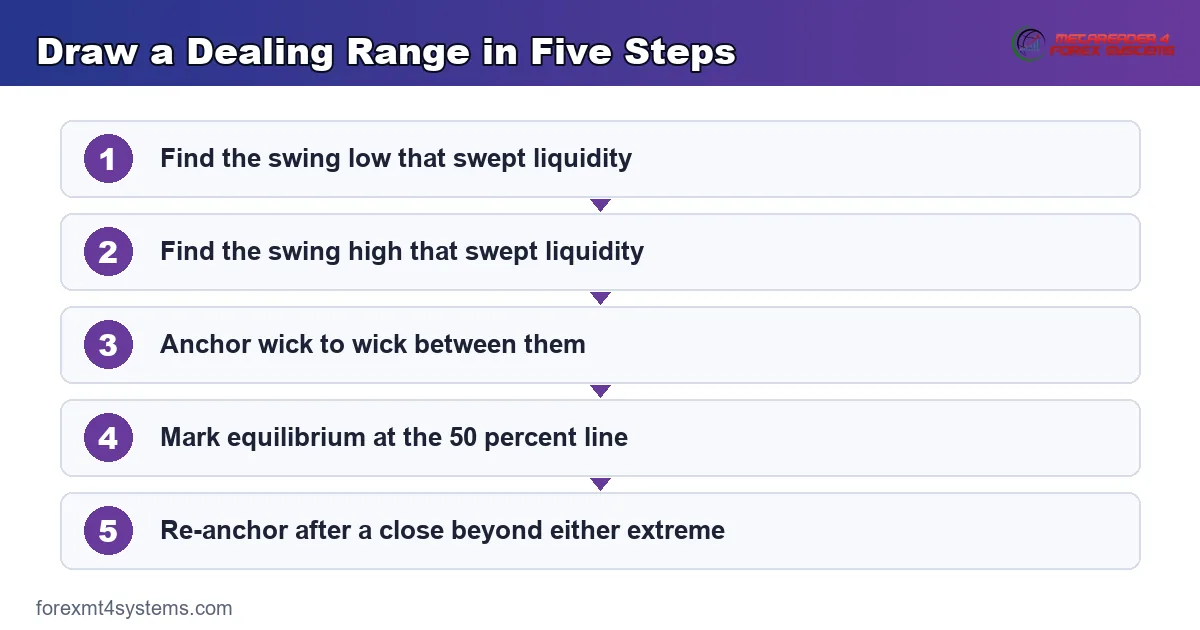
The midpoint only helps when the range around it is valid. So drawing comes first, and most beginners rush it. A real dealing range runs between a swing high and a swing low that each swept liquidity. Random consolidation edges never qualify.
- First, find the most recent swing low that traded below an older low and reversed.
- Next, find the most recent swing high that traded above an older high and reversed.
- Then anchor the range between those two points, wick to wick.
- Now split it in half and mark equilibrium at the 50 percent line.
- Last, re-anchor whenever price closes beyond either extreme.
Higher timeframes win every conflict. A daily range frames the week, while an hourly range only guides decisions inside it. Also keep both on the chart and let the larger one settle any disagreement. Prefer exact numbers to a chart tool? The free Fibonacci calculator returns equilibrium and every retracement level from just two prices.
Why Wicks Belong Inside the Anchors
Anchor from the true extreme of each swing, wick included. The stop run that built that wick is the liquidity event that validates the level. Bodies miss it. Indeed, a range drawn body to body usually mislabels premium and discount by several pips, and near equilibrium those few pips decide the whole trade.
The first graphic below labels the whole anatomy. It shows the range high, the range low, equilibrium, both halves, and the deep discount zone traders watch for entries.
Where the Dealing Range Sits in the ICT Workflow
The range is a context layer, not a system by itself. It answers one question before anything else: is price cheap or expensive right now. First, read the higher timeframe and mark the daily or four-hour range. Then set a directional bias from structure. A bullish bias wants price sitting in discount, and a bearish bias wants it in premium.
Next comes the point of interest. Inside the correct half, hunt for an order block or a fair value gap. Then drop to a 5-minute or 15-minute chart for the trigger. Price should sweep a small level and displace before you commit. So the sequence reads high timeframe, then zone, then low-timeframe confirmation, then entry.
Session Timing in New York Hours
Timing tightens the plan. Mark the daily range before the London kill zone opens near 2:00 AM New York time. Then expect the clean tests during London or the New York morning window from 8:30 to 11:00 New York time. The Asian range from 8:00 PM to midnight usually drifts, so treat it as a reference box rather than a trade window. The forex market hours tool maps each of these windows to your local clock.
On charts, the wider catalog of ICT indicators for MT4 and MT5 can draw the range and equilibrium for you. Range extremes also double as liquidity pools, which is why sweeps of those extremes matter so much. The full guide to liquidity sweep trading covers that interaction in depth.
Pairing the Daily Range With a 15-Minute Trigger
The real skill is pairing timeframes cleanly. Picture a daily dealing range on EURUSD with price resting in deep discount. That read sets a bullish bias for the session. Drop to the 15-minute chart and wait, because the entry lives there, not on the daily. When London sweeps a small low and a candle displaces up, a fresh gap prints inside discount. That gap becomes your trigger, and the daily range stays your reason. Neither works well without the other.
Keep the roles separate in your head. The high timeframe answers where and why. The low timeframe answers when. Also resist the urge to enter on the daily chart itself, since its candles run far too wide for a tight stop. Let the small timeframe hand you precision inside the zone the big one approved.
Fractal Dealing Ranges
The range works fractally, which ranks among its most useful traits. A daily dealing range has an equilibrium, and so does every impulse leg inside it. So deep discount of the daily range plus discount of the current leg marks a stronger long location than either read alone. The layers stack, and the best setups appear where several equilibrium reads agree.
Run the stack on the gold chart above. The full range spans 4076.76 to 4166.13, so the daily equilibrium sits at 4121.45. Suppose the latest leg rallied from 4100.00 to 4145.00. That leg’s own midpoint sits near 4122.50. When two equilibrium reads cluster within a few points, the zone between them turns high-interest, because both the range and the leg call it fair value.
When the Layers Disagree
Stacks conflict just as often, though. A leg equilibrium deep inside the daily premium still argues against longs, whatever the smaller structure says. Resolve every conflict the same way. The larger range wins, and the smaller one only refines timing inside the approved half. That rule keeps fractal analysis from turning into paralysis.
How the Range Points to Your Target
A dealing range does more than filter entries. It also aims them. The draw on liquidity is the pool the market is most likely reaching toward, and range extremes are prime candidates. When you buy from discount, the opposing range high usually holds resting buy-side liquidity, so that high becomes a logical first target. When you sell from premium, the range low holds sell-side liquidity, and price often gravitates there.
Equilibrium serves as a milestone along the way. Many traders bank a partial as price reclaims the 50 percent line, then trail the rest toward the far extreme. That plan respects a simple truth: the midpoint is where the easy part of the move usually ends. Beyond it, price must fight through fresh orders, so protecting profit there keeps a good trade from turning red.
Reading Two Draws at Once
Larger ranges nest inside even larger ones, and each carries its own draw. A four-hour range might target its own high, while the daily range points at a pool much further away. Rank them by timeframe. The nearer draw offers the first realistic target, and the higher-timeframe draw offers the runner. Mapping both before entry stops you from closing a trade right before it reaches the real objective.
Worked Example: Buying Discount on GBPUSD
Rules feel abstract until you price a real setup. The chart below walks a GBPUSD 1-hour sequence from range to entry, and it runs long off the discount half.

- First, the range: a swept low at 1.26400, a swept high at 1.28000, equilibrium at 1.27200.
- Next, the bias: the daily chart had broken structure higher, so buy-side liquidity above 1.28000 stood as the draw.
- Then the location: the London session dragged price to 1.26900, some 30 pips into discount.
- The trigger: price swept a session low by a few pips and displaced up through 1.26950.
- The array: that push left a bullish fair value gap from 1.26880 to 1.26940, safely below equilibrium.
- Last, the trade: buy the retrace into the gap, stop at 1.26700, first target equilibrium, final target 1.28000.
Price paid does the quiet work again. A long filled near 1.26910 buys about 29 pips below fair value. The equilibrium target alone spans more than the stop distance. Also notice the discipline the range enforces. The same gap printed above 1.27200 would offer no trade at all, however clean the displacement looked.
Managing the GBPUSD Trade
Manage the position with the same map that framed it. Many traders bank a partial at equilibrium, slide the stop to entry, then let the rest work toward the range high. Others exit fully at the midpoint on quiet days and only hold runners when the daily bias backs the move. Choose one plan before entry and write it down. The range hands you the levels, and your journal keeps you honest about using them.
Download the complete indicator database
Put these concepts on your charts. One email unlocks the full library of 1,380+ indicators with compiled MT4 and MT5 files, plus my TradingView scripts. No paywall, no spam, unsubscribe any time.
Get free access to my indicator database
One email unlocks 1,380+ free MT4, MT5 and TradingView indicators — the complete library. No single-tool download; you get the whole database.
Common Dealing Range Mistakes and Their Fixes
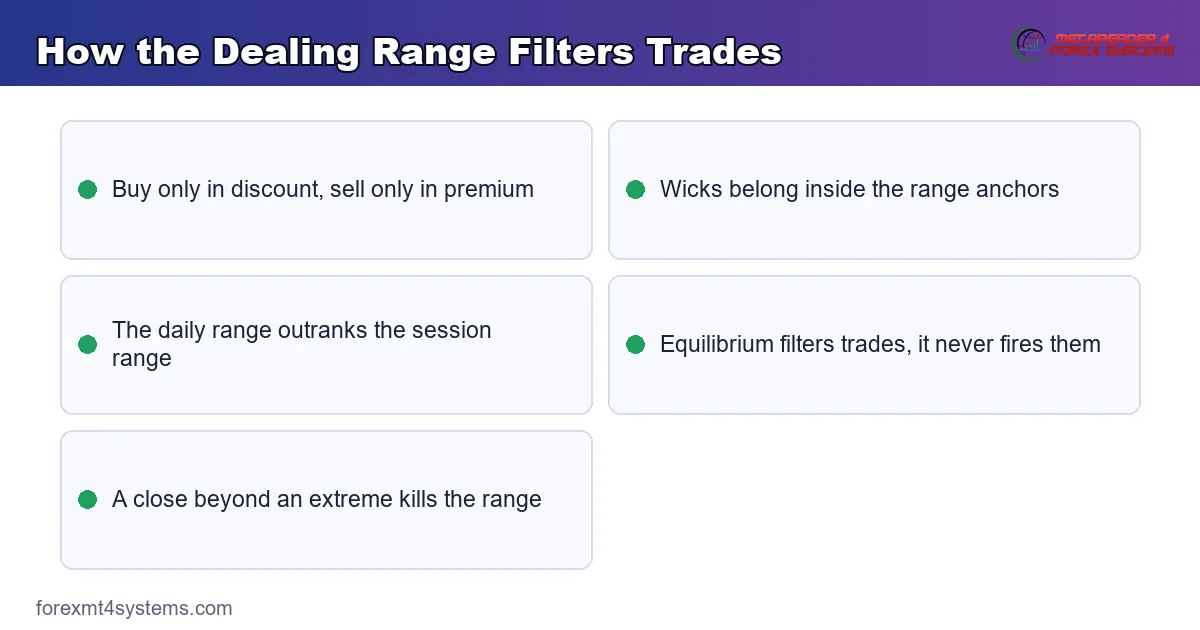
Range errors sink more trades than entry errors, and a few of them dominate beginner journals. Each mistake carries a plain correction you can apply on the very next chart.
- Anchoring to random consolidation edges. Fix: only swings that swept liquidity define a range.
- Anchoring to candle bodies. Fix: include the wick, since the stop run that built it validates the level.
- Letting a session range overrule the daily. Fix: the higher-timeframe half holds veto power, always.
- Trading equilibrium as a signal. Fix: the 50 percent line filters trades; it never fires them.
- Keeping a dead range on the chart. Fix: re-anchor the moment price closes beyond either extreme.
- Ignoring the draw on liquidity. Fix: enter only when a clear pool rests beyond your intended target.
The second graphic pairs each mistake with its fix for a fast pre-session review.
A Dealing Range Pre-Trade Checklist
Run these seven lines before any entry that leans on the range. A single failure sends the trade back to the watchlist.
- Range anchored wick to wick between two liquidity-sweeping swings.
- Daily and session ranges both marked, with conflicts settled by the daily.
- Bias set first: a bullish read wants discount, a bearish read wants premium.
- Price currently sits in the half that matches the bias.
- A sweep plus displacement happened inside that half.
- The entry array rests on the correct side of equilibrium.
- A liquidity pool sits beyond the target, and the stop goes past the sweep.
Also score a month of trades against this list. The line you skip most often is your leak, and fixing one leak beats learning three new setups.
Related ICT Concepts to Study Next
The dealing range connects to several ideas worth learning together. The split it creates powers our premium and discount guide, which turns the two halves into a hard buy-low, sell-high filter. Then candle range theory shows how a single higher-timeframe candle becomes the very range you trade inside. For the deepest entries, the optimal trade entry pocket refines where inside discount to buy. Also, inside structure matters as much as the extremes, which the guide to internal and external range liquidity covers in full.
When a Dealing Range Fails
Strong trends break the range constantly. In a runaway move, price can hold premium for days while the discount pullback never arrives. So traders who wait for the 50 percent retrace simply miss the run. That is a real cost the framework accepts in exchange for better average entries.
Range selection is the other failure point. Anchor the tool to the wrong swings and the labels flip. Yesterday’s premium becomes today’s discount. Equilibrium is no magnet either, since price crosses it without reacting more often than it respects it. Hence treat the range as a context filter on top of structure and liquidity, never as a signal by itself.
A Failure Walkthrough on EURUSD
One failure repeats more than the rest, and the chart below shows it. EURUSD grinds lower for two weeks. A trader anchors a range on the latest bounce, waits patiently for discount, and buys a gap ten pips under the midpoint. Yet the trend never agreed, because that bounce was only a pullback inside a larger bearish leg.
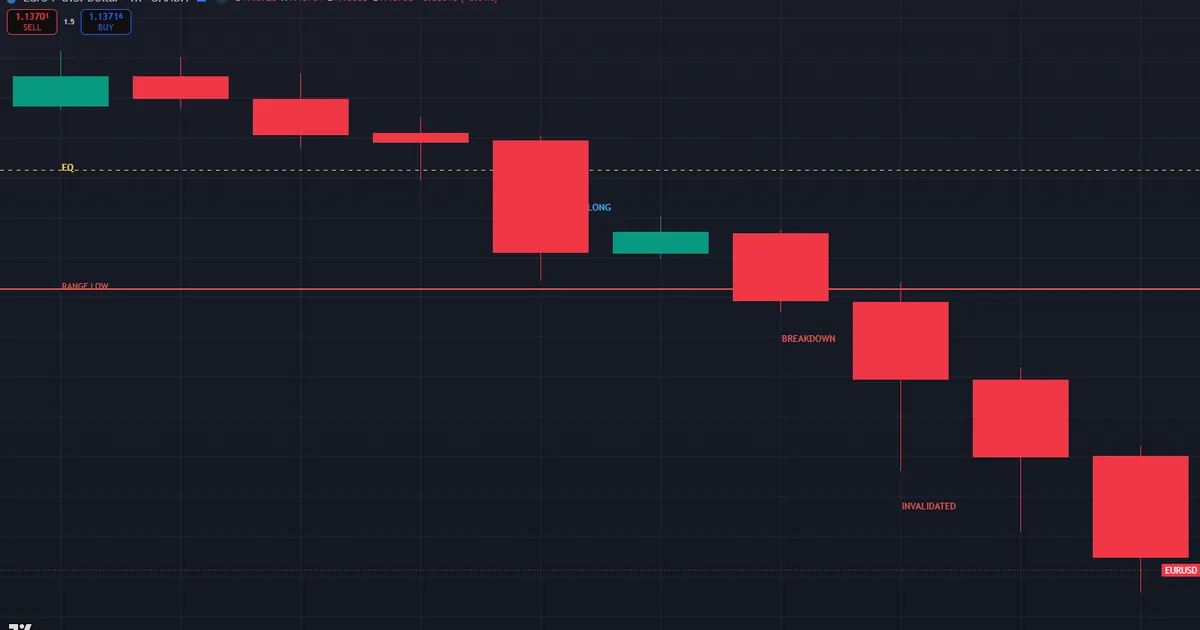
Resolution comes fast. Price closes below the range low, the long stops out, and the honest read appears. The whole range sat inside a bigger down move, so the larger structure marked that discount as premium. Thus the invalidation rule stays simple: a decisive close beyond either extreme kills the range and every trade built on it. Journal the two swings you used and check whether each truly swept liquidity, because a mis-anchored range fails that test almost every time.
FAQ
What is an ICT dealing range?
An ICT dealing range is the distance between a swing low and a swing high that both swept liquidity. Traders split it in half to find equilibrium, then label everything above as premium and everything below as discount. It frames where price sits relative to fair value.
How do I find the swing points?
Use the most recent swing high and swing low that traded through a prior extreme and reversed. Ordinary pullback swings inside a leg do not count. When in doubt, zoom out one timeframe and let the larger structure choose the anchors. A clean anchor almost always lines up with an obvious stop run, so look for the wick that raided old traders first.
Where is equilibrium in a dealing range?
Equilibrium sits exactly at the 50 percent midpoint. Mark it with a Fibonacci retracement tool set to show the 0, 0.5, and 1.0 levels. Price above it trades at a premium, and price below it trades at a discount.
Does a dealing range work on any timeframe?
Yes, as long as the chart shows clear swing points. Day traders apply it to session ranges, while swing traders lean on daily and weekly ranges. Still, keep the higher-timeframe range on the chart, because it usually wins conflicts.
When does a dealing range become invalid?
A dealing range dies when price closes decisively beyond either anchor. That close tells you a fresh range is forming, so re-anchor to the new swings. Trading a dead range is one of the most common ways this tool fails.
How many dealing ranges should I track at once?
Keep it lean. Most traders watch one higher-timeframe range for bias and one lower-timeframe range for timing. Tracking more than that usually breeds conflicting signals rather than clarity. When two ranges disagree, defer to the larger one and let the smaller range refine only your entry.
Does the dealing range work outside forex?
The math applies to any market with defined swings, and traders use it on indices, metals, and crypto. Yet liquidity behaves differently across markets, so test the range on your instrument first. Volatile assets can overshoot both extremes before respecting the split, which widens the stops you need. Results are not guaranteed; past performance is not indicative of future results.
External references
- For background on this concept, see Range at Investopedia.
- For broader market context, see Support and Resistance at Corporate Finance Institute.

About the author
Written by Dominic Walsh, a Forex trader and MT4/MT5 indicator, Expert Advisor and script developer. Every tool on forexmt4systems.com is tested on live charts before release and ships with ready-to-use compiled MT4 (.ex4) and MT5 (.ex5) files. Learn more about the trader and developer behind this site.
How we build, test and correct every tool: Editorial & Testing Policy. Trading carries risk; see the disclaimer.