
Internal and external range liquidity splits any trading range into two kinds of fuel. External liquidity rests at the range extremes, the swing high and swing low that stops and breakout orders sit beyond. Internal liquidity lives inside the range, in the fair value gaps and order blocks that price uses as pullback zones. Michael Huddleston, the Inner Circle Trader (ICT), built much of his delivery model on the way price shuttles between these two. After this guide you will label both types on a chart and read the sequence that links them.
So the range tells a two-part story. Price reaches for a pool at one edge, then pulls back into a zone inside, then reaches for the pool at the other edge. That rhythm, from inside to outside and back, is the heart of the model. Master it and most range charts start to make sense.
What Internal and External Range Liquidity Means
A dealing range gives you the frame, and this idea fills it in. The chart below shows a gold (XAUUSD) 1-hour range with an external high at 4043.36 and an external low at 3959.80. Inside it, a bearish fair value gap sits between 4008.49 and 4021.38, and an order block rests near 4030. Those inside zones are internal liquidity, while the two extremes are external liquidity.
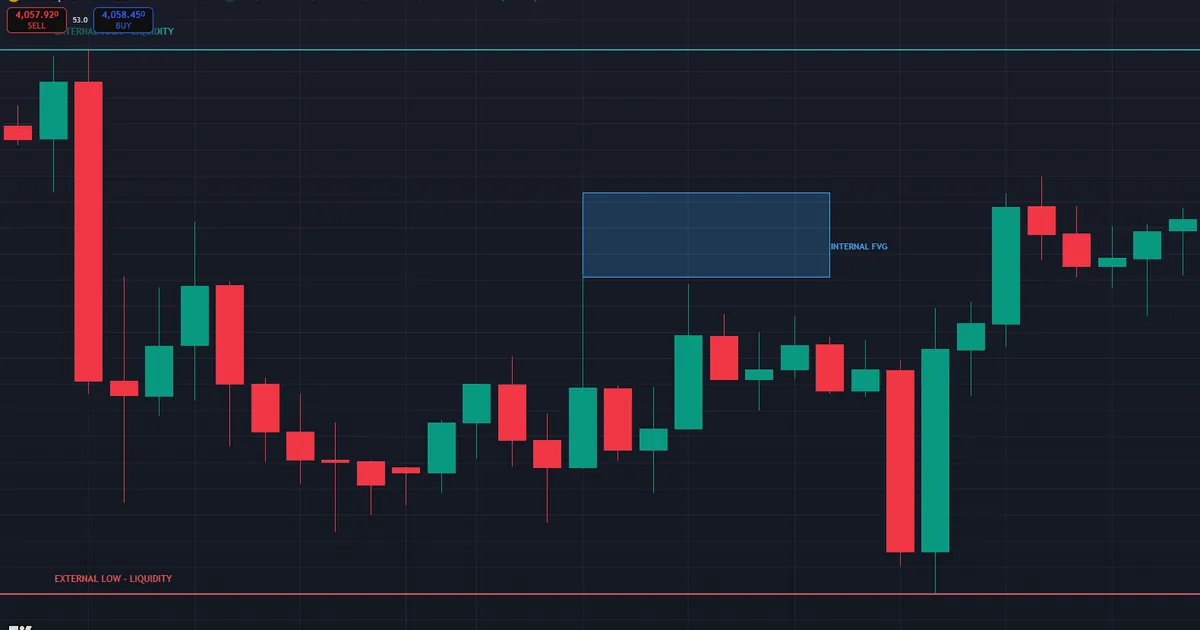
Reading the Gold Range
Label the extremes first. The high at 4043.36 holds buy-side liquidity, since short sellers park their stops just above it. The low at 3959.80 holds sell-side liquidity in the same way. Those two pools are external range liquidity, and price tends to reach for one and then the other over time.
Now mark the inside zones. Between the extremes, price left a bearish fair value gap between 4008.49 and 4021.38 and an order block near 4030. These are internal range liquidity. They do not attract a raid the way the extremes do. Instead they act as rest stops, places where price reacts on its way from one external pool to the other.
Notice how the two roles differ. External liquidity is a destination, the target price draws toward. Internal liquidity is a waypoint, the entry price offers along the route. So the skill is knowing which one you are looking at, because you trade them in opposite ways.
Picture the range as a room with two doors. The doors are the external pools, and the furniture inside is the internal liquidity. Price wanders the room, brushing the furniture, then heads for a door. You want to enter beside the furniture, not while standing in a doorway that price is about to blow through.
External Range Liquidity: The Swing Extremes
External range liquidity sits at the obvious highs and lows. Every trader can see a swing high, so stop orders and breakout orders cluster just beyond it. That cluster is a pool, and the market often runs price into it to fill large orders. When price sweeps the high and reverses, it has taken external liquidity.
These pools set your targets. If price is climbing inside the range, the external high above becomes the logical draw. If price is falling, the external low below pulls it in. The guide to buy-side and sell-side liquidity explains why these resting orders attract price so reliably, and the liquidity pool guide covers how the pools form.
External pools also explain false breakouts. A move that pokes above the high and snaps back has not failed at random. It has simply taken the external liquidity resting there and reversed to deliver the other way. So what looks like a failed breakout to one trader is a clean liquidity sweep to another, and the difference is only in how you label the pool.
Relative Equal Highs and Lows
Some external pools stand out more than others. When price prints two or three highs at almost the same level, it leaves relative equal highs. Those flat tops look like strong resistance, so a heavy stack of stops builds above them. The market treats that stack as a magnet, and a run to sweep it becomes very likely. The same logic works in reverse for equal lows below the range.
Internal Range Liquidity: Zones Inside the Range
Internal range liquidity is subtler because it hides inside the range. A fair value gap is one form, an imbalance left by a fast move. An order block is another, the last candle before a strong push. Both mark places where price is likely to react, so both give you entries on a pullback.
These zones are where you buy or sell. When price sweeps an external low and turns up, it often retraces to an internal fair value gap before continuing. That gap is your entry, with a tight stop and the external high as the target. So internal liquidity answers the question of where to get in, while external liquidity answers where to aim.
Freshness decides which internal zone to trust. A gap left by strong, recent displacement carries real weight, since the orders behind it are still unfilled. A zone that price has already tapped once has less pull, because much of its liquidity has gone. So favour clean, untested internal zones, and treat a second tap of the same gap with more caution than the first.
Why the Distinction Changes Your Trade
Mixing the two roles is a costly error. A trader who buys at the external high is buying into a pool that price is about to raid, not defend. A trader who targets an internal gap sets a timid goal and leaves most of the move on the table. So keep the roles straight. Enter at internal liquidity, and target external liquidity, never the reverse.
Range Liquidity Across Timeframes
The split scales like everything else in this model. A daily range has its own external pools, and inside it an hourly range holds external pools of its own. So one trader’s external high can be another trader’s internal zone, depending on the timeframe. Reading the two together prevents a common mix-up, where a small external pool looks like a target when the bigger picture treats it as a mere waypoint.
Alignment makes the strongest setups. When a lower-timeframe external low sits inside a higher-timeframe discount, a sweep of it lines up neatly with a bullish plan. So map the range on your trading timeframe, then check the one above it to see whether your target pool is truly external or just internal to a larger range. That habit keeps your targets ambitious enough to matter.
How the Two Work Together
The model links the two into one flow, and ICT describes it in a simple phrase: internal to external, and external to internal. Price runs from an inside zone toward an outside pool, then from that pool back to an inside zone. The whole range breathes between these two states, over and over.
- First, price sweeps an external pool at one extreme, taking the liquidity resting there.
- Next, price reverses and seeks internal liquidity, a fair value gap or order block inside.
- Then price reacts at that internal zone, offering a low-risk entry.
- Now price delivers toward the opposite external pool, the draw on liquidity.
- Last, price sweeps that pool too, and the cycle begins again from the other side.
The first graphic below maps this loop. It shows external liquidity at both extremes and internal liquidity between them, with arrows tracing the path price takes.

Choosing Which External Pool Is the Draw
Both external pools cannot be the target at once, so pick one before you trade. The higher-timeframe bias usually decides it. When the daily trend points up, the external high above the range is the draw, and the low below is only a spot to sweep for fuel. When the trend points down, the roles flip. So read direction on the big chart, then let the small chart time the entry.
Order flow inside the range adds a second clue. If price keeps leaving bullish gaps and defending them, the market is building toward the high. If it keeps leaving bearish gaps and rejecting rallies, the low becomes the more likely draw. Weigh both the trend and the internal footprints, since together they point at the pool price actually wants.
When Both Pools Get Taken
Sometimes price sweeps one external pool, reverses, then sweeps the other before trending. That double raid clears liquidity on both sides and traps early traders twice. Patience is the only defence. Wait for a clean reaction at internal liquidity after the second sweep, rather than guessing which raid is the real one. The market often needs both pools before it commits to a direction.
Where This Fits the ICT Workflow
This split works as a routing map, not a standalone signal. First, mark the range and label the external pools at each extreme. Then mark the internal zones between them. Set a bias from the wider structure, and note which external pool is the likely draw. A bullish bias points to the external high, and a bearish bias points to the external low.
Next comes the entry. Wait for price to sweep the opposite external pool, then reverse into an internal zone that matches your bias. So a bullish plan wants a sweep of the external low, a reaction at an internal fair value gap, then a run toward the external high. Our ICT dealing range guide shows how to anchor the range that holds these pools.
Session Timing in New York Hours
Timing sharpens the map because external sweeps cluster around the session opens. The London kill zone near 2:00 AM New York time often raids one external pool, and the New York morning from 8:30 to 11:00 New York time delivers toward the other. So mark the range before London and watch which external pool gets swept first. The smart money indicators catalog can highlight these pools and zones for you, while the full guide to liquidity sweep trading covers the raids in depth.
Worked Example: Buying Internal Liquidity on Gold
Rules feel abstract until you price a real setup. The chart below walks a gold (XAUUSD) 1-hour sequence from external sweep to internal entry, and it runs long toward the external high.

- First, the range: an external high at 4166.13, an external low at 4106.72, and a midpoint at 4136.43.
- Next, the bias: the daily chart pointed up, so the external high stood as the draw on liquidity.
- Then the sweep: early London ran price to 4104, taking the external sell-side pool below the low.
- The reversal: price rejected the sweep and displaced up, leaving a bullish fair value gap from 4134.46 to 4144.16.
- The entry: that gap is internal liquidity, so a long went in on the retrace with a stop just below the gap at 4130.
- Last, the target: the external high at 4166.13, about three times the stop distance away.
Price paid does the quiet work. A long filled near 4139 buys at internal liquidity, right after the external sweep. The external high offers a target about three times the defined risk. Also notice the discipline the model enforces. Buying at the external low itself, before the sweep completed, would have handed the trade to the very raid that set it up. The free Fibonacci calculator helps you place the internal zones against the range midpoint with exact numbers.
Managing the Gold Trade
Manage the position with the same map that framed it. Many traders bank a partial as price reclaims the midpoint at 4136.43, slide the stop to entry, then let the rest work toward the external high. Others exit fully at the midpoint on quiet days and hold runners only when the daily bias backs the move. Choose one plan before entry and write it down. The range hands you the levels, and a trade journal keeps you honest about following them.
Download the complete indicator database
Put these concepts on your charts. One email unlocks the full library of 1,380+ indicators with compiled MT4 and MT5 files, plus my TradingView scripts. No paywall, no spam, unsubscribe any time.
Get free access to my indicator database
One email unlocks 1,380+ free MT4, MT5 and TradingView indicators — the complete library. No single-tool download; you get the whole database.
Common Mistakes and Their Fixes
Range errors sink more trades than entry errors, and a few of them dominate beginner journals. Most come from confusing a destination with a waypoint. Each mistake below carries a plain correction you can apply on the very next chart.
- Entering at an external pool. Fix: external liquidity is a target, so wait for the sweep and reverse into internal liquidity.
- Targeting an internal zone. Fix: aim for the opposite external pool, since that is where price is drawn.
- Ignoring the bias. Fix: match the internal entry and external target to the higher-timeframe direction.
- Trading before the sweep. Fix: let the external pool get taken first, then look for the reaction inside.
- Confusing every gap with an entry. Fix: use only internal zones that form after a clear external sweep.
- Skipping relative equal highs and lows. Fix: mark those flat pools, since they draw price hardest.
The second graphic pairs internal against external side by side for a fast pre-session review.

A Pre-Trade Checklist for Range Liquidity
Run these seven lines before any entry that leans on the range. A single failure sends the trade back to the watchlist.
- The range is marked with external pools labelled at both extremes.
- Internal zones, the fair value gaps and order blocks, are marked inside.
- The bias names which external pool is the likely draw.
- Price has swept the opposite external pool first.
- A reaction at an internal zone confirms the reversal.
- The target is the opposite external pool, with room to run.
- The stop sits beyond the swept extreme, and the journal line is written first.
Also score a month of trades against this list. The line you skip most often is your leak, and fixing one leak beats learning three new setups.
Related Concepts to Study Next
This split connects to several ideas worth learning together. The draw on liquidity guide explains how to pick which external pool price is truly reaching for, which sets your target. Then the liquidity pool and buy-side and sell-side guides linked above deepen your read of the external pools themselves. Also, the dealing range guide shows how to build the frame that holds both internal and external liquidity in the first place.
When the Model Fails
Ranges break, and when they do the map dissolves. If price closes decisively beyond an external pool without reversing, it is not sweeping that pool but breaking through it. So a trader waiting for the usual reversal into internal liquidity gets run over as price expands away. That is the main failure mode, and it happens most in strong trends.
Weak internal zones are the other trap. Not every gap or block holds, and price often slices through a shallow one on its way to the external pool. Hence weight the quality of the internal zone, favouring fresh gaps left by strong displacement over stale ones price has already tested.
A Failure Walkthrough on EURUSD
One failure repeats more than the rest, and the chart below shows it. EURUSD sweeps the external low, and a trader buys the reversal at an internal gap, targeting the external high. Yet the daily trend was firmly down, so the bounce was shallow. Price rolls back, breaks the external low, and keeps falling.

Resolution comes fast. Price closes below the external low, the long stops out, and the honest read appears. The sweep was really a breakout, and the internal gap never had the strength to reverse a strong down move. Thus the invalidation rule stays simple: a decisive close beyond the swept external pool kills the setup. Journal whether the higher-timeframe bias backed the trade, because entries against the trend cause most of these failures.
FAQ
What is internal and external range liquidity?
External range liquidity rests at the swing high and swing low of a range, where stops and breakout orders sit. Internal range liquidity lives inside the range, in fair value gaps and order blocks. Price draws toward the external pools and reacts at the internal zones.
Do I enter at internal or external liquidity?
Enter at internal liquidity and target external liquidity. An internal zone gives a low-risk entry with a tight stop after an external sweep. The opposite external pool then becomes your target, since that is where price is drawn. Reversing the roles, by entering at a pool and aiming at a gap, is the most common way beginners misread the model.
How do I tell external liquidity from internal?
External liquidity is easy to see, sitting at the obvious swing high and swing low. Internal liquidity hides between them, in gaps and blocks that need a trained eye. If it is a range extreme, it is external; if it sits inside, it is internal. A quick test helps: ask whether other traders would place stops there, since stops gather at external pools rather than at internal zones.
What is the internal to external sequence?
Price runs from an internal zone toward an external pool, sweeps it, then reverses back to an internal zone before delivering to the opposite external pool. That loop repeats, so the range shuttles between inside and outside liquidity over and over. Learning to see the loop turns a messy chart into a clear sequence of destinations and waypoints.
How does this relate to a dealing range?
The dealing range is the frame, and these two liquidity types fill it in. The external pools sit at the range extremes, and the internal zones sit between the midpoint and the edges. Reading both turns a plain range into a routing map for price. The midpoint of the dealing range often lines up with the strongest internal zones, which makes it a natural first target.
Does this model work on stocks and crypto?
The framework applies to any market with clear ranges, and traders use it on indices, metals, and crypto. Yet each market sweeps and reverses at its own pace, so test the model on your instrument first. Thinner markets often leave cleaner pools, while very liquid ones can absorb a sweep without much reaction. Results are not guaranteed; past performance is not indicative of future results.
External references
- For background on this concept, see Liquidity pool on Wikipedia.
- For broader market context, see Trading Range at Investopedia.

About the author
Written by Dominic Walsh, a Forex trader and MT4/MT5 indicator, Expert Advisor and script developer. Every tool on forexmt4systems.com is tested on live charts before release and ships with ready-to-use compiled MT4 (.ex4) and MT5 (.ex5) files. Learn more about the trader and developer behind this site.
How we build, test and correct every tool: Editorial & Testing Policy. Trading carries risk; see the disclaimer.