
An inversion fair value gap (IFVG) is a fair value gap that failed — price closed straight through it, and the zone flipped roles. So old support became resistance, or old resistance became support. That polarity flip is one of the cleanest continuation setups in the ICT toolkit.
This guide gives you the complete IFVG entry model: the confirmation close, the retest entry, stop placement, targets, and the exact invalidation rules. Also, it builds on our full guide to fair value gap trading, which covers gap basics; here we go deeper into the inversion play itself. So by the end, you will be able to trade an IFVG from first candle to exit.
What Is an Inversion Fair Value Gap?
Start with the parent concept. A fair value gap (FVG) is a three-candle imbalance: the wicks of the first and third candles never overlap, leaving a slice of price the market delivered only once. The methodology comes from Michael Huddleston, the Inner Circle Trader (ICT). So in normal use, a bullish FVG acts as support on the retest, and a bearish FVG acts as resistance.
Now the inversion. Sometimes price returns to a bullish FVG and, instead of bouncing, closes decisively below it. The gap has failed as support. Yet it is not dead — it inverts. Instead, the same zone now acts as resistance, because the trapped buyers who defended it are underwater and eager to exit near breakeven. Hence the name: inversion fair value gap. The EURUSD one-hour chart below shows the full life cycle — a bullish gap between 1.14422 and 1.14660 forms, fails, and flips into resistance.
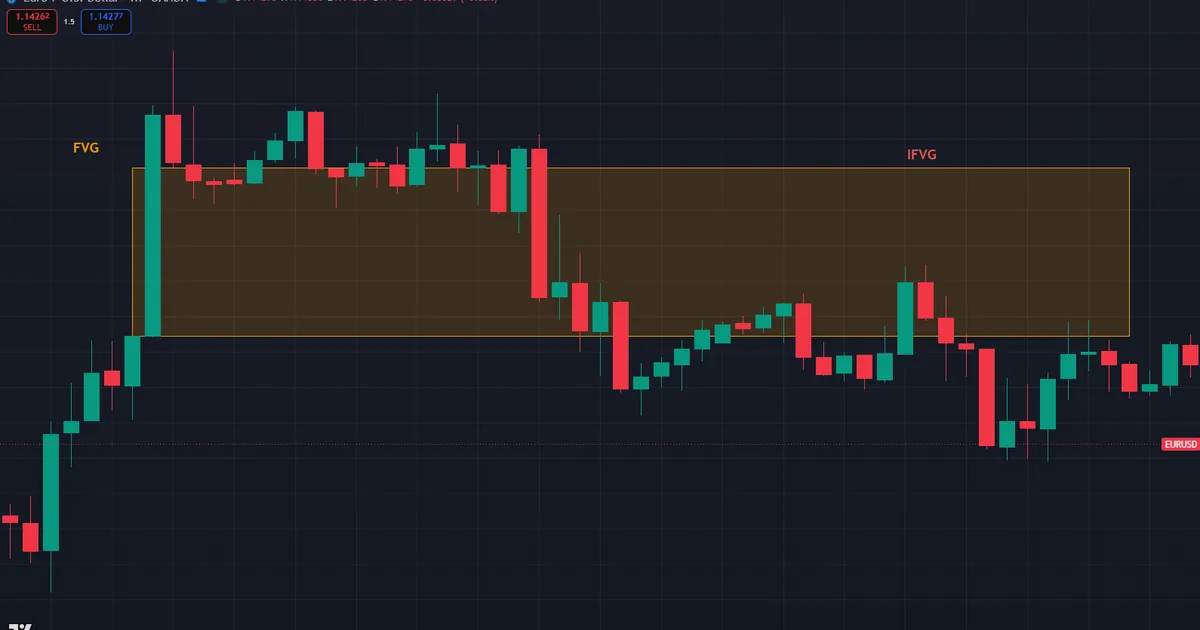
Trace the frame in order. First, the bullish fair value gap printed between 1.14422 and 1.14660, and gap traders watching it expected support on the retest. Then, through July 14 and 15, sellers closed price down through the entire zone — not a wick, but body closes beneath 1.14422. That failure re-labeled the area. On the later rally, price climbed back into the same slice, stalled, and rejected as resistance, exactly where the IFVG label sits. The old floor had become the ceiling.
FVG vs IFVG: The Polarity Flip
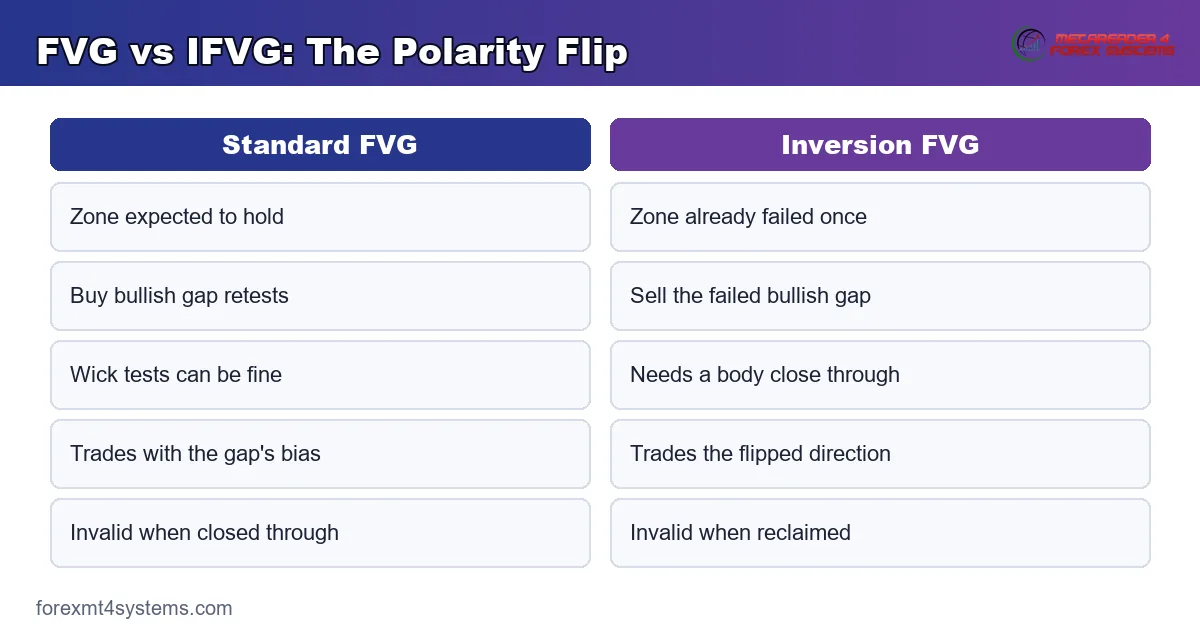
The distinction is simple but critical. A standard FVG trade expects the gap to hold: buy a bullish gap’s retest, sell a bearish gap’s retest. Meanwhile, an IFVG trade expects the opposite, because the holding attempt already failed. First price must close through the gap — not wick through it. Then the zone’s role reverses, and you trade the retest from the other side.
Direction flips too. A failed bullish FVG becomes a bearish IFVG that you sell against. Meanwhile, a failed bearish FVG becomes a bullish IFVG that you buy against. Also note what powers the flip: displacement. The close through the gap should come from an energetic leg, the same candle quality we dissect in our guide to displacement in trading. Plainly, a limp drift through a gap inverts nothing. The graphic below condenses the two roles into one side-by-side reference.
Why the Flip Works: Trapped Orders
The inversion is not chart mysticism; it runs on stranded positions. Think about who acted at the original gap. Buyers stepped in at the bullish FVG expecting support, and the failure close left every one of them underwater. Their unfilled hope now works against them: each rally back toward the zone is their chance to exit near breakeven, and their selling caps the move.
Meanwhile, the side that forced the failure has the opposite incentive. The displacement close through the gap printed their position on the tape, and the flipped zone marks their entry neighborhood. So on the retest, they defend it — adding to shorts where their trade began. Two crowds, one zone, both selling: that confluence is the rejection you see on the chart.
Also, resting orders stack the same way. Stops from the trapped side sit just beyond the zone, while fresh limit orders from the winning side sit inside it. Hence the clean reactions at a first retest — and the fading power of every later tap as those orders get consumed.
How to Trade the IFVG: Full Entry Model
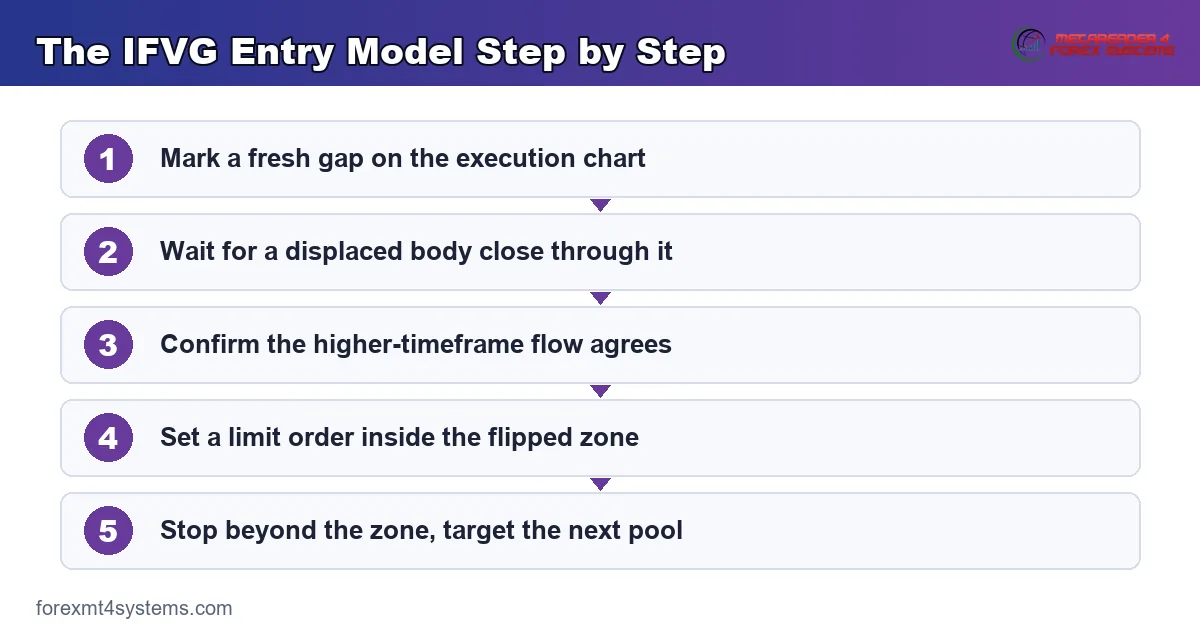
Here is the complete sequence for a bearish IFVG short; mirror every step for longs.
- Mark a fresh bullish FVG on your execution timeframe — five-minute or fifteen-minute charts work well. Note its top and bottom precisely.
- Wait for the failure close. A candle body must close below the entire gap. Displacement quality matters: big body, small wick, ideally breaking a nearby swing low at the same time.
- Confirm context. The failure should agree with a higher-timeframe draw on liquidity — for example, price rejecting a four-hour supply zone above.
- Set the entry. Place a limit order inside the inverted gap, favoring its lower half for a tighter fill on the retest.
- Place the stop. A few pips above the high of the inverted gap, or above the swing high that produced it for a more conservative trade.
- Target liquidity. Aim for the next obvious pool — relative equal lows, a session low, or the origin of the failed move. Then take partials at the first pool.
- Size the position from the stop distance, never the other way around. Our position size calculator turns stop distance and risk percentage into an exact lot size.
Notice what the model never does. It never chases the failure candle itself. Instead, it waits for the market to return to the flipped zone, where the stop is small and the target is far away.
Invalidation: When an IFVG Dies
Every setup needs a kill switch, and the IFVG has three. First, a body close back through the inverted gap cancels the inversion outright. If price reclaims a failed bullish FVG with a full candle body, the short idea is gone — no averaging, no waiting.
Second, time decay applies. The retest should arrive within roughly one to two dozen candles on the execution timeframe. Still no retest after that? Hence the market has usually chosen another path, and chasing a stale zone is a losing habit.
Third, repeated taps weaken the zone. Each touch consumes the resting orders that make the level react. Plainly, the first retest is the trade; the third retest is a coin flip. So treat a zone that has been tapped repeatedly as spent.
Write all three rules down before the entry, not after. The reclaim close, the candle-count limit, and the tap count are objective, so they belong in your plan as hard lines. Deciding them in advance removes the mid-trade negotiation that turns a small planned loss into a large improvised one.
Worked Example: GBPUSD Five-Minute Chart
Set the scene in the New York morning, 9:30 a.m. Eastern. GBPUSD has been climbing and prints a bullish FVG between 1.2644 and 1.2652. Next, price taps the gap once and bounces weakly to 1.2665, failing to make a new high. Then the failure: a strong bearish candle closes at 1.2636, straight through the gap, and takes out the 1.2640 swing low in the same stroke.
Now the zone is a bearish IFVG. A trader places a sell limit at 1.2648, inside the inverted gap. Meanwhile, the stop goes at 1.2657, above the gap high. Twenty minutes later price retests 1.2649, rejects, and sells off toward the relative equal lows at 1.2601. First partial comes at 1.2610, and the runner targets the London low at 1.2585. So risk was 9 pips against roughly 40 pips of range — location, not prediction, did the work.
Now flip the outcome to see invalidation in action. Suppose the retest candle had closed at 1.2656, back inside the gap, and the next one had closed above 1.2652. Plainly, the inversion is void at that moment. Hence the trader cancels the order or exits at once, taking the small planned loss instead of arguing with the tape.
In the actual sequence, the aftermath stayed clean. The pair never printed a body close back above 1.2652, ground through both targets by lunchtime, and left the inverted zone untouched for the rest of the session. Note the asymmetry that makes the model work: the planned loss was 9 pips, while the delivered move ran more than four times that distance.
Fitting the IFVG into the ICT Workflow
The inversion play works best as the final step of a top-down read. First comes bias: the daily and four-hour charts define the draw on liquidity. Then the sweep-and-shift sequence on lower timeframes tells you a reversal is underway. Indeed, IFVGs shine at exactly that moment, because early reversals strand fresh gaps against the new direction, and each inversion offers a continuation entry with a tight stop.
Pair the timeframes deliberately. A practical stack reads bias from the four-hour chart, marks the failed gap on the one-hour or fifteen-minute chart, and executes the retest on the five-minute chart. Also, one strong filter: the best inversions form right after a structure break in the new direction, so the flipped zone and the fresh trend agree. An IFVG that argues with the active four-hour trend is a countertrend gamble, not a continuation entry.
Session timing sharpens it further — the 8:30 to 11:00 a.m. New York window produces the displacement that makes inversions stick. Also, knowing how gaps differ from order blocks keeps your chart honest; our fair value gap vs order block breakdown draws that line. Automation helps too. Our Inversion FVG Tracker for TradingView flags the failure close and re-colors inverted zones in real time, and the broader set of ICT indicators for MT4 and MT5 covers structure and sweep detection around it.
Download the complete indicator database
Put these concepts on your charts. One email unlocks the full library of 1,380+ indicators with compiled MT4 and MT5 files, plus my TradingView scripts. No paywall, no spam, unsubscribe any time.
Get free access to my indicator database
One email unlocks 1,380+ free MT4, MT5 and TradingView indicators — the complete library. No single-tool download; you get the whole database.
Worked Example 2: A Bullish IFVG on EURUSD
Now run the long side, step by step, on the fifteen-minute chart. EURUSD has drifted down through the London morning and prints a bearish FVG between 1.1448 and 1.1456 during a weak bounce. Sellers expect that zone to cap any rally. The four-hour chart, however, has just swept a major low and turned — the larger flow points up.
Then the failure comes. At 8:45 a.m. New York time, a strong bullish candle closes at 1.1462, clean above the entire gap, and breaks the 1.1458 lower high in the same push. The bearish gap has failed, and the zone flips into support. The chart below shows the failed gap, the displacement close, and the retest entry in sequence.
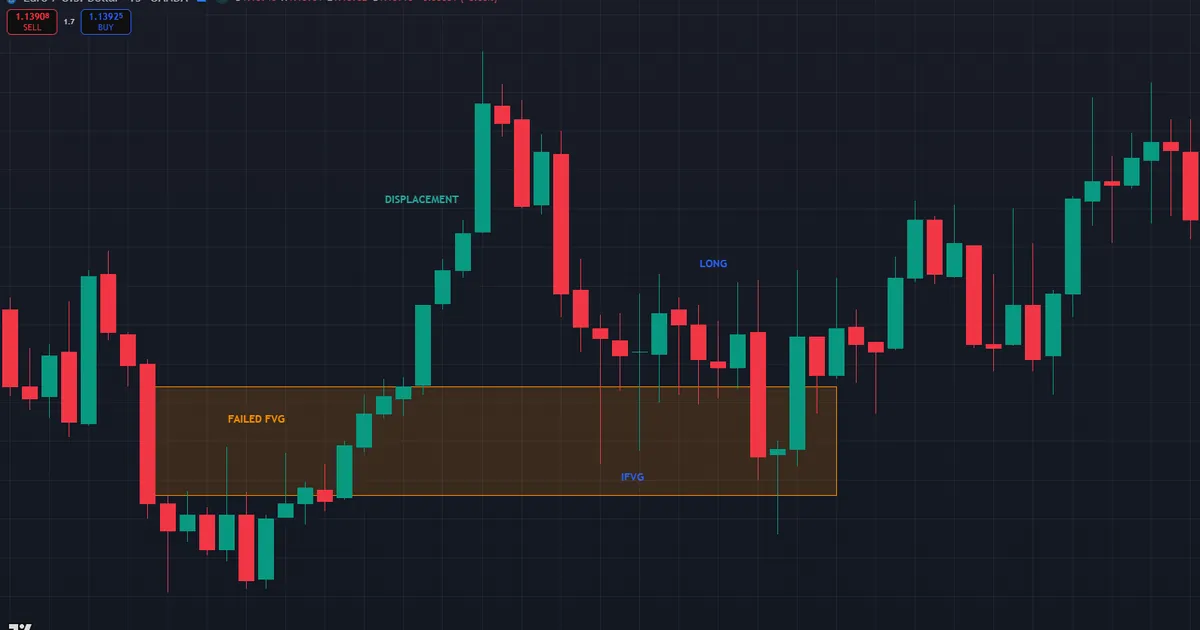
Next, the trade assembles. A buy limit waits at 1.1450, inside the flipped zone. The stop hides at 1.1442, below the inverted gap — 8 pips of risk. Meanwhile, the target sits at the equal highs near 1.1495, where buy-side orders pool; our guide to buy side and sell side liquidity explains why those shelves attract price. An hour later the retest fills, holds, and the pair grinds up through the morning to tag 1.1495. Same model as the short — only mirrored.
Common Mistakes and How to Fix Them
The inversion play fails for predictable reasons. The graphic below gathers the five most common, and the fixes follow.
Counting a wick as a failure
A wick through a gap is often a liquidity grab, and the gap can still hold. So demand a full candle body beyond the far edge before you call any inversion.
Chasing the failure candle
Shorting the close through the gap means a wide stop and a stretched price. Instead, place the order inside the flipped zone and let the retest come to you.
Trading tiny gaps
A two-pip gap on a five-minute chart is spread noise. Filter for zones wide enough to hold your stop math — usually five pips or more on majors. A quick sanity test helps: if the spread plus slippage eats a third of the zone, the setup has no edge left to give.
Fighting the higher timeframe
An inversion against the active four-hour trend invites a fast reclaim. Take only the flips that agree with the larger flow or follow a fresh structure break.
Reusing a spent zone
Each tap eats the resting orders inside the zone. Trade the first retest, respect the second, and skip the third entirely. Mark the tap count directly on your chart when you draw the zone, so the decision is already made before price returns.
Pre-Trade Checklist
Confirm every line before the retest fills. Seconds here save accounts.
- The original gap was fresh and clearly marked, top and bottom.
- A candle body closed through the entire gap with displacement.
- A nearby swing broke on the same push.
- The flip agrees with the higher-timeframe draw on liquidity.
- An active session window — London or New York — is open.
- Entry sits inside the flipped zone, stop just beyond it.
- The target is a real pool: equal highs or lows, a session extreme, or the failed move’s origin.
Failure Walkthrough: The Inversion That Re-Inverted
Now watch the setup break, because this failure mode catches everyone once. EURUSD prints a bullish FVG on the fifteen-minute chart, and a bearish leg closes through it — a textbook flip into resistance. A trader sells the retest. Then the trap: the retest candle refuses to reject. It closes inside the zone, the next candle closes above the gap top, and within an hour price runs the swing high that started the failure leg. The chart below shows the re-inversion, with the reclaim candle marked.
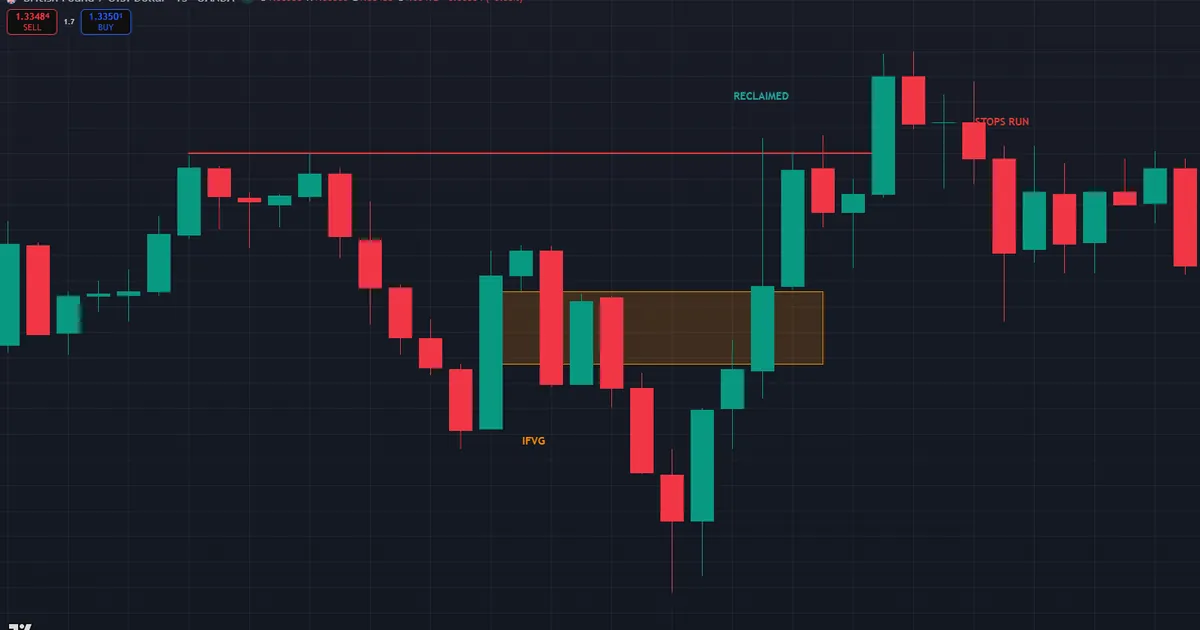
The diagnosis usually lives on the higher timeframe. In this case the failure leg was itself a raid — a sweep of sell-side liquidity inside a four-hour uptrend — so the “failed” gap sat in the path of a larger reversal. The invalidation rule caps the damage: one body close back through the inverted gap voids the setup. Exit on that close, take the planned loss, and never average into a re-inverting zone.
Then log the failure properly. Record the timeframe of the flip, whether the failure leg displaced, what the four-hour chart was doing, and how the session clock read. Re-inversions cluster in choppy conditions and countertrend contexts, and a few weeks of honest notes will show you exactly which flips you should have skipped.
One more habit separates careful traders here: mark the re-inverted zone on your chart afterwards instead of deleting it. A gap that has flipped twice sits in disputed territory, and price often churns around it for hours. Keeping the level visible stops you from rebuilding a fresh setup inside a zone the market has already chewed through twice.
Limitations and Honest Caveats
The IFVG inherits every weakness of gap trading, plus a few of its own. Indeed, choppy low-volume conditions produce constant gap failures that invert and then re-invert — the Asian session is notorious for this. So restrict the setup to trending, liquid windows.
News is the second hazard. Truly, a scheduled release can close price through any gap without durable order flow behind it, and those inversions fail at a high rate. Third, small gaps invert noisily; a two-pip gap on a five-minute chart is spread-level noise, not a tradable zone. Finally, the concept is discretionary. Also, two traders will sometimes disagree on whether a close fully cleared a gap, which is why a written rule — body close beyond the far edge — belongs in your plan. So no zone type works without context, and losses occur even in textbook setups.
On numbers, stay skeptical: no verified success statistics exist for the IFVG, and any precise figure you encounter is marketing. The defensible claim is comparative — first retests outperform later taps, displaced failures outperform drifts, and with-trend flips outperform countertrend ones. Your own journal is the only sample that reflects your execution.
Related Concepts to Study Next
The inversion sits one step downstream of structure, so study the upstream signals next. The market structure shift tells you when a reversal is real enough to strand gaps in the first place — most quality IFVGs form in the candles right after one. Meanwhile, the displacement and gap-versus-order-block material linked earlier covers the candle quality and zone taxonomy that keep your chart labels honest. Chain them together and the IFVG stops being a pattern and becomes a consequence you can anticipate.
FAQ
What does IFVG mean in trading?
IFVG stands for inversion fair value gap. It is a fair value gap that price has closed through, flipping the zone’s role from support to resistance or from resistance to support. Then traders look for entries on the retest of the flipped zone.
What is the difference between an FVG and an IFVG?
An FVG is expected to hold as support or resistance on its first retest. Instead, an IFVG is a gap that already failed that job. So the trade direction reverses: a failed bullish gap becomes a zone to sell, and a failed bearish gap becomes a zone to buy.
Does a wick through a gap create an inversion?
No. The standard rule requires a candle body to close beyond the far edge of the gap. Indeed, wicks through a zone are often just liquidity grabs, and the gap can still hold afterward.
What is the difference between an IFVG and a breaker block?
Both are polarity flips, but the failed object differs. A breaker block is an order block that price traded through, while an IFVG is a failed three-candle imbalance. Traders often find the two overlapping in the same reversal zone, which strengthens the level. When they disagree, most practitioners rank the breaker higher, because it marks actual positioned candles rather than skipped pricing.
What timeframe is best for trading inverse fair value gaps?
Most practitioners execute on one-minute to fifteen-minute charts during the London and New York sessions, while anchoring bias on the four-hour and daily charts. Meanwhile, higher-timeframe IFVGs are rarer but tend to produce stronger reactions.
How reliable is the IFVG setup?
Reliability depends entirely on context: displacement quality, session timing, and alignment with higher-timeframe liquidity. Still, even well-selected inversions fail regularly, so risk management decides long-run outcomes. Results are not guaranteed; past performance is not indicative of future results.
External references
- For background on this concept, see Exhaustion Gap at Investopedia.
- For broader market context, see Gap at Corporate Finance Institute.

About the author
Written by Dominic Walsh, a Forex trader and MT4/MT5 indicator, Expert Advisor and script developer. Every tool on forexmt4systems.com is tested on live charts before release and ships with ready-to-use compiled MT4 (.ex4) and MT5 (.ex5) files. Learn more about the trader and developer behind this site.
How we build, test and correct every tool: Editorial & Testing Policy. Trading carries risk; see the disclaimer.