
Displacement in trading is a sudden, one-sided burst of price. Picture a run of big-bodied candles that tears through a level as if it were not there. Indeed, in the ICT method it is the clearest footprint big players leave on a chart.
This guide shows you how to recognize a true displacement candle, how to measure whether it is strong enough to trade, and how it validates structure shifts and fair value gaps. So by the end, you will be able to grade any impulsive move in seconds and act only on the ones that carry real intent.
What Is Displacement in Trading?
The concept comes from Michael Huddleston, the Inner Circle Trader (ICT). Displacement is a burst of energy: one to three candles in a row with large bodies, tiny wicks, and a near-vertical angle. Also, the move is so fast that the market cannot trade at every level on the way. That skipped pricing leaves a fair value gap (FVG) behind.
Why does it happen? Institutions cannot fill large positions quietly. Instead, when they commit, their orders consume every resting bid or offer in the path, and price jumps between levels. Hence the two fingerprints of real displacement: abnormal candle size and a visible imbalance. Now the GBPUSD one-hour chart below shows the real thing from July 21, 2026 — a sweep of an old high, then a heavy bearish run that leaves a clean gap.
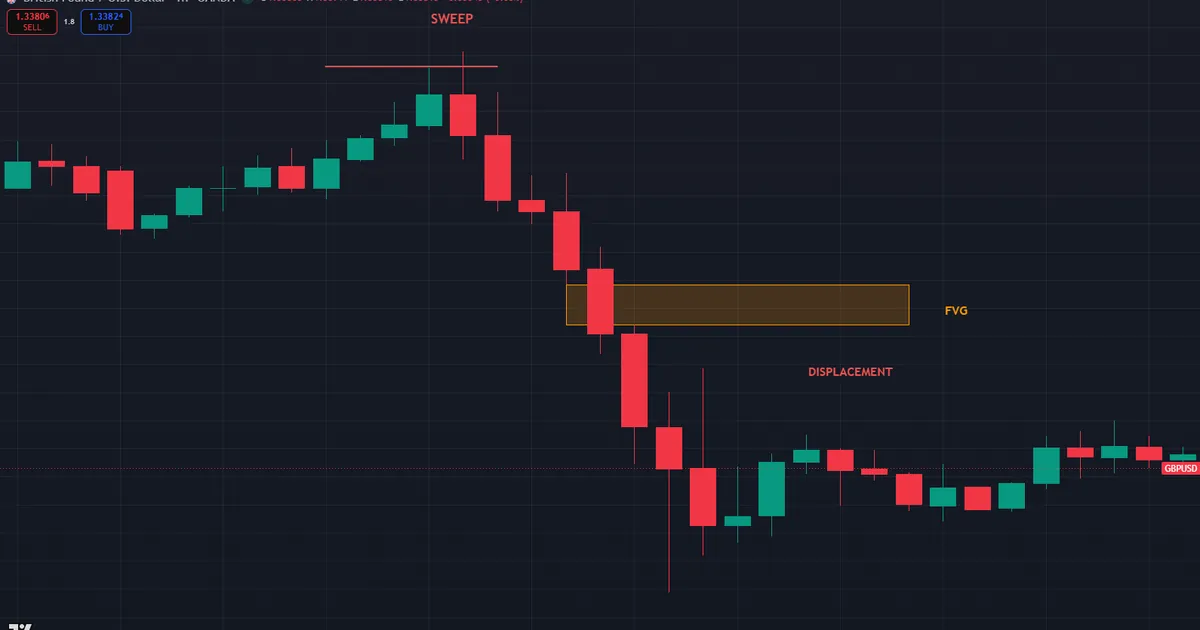
Walk the chart left to right. First, price pushed up through the old high at 1.34530, and the wick topped out at 1.34557. That poke swept the buy stops parked above the level. Then the sell side took over. A run of big red candles drove the pair all the way down to 1.33594. On the way, the burst left a fair value gap between 1.34070 and 1.34141. Note how small the wicks are next to the bodies. That look — a raid, then a fast one-way run — is the whole concept in one frame.
Not That Kind of Displacement
One quick note, because the word has older uses in chart work. First, a displaced moving average (DMA) is a normal moving average shifted left or right on the time axis. It is a plot setting, nothing more. Also, some texts use “displacement” for shifted inputs in general, and physics uses it for change in position.
None of that is what ICT traders mean. Instead, displacement here is a property of raw price action itself: the violent leg that reveals institutional urgency. So keep the definitions separate when you research, or search results will mix the two constantly.
A quick test settles any confusion. Ask whether the word describes a setting you typed into an indicator or a move the market made on its own. Then the first is a DMA; the second is ICT displacement.
The mix-up matters for study time too. Type the bare word into a search bar and half the results teach the moving-average setting. So add “ICT” or “smart money” to the query when you research, and you will land on the price-action meaning every time.
What Strong Displacement Looks Like
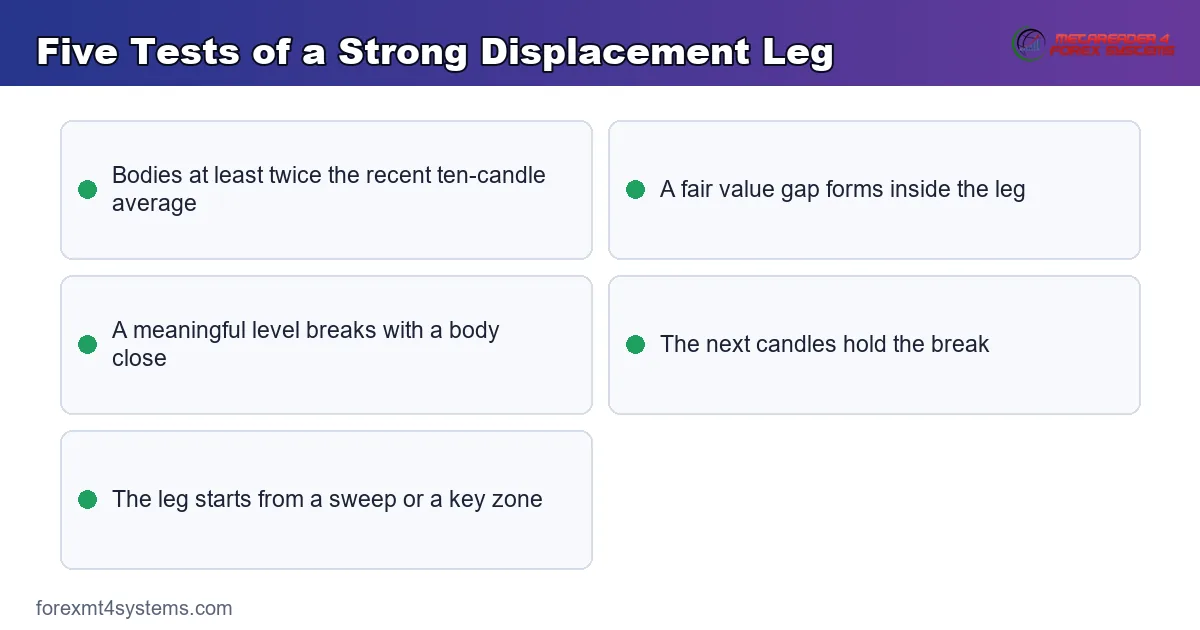
Grade every candidate leg against five observable tests.
- Body dominance. The candle bodies should be at least two to three times the average body of the previous ten candles. Meanwhile, wicks stay small relative to the body.
- A fair value gap forms. In a three-candle window, the wicks of candles one and three never overlap. No gap suggests no urgency. Also, our imbalance detector indicator marks these zones automatically.
- A level breaks. Real displacement takes out something that matters — a swing point, an old high or low, or a session extreme — with a body close beyond it.
- Follow-through. Then the next candles must hold the break rather than collapsing back through it immediately.
- Context. The leg starts right after a liquidity sweep or from a higher-timeframe zone, not from the middle of nowhere.
The tests work identically in both directions. Bullish displacement is a stack of expansive green bodies breaking upward through a lower high or range top. Meanwhile, bearish displacement is the mirror image: heavy red bodies collapsing through a higher low. Symmetry matters, because your grading standard must not loosen when a move agrees with your bias.
The Failure Case: No Displacement
Now contrast the failure case: “no displacement.” Price drifts through a swing low in small overlapping candles, leaves no gap, and stalls. Plainly, that break carries no institutional signature. Thus ICT traders skip it, no matter how clean the level looked. The graphic below packs all five tests into one card you can keep by your screen.
Whose Orders Cause the Burst
Put names on the players and the move makes sense. On one side sit the big accounts. They need size, and size needs fuel. So they wait for a raid on an obvious high or low, where stops and breakout orders pool. Those resting orders are the other side of their fill.
Then the burst starts, and three crowds push the same way at once. The big accounts drive with their entries. Trapped traders bail out, and their exits add force. Meanwhile, breakout chasers jump on the moving candles. Hence the near-vertical angle: everyone acts in the same direction inside a few minutes.
Stops finish the job. Each level the leg clears fires another cluster of them, and each cluster kicks price further along. That chain is why a true burst skips levels and leaves a gap. A quiet drift has no such chain behind it — which is exactly why it earns no trust.
This also explains the retest. The players who drove the burst left orders in the gap, and trapped traders pray for a return to their entry. So when price comes back to the zone, both groups act — one defends, one exits — and the level holds. The burst writes the map; the retest is where the trade lives.
How Displacement Validates MSS, CHoCH, and FVGs
Displacement is the quality filter for every other smart money concept. Structure first: a break below a higher low is only a tentative change of character until displacement drives it, at which point it becomes a full market structure shift and justifies a bias flip. So the same break can be noise or signal, and candle quality is what separates them.
Gaps second. Indeed, an FVG born from strong displacement is a high-interest zone, because the same institutions that created it often defend it on the retest. Meanwhile, a gap left by a random news spike or a thin-market wobble attracts far less follow-up interest. The full guide to fair value gap trading covers how to trade those retests in detail.
There is a third role, too. When price later closes through a displacement-built FVG, the zone flips polarity and becomes an inversion setup — a mechanism we break down in the inversion FVG guide. Truly, the strength of the original displacement is what gives every one of these levels its meaning.
Worked Example: EURUSD Fifteen-Minute Chart
Picture the New York morning, 8:30 a.m. Eastern. EURUSD has ranged overnight between 1.0880 and 1.0905. First, price dips to 1.0876, sweeping the range low and the stops beneath it. Then the reversal fires: three consecutive bullish candles close at 1.0894, 1.0916, and 1.0931.
Measure the leg. Average body size overnight was roughly 6 pips; these three bodies average 18 pips. Next, the middle candle leaves a fair value gap between 1.0898 and 1.0906. Also, the move closes above the 1.0905 range high — a meaningful level — and holds it. Hence every displacement test passes.
Now comes the trade location. Price retraces into the 1.0898–1.0906 gap about an hour later. Traders using this model buy inside the gap, set the stop under the 1.0876 sweep low, and target the prior day’s high at 1.0958. So the risk is roughly 25 pips against a 55-pip objective, with the sweep low as a clean invalidation point. Also, comparing this leg against typical pair movement with our forex volatility calculator confirms the burst was abnormal — which is exactly the point.
The aftermath sealed the case. Price held the gap on a second tap in the afternoon, then pushed through 1.0940 and tagged 1.0958 the next morning. At no point did a body close back under the 1.0898 gap floor. So the invalidation line never moved, and the trade needed no rescue decisions — the mark of a leg with real orders behind it.
Displacement in the Wider ICT Workflow
Displacement is a confirmation event, never an entry trigger on its own. The working sequence runs in order. First, set higher-timeframe bias and mark the liquidity pools price is drawing toward. Second, wait for a sweep of one of those pools. Third, demand displacement in the opposite direction — that is your proof the raid was a trap and the reversal is funded. Then, and only then, hunt entries in the FVG or the 62–79% retracement of the displaced leg. Skipping the sweep step is how traders end up buying random large candles.
Pair your timeframes on purpose. A common split reads bias on the four-hour chart, marks the zone on the one-hour, and hunts the burst on the five- or fifteen-minute chart. Also, mind the clock. Most real bursts on EURUSD and GBPUSD fire in the London open, 2:00–5:00 a.m. New York time, or the New York morning, 8:30–11:00 a.m. A burst at 3:00 p.m. on a Friday deserves doubt by default.
Chasing the big candle itself is the classic beginner error. Indeed, entry at the top of a displacement leg means a wide stop and a poor price, while the retracement usually offers both. Also, tools help with discipline here: the library of ICT indicators for MT4 and MT5 includes structure, gap, and sweep detection that keeps the sequence honest.
Download the complete indicator database
Put these concepts on your charts. One email unlocks the full library of 1,380+ indicators with compiled MT4 and MT5 files, plus my TradingView scripts. No paywall, no spam, unsubscribe any time.
Get free access to my indicator database
One email unlocks 1,380+ free MT4, MT5 and TradingView indicators — the complete library. No single-tool download; you get the whole database.
Worked Example 2: A Bearish Burst on GBPUSD
Now run a short trade, step by step, on the fifteen-minute chart. GBPUSD has climbed all London morning and stalls under 1.3510. Equal highs sit at 1.3512 — a shelf of buy stops. The four-hour chart, meanwhile, points down, so the rally runs against the larger flow.
First, the raid. At 9:45 a.m. New York time, price stabs to 1.3516, clears the equal highs, and closes back below 1.3512 in the same candle. Then the burst: three heavy red candles close at 1.3492, 1.3470, and 1.3448. The middle one leaves a gap between 1.3478 and 1.3486, and the leg snaps the 1.3474 swing low on the way. The chart below shows the sweep, the burst, and the entry zone in order.

Then the trade sets up on the pullback. A sell order waits inside the 1.3478–1.3486 gap. The stop sits above the 1.3516 sweep wick, about 33 pips away. Meanwhile, the target rests at the equal lows near 1.3410, roughly 70 pips below the entry. Price taps the gap, turns, and works lower through the afternoon. Same script as the long example — raid, burst, pullback, entry — just flipped upside down.
Common Mistakes and How to Fix Them
The same errors show up in every review session. The graphic below lists the five worst, and the fixes follow.

Buying the big candle
Entry at the tip of the leg means a wide stop and a bad price. Instead, wait for the pullback into the gap the leg created. If the pullback never comes, let the trade go — a missed move costs nothing, while a chased one costs real money.
Grading with the trend, not the tape
A move that agrees with your bias always looks strong. So measure bodies against the prior ten candles every time, and let the numbers decide.
Trusting bursts with no raid before them
A burst from the middle of a range has no fuel source and fails often. Demand a sweep of a clear pool first.
Treating news spikes as intent
A data release can print perfect-looking candles that fully reverse within the hour. Check the calendar before you grade any leg near a release time.
Using one fixed pip size for every pair
Fifteen pips is huge on EURUSD in Asia and routine on GBPJPY in London. Always scale your test to the pair and the session at hand. The ten-candle body average does this for you, which is why the ratio test beats any fixed number.
Pre-Trade Checklist
Run this list before you act on any burst. It takes ten seconds.
- Higher-timeframe bias marked, and the burst agrees with it.
- A liquidity sweep printed right before the leg.
- Bodies at least twice the recent average, wicks small.
- A fair value gap sits inside the leg.
- A meaningful level broke with a body close.
- The session clock reads London or New York morning.
- Entry planned in the gap, stop beyond the sweep, target at the next pool.
Failure Walkthrough: The Burst That Faded
Now study a failure, because the chart warns you if you know the signs. Picture EURUSD just before a rate decision. The release hits, and two giant red candles rip through the day’s low — big bodies, fresh gap, level broken. On paper the leg grades well. Then the fade begins. Within four candles, price climbs back through the gap, and one hour after the release the pair closes above the broken low. The chart below shows the round trip, with the reclaim candle marked.
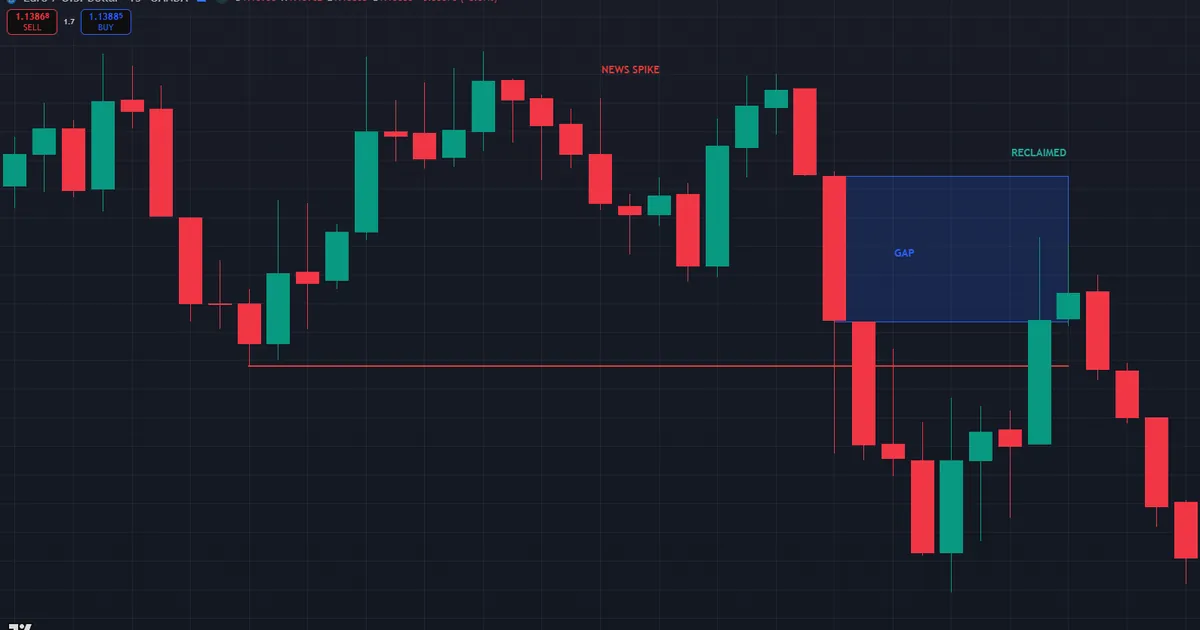
What went wrong? The burst had a headline behind it, not positioning. News legs spend all their force in one push; nobody defends the gap on the retest, because nobody built a position there. Hence the invalidation rule: once a candle body closes back through the far side of the gap, the leg is void. Exit, flat, done. Our free economic calendar flags the release windows so this trap never surprises you.
Afterwards, write the trade down. Log the pair, the time, the release name, and how the leg scored on the five tests. Most traders find their failed bursts share one flaw — no raid first, or a news candle behind the move. Your journal turns that pattern into a rule within a month of honest entries.
Grade the losers on a scale of one to five as well. A failed five-out-of-five leg is rare and worth a deep review, because it usually hides a higher-timeframe conflict you missed. Meanwhile, a failed three-out-of-five leg teaches a simpler lesson: you took a trade your own checklist had already rejected.
Limitations: When Big Candles Lie
Not every large candle shows real intent. News is the main trap here: a CPI print or a central-bank headline can create a textbook burst that fully reverses within the hour. So check the economic calendar before you trust any surge near a scheduled release.
Thin markets are the second trap. Meanwhile, during holiday sessions and the late New York afternoon, modest orders move price a long way, and candles look displaced without real participation behind them. Third, displacement against a strong higher-timeframe trend often marks exhaustion rather than reversal — the final flush, not new commitment. So treat late-trend bursts with extra suspicion.
Finally, the measurement itself is relative. Indeed, a 15-pip candle is dramatic on EURUSD in Asia and routine on GBPJPY in London. So always benchmark against the instrument’s recent bodies, not a fixed pip number. Still, even a perfect grade only narrows your attention; context and risk control decide the trade.
One more note on honesty: no fixed hit rate exists for this pattern, and any number you see quoted is invented. The fair claim is a ranked one. Bursts that follow a raid and align with the larger flow hold up better than bursts missing either piece. Build your own stats from your own logged trades.
Related Concepts to Study Next
Two neighbors round out this skill. Structure labels tell you what the burst just changed; our BOS vs CHoCH comparison sorts the with-trend break from the first warning shot. Meanwhile, the gap and inversion material linked earlier covers what happens to the zones a burst leaves behind. Read the trio in order — burst, label, zone — and the whole SMC sequence starts to feel mechanical. A simple drill builds the eye fast: scroll back one month on any major pair, mark every leg you would grade four or five, and note what price did at each gap retest. An hour of that beats a week of live guessing.
FAQ
What is a displacement candle?
A displacement candle is an unusually large-bodied candle with small wicks that drives through a meaningful level. Also, it typically forms as part of a two-or-three-candle burst that leaves a fair value gap behind.
What is displacement in forex specifically?
The mechanics match any market: one fast, one-sided leg that shows big-player order flow. So forex traders watch for it right after sweeps of session highs and lows, mostly in the London and New York hours.
How is displacement different from a displaced moving average?
A displaced moving average is a normal average shifted sideways on the chart. It is an input setting. Meanwhile, ICT displacement is a trait of price itself: the sharp leg that breaks structure and leaves gaps. Truly, the shared word is chance.
Is displacement bullish or bearish?
Either. Bullish displacement is a sharp leg up; bearish displacement is the mirror leg down. So what matters is the burst direction versus the liquidity that was just taken.
How many candles should a displacement leg contain?
Most clean legs run one to three candles on the execution chart. Longer runs can still count, yet the grading stays the same: big bodies, small wicks, a gap, and a level broken with a body close.
Can I trade displacement on its own?
Treat it as a filter, not a system. Indeed, without a prior sweep, a matching higher-timeframe bias, and a clear exit point, a big candle is just a big candle. Results are not guaranteed; past performance is not indicative of future results.
External references
- For background on this concept, see Momentum (technical analysis) on Wikipedia.
- For broader market context, see Gap at BabyPips Forexpedia.

About the author
Written by Dominic Walsh, a Forex trader and MT4/MT5 indicator, Expert Advisor and script developer. Every tool on forexmt4systems.com is tested on live charts before release and ships with ready-to-use compiled MT4 (.ex4) and MT5 (.ex5) files. Learn more about the trader and developer behind this site.
How we build, test and correct every tool: Editorial & Testing Policy. Trading carries risk; see the disclaimer.