
The BOS vs CHoCH question decides how you read every chart you open. First, a break of structure (BOS) confirms the trend is continuing. Meanwhile, a change of character (CHoCH) warns the trend may be ending. Confuse the two and you will buy tops and short bottoms with confidence.
This guide defines both breaks precisely, shows how internal and external structure changes the label, and walks through worked examples in both directions. So after reading, you will be able to label any structure break correctly and know which side of the market deserves your attention.
BOS vs CHoCH at a Glance
Both terms come from smart money concepts (SMC), the framework popularized by Michael Huddleston, the Inner Circle Trader (ICT). Also, both describe the same raw event: price closing beyond a swing point. Yet they point in opposite analytical directions. A BOS breaks a swing in the direction of the prevailing trend. Instead, a CHoCH breaks the first meaningful swing against that trend.
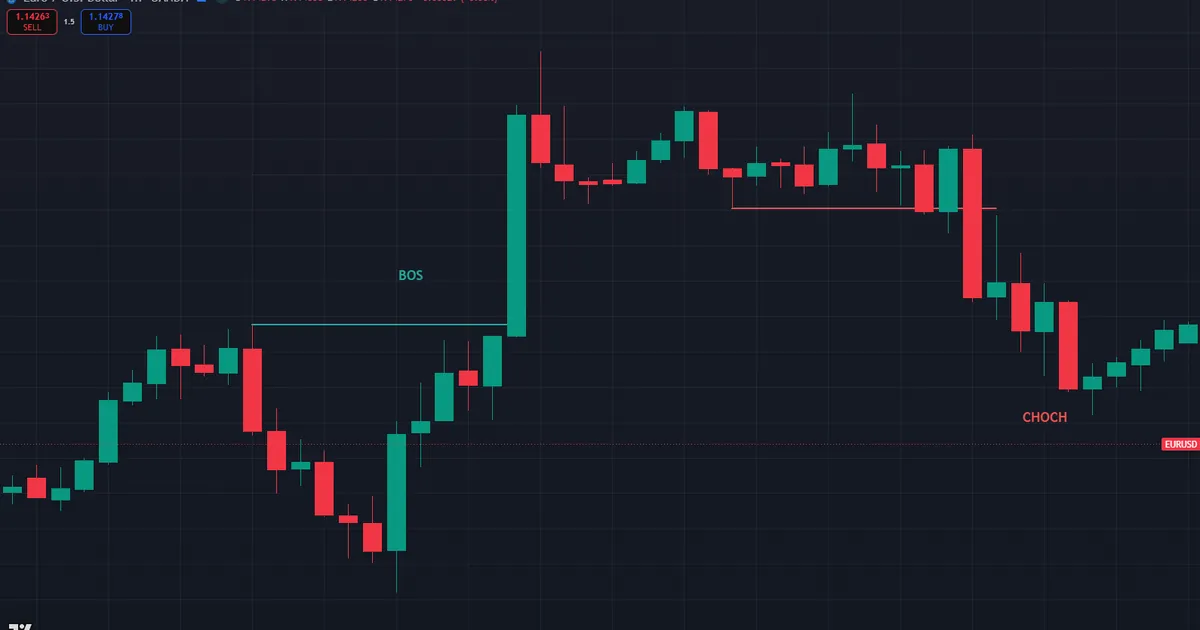
Plainly put, in an uptrend a close above the last higher high is a BOS, while a close below the last higher low is a CHoCH. Now the chart below puts both on one EURUSD one-hour sequence, so the difference is visible at a glance.
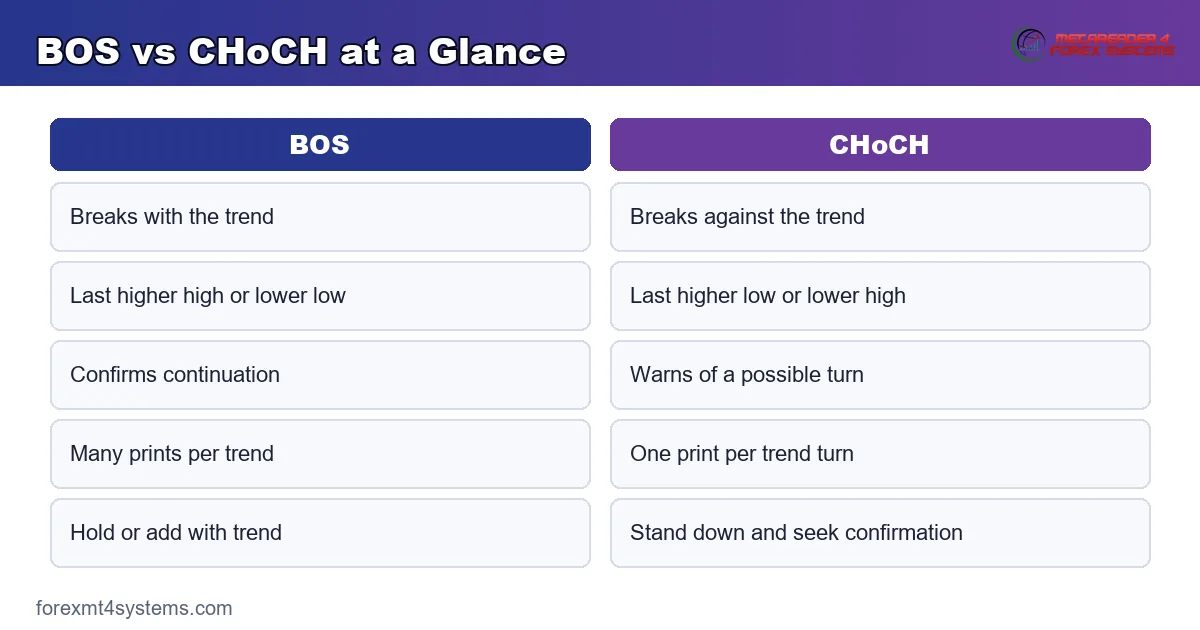
| Feature | BOS (Break of Structure) | CHoCH (Change of Character) |
|---|---|---|
| Direction | With the trend | Against the trend |
| Level broken | Last higher high / lower low | Last higher low / lower high |
| Message | Continuation confirmed | Possible reversal starting |
| Frequency | Many per trend | One per trend turn |
| Typical action | Hold or add with trend | Stand down, watch for confirmation |
Walk the frame left to right. First, the pair closes above the 1.14438 swing high — the labeled BOS — and the uptrend delivers, running on to 1.14824. On the way up, a higher low forms at 1.14602. Then the character changes: sellers force a close below that 1.14602 swing low, the labeled CHoCH, and price sinks to 1.14342. One frame, both labels, opposite messages.
What Counts as a Break of Structure
A BOS is the heartbeat of a healthy trend. In an uptrend, each new close above the previous higher high extends the structure and tells you demand remains in control. Also, the swing low that produced the break becomes the new reference: as long as price holds above it, the trend stands.
Two details keep the label honest. First, demand a candle body close beyond the swing, not a wick. A wick through a high that closes back below it is a liquidity grab, not a break. Second, use swings that matter. The high must be a true swing high — a candle with lower highs on both sides — and it should sit at the edge of the current dealing range.
Then watch what happens after each break. Healthy trends retrace shallowly, hold the new reference low, and break structure again within a reasonable number of candles. Meanwhile, a trend whose retracements keep deepening past 70% of the prior leg is telling you demand is thinning, and the next break attempt deserves suspicion. Also, count the candles between breaks: stretching intervals signal fading momentum.
What a Change of Character Really Signals
The CHoCH is the market’s first admission that character has changed. In an uptrend, buyers defend every higher low by definition. Then one day they fail, and price closes below that higher low. That single failure is the change of character.
Still, one warning is not a verdict. A CHoCH tells you to stop trading with the old trend; it does not yet prove a new one. Confirmation quality depends on displacement. Indeed, when the counter-trend break comes with large bodies and a fresh fair value gap, ICT traders upgrade it to a market structure shift. Our guide to the market structure shift covers that stricter test in depth.
Watch the retest behavior as well. After a genuine change of character, the pullback usually stalls at the broken level or inside the new imbalance, then turns away. Meanwhile, a failed CHoCH sees price reclaim the broken swing quickly, and the old trend resumes as if nothing happened. The graphic below condenses the two labels into one side-by-side reference.
Internal vs External Structure
Most labeling mistakes come from mixing structural scales. External structure means the swings that define the current dealing range — the range high and range low that everyone can see. Meanwhile, internal structure means the smaller swings printed inside that range while price travels between its edges.
Here is the rule that fixes the confusion. First, map the external range on your higher timeframe. Second, treat internal breaks as tactical information only: an internal CHoCH inside an external uptrend is often just a pullback starting, not a reversal. Third, reserve full bias flips for external breaks. Also, many internal CHoCH prints are actually inducement — engineered minor breaks that lure early sellers before the real move up resumes. Our market structure inducements indicator flags those traps automatically on MT4 and MT5.
Why would anyone engineer a fake break? Inducement creates a crowd of early sellers whose protective stops rest just above the minor high they shorted. Thus that stop cluster becomes buy-side fuel, and the larger players run price through it before delivering the real external break.
Whose Orders Sit Behind Each Break
Each label maps to a crowd of real orders, and naming them sharpens your read. Under every higher low in an uptrend sits a pool of protective sell stops from trend followers. Above every higher high rests a mix of breakout buy orders and shorts’ stop losses. So a BOS mostly consumes the orders above, while a CHoCH detonates the stop pool below.
Now think about who profits from each event. A clean BOS rewards patient longs and punishes early top-pickers, whose covering adds to the push. Meanwhile, a genuine CHoCH transfers losses onto the last wave of dip buyers — their forced exits fund the follow-through lower. Hence the follow-through itself is evidence: when the crowd on the wrong side is large, the break travels.
Stops explain the speed, and psychology explains the retest. Trapped traders anchor on their entry price and hope for breakeven. Thus the pullback to a broken level meets a wall of relieved sellers, which is why retests reject so often when the break was real.
Worked Example: GBPUSD Four-Hour Chart
Say GBPUSD has climbed for two weeks. The pair prints a higher low at 1.2618, then a higher high at 1.2705 — a clean BOS above the prior 1.2680 high. Next, price pulls back to 1.2652 and rallies again to 1.2698, falling short of the 1.2705 high.
Now the tape turns. A strong bearish sequence closes at 1.2601, through the 1.2618 higher low. That close is the CHoCH: the first counter-trend break after a series of bullish BOS prints. Also, the move displaces, leaving a gap between 1.2640 and 1.2628, which upgrades the warning to a full shift.
Then the playbook changes. Longs are off the table. Traders in this model wait for the retracement into the 1.2628–1.2640 imbalance, look for a bearish reaction, and target the liquidity under 1.2550. Indeed, logging each labeled break sharpens this skill fast; our free trade journal makes that review routine.
The aftermath validated the read. Over the next three sessions the pair stepped down in a chain of bearish BOS prints — 1.2601, then 1.2568, then 1.2544 — each launched from a pullback into the zone above. At no point did a candle body close back above 1.2640, so the bearish bias never faced a genuine challenge. That is what a completed character change looks like in hindsight.
BOS vs CHoCH vs MSS: The Full Hierarchy
Add the market structure shift and the hierarchy completes. A BOS confirms continuation. Meanwhile, a CHoCH flags the first counter-trend break, weak or strong. Then an MSS is a CHoCH that displaces through the swing with conviction, usually leaving a fair value gap. Thus the three labels form an escalation ladder: trend healthy, trend questioned, trend changed.
In practice the sequence often reads like this: sweep of an old high, failure, CHoCH, retracement, then a chain of bearish BOS prints as the new downtrend matures. Also, each bearish BOS typically launches from an order block or imbalance, which is where the full guide to order block trading takes over. New to the wider framework? First read our what is ICT trading primer, then explore the smart money indicators that map structure automatically.
Want a repeatable routine? Run these three steps on every chart open.
- First, mark the external dealing range on the four-hour chart: one range high, one range low.
- Second, label the most recent body close through a swing — with-trend means BOS, counter-trend means CHoCH.
- Then check for displacement and a fair value gap before you upgrade any CHoCH to a tradeable shift.
A Multi-Timeframe Routine That Keeps Labels Honest
Structure only makes sense inside a timeframe hierarchy. A practical split uses three layers. The four-hour chart owns the bias: its external range and latest break decide which direction you are allowed to trade. The one-hour chart owns the zone: order blocks, imbalances, and the swing most likely to break next. Then the fifteen-minute or five-minute chart owns the trigger — the actual CHoCH or BOS you execute against.
Session timing filters the noise further. Indeed, breaks printed during the London open, 2:00–5:00 a.m. New York time, and the New York morning, 8:30–11:00 a.m., carry real participation behind them. Meanwhile, an Asian-session CHoCH on a quiet pair often reflects thin books rather than intent, and it reverses at a far higher clip. So stamp every labeled break with its session before you trust it.
One warning on conflicts: when the four-hour and fifteen-minute labels disagree, the higher timeframe wins until proven otherwise. Treat the small-frame CHoCH as an early scout report, not a verdict.
A worked routine makes this concrete. Before London opens, mark the four-hour range and note the last external break. During the session, watch the one-hour chart for a sweep of a marked pool. Then, and only then, drop to the trigger chart and hunt the counter-trend close. Traders who follow this order stop labeling everything, because most candidate breaks die at the first two filters before risk ever enters the picture.
Download the complete indicator database
Put these concepts on your charts. One email unlocks the full library of 1,380+ indicators with compiled MT4 and MT5 files, plus my TradingView scripts. No paywall, no spam, unsubscribe any time.
Get free access to my indicator database
One email unlocks 1,380+ free MT4, MT5 and TradingView indicators — the complete library. No single-tool download; you get the whole database.
Worked Example 2: A Bullish CHoCH on EURUSD
Now flip the direction and drop a timeframe. EURUSD has sold off through the London morning on the fifteen-minute chart, stepping from 1.1502 down toward 1.1420. Lower highs print at 1.1478 and then 1.1452, and equal lows rest at 1.1421 — an obvious pool of sell stops sitting under the market.
First comes the raid. At 8:30 a.m. New York time, price stabs to 1.1416, clearing the equal lows, and closes back above 1.1421 within the same candle. Then the trigger: two strong bullish candles close at 1.1459, through the 1.1452 lower high. That close is a bullish CHoCH — the first counter-trend break of the whole decline — and the leg leaves an imbalance between 1.1432 and 1.1441. The chart below shows the sweep, the break, and the entry zone in sequence.
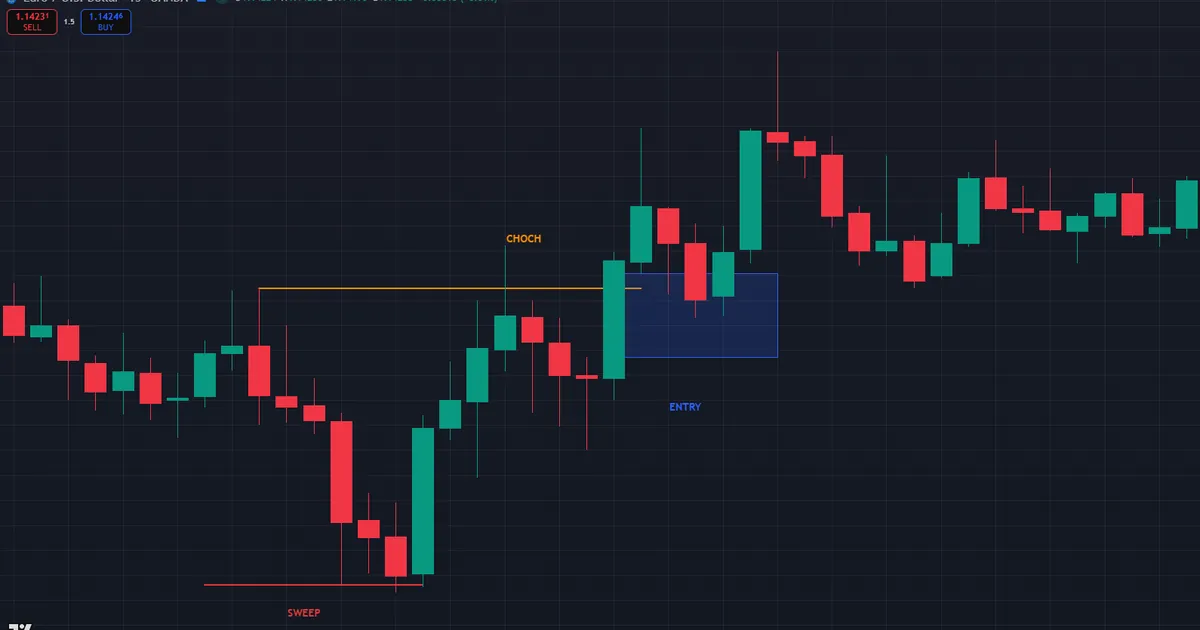
Then the trade assembles step by step. Entry waits at the 1.1432–1.1441 imbalance on the retracement. The stop tucks under the 1.1416 sweep low, roughly 20 pips of risk. Meanwhile, the first target sits at the 1.1478 lower high, and the session high near 1.1502 waits beyond it. Notice the discipline: no long existed until the sweep, the CHoCH close, and the retest all lined up in order.
Common Mistakes and How to Fix Them
Labeling errors repeat in predictable ways. The graphic below gathers the five we see most, and each fix follows beneath it.
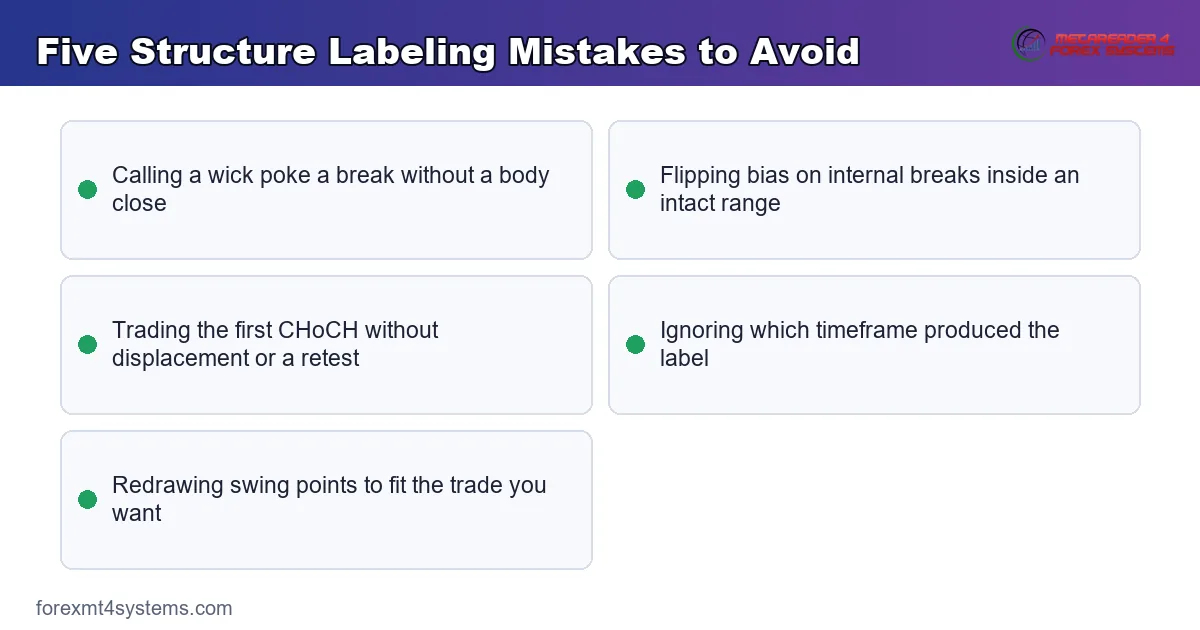
Calling every wick a break
A wick through a swing with a close back inside is a liquidity grab, not a BOS or CHoCH. So demand a full candle body beyond the level before you label anything.
Flipping bias on internal breaks
An internal CHoCH inside an intact external range is usually a pullback or inducement. Instead, reserve bias flips for breaks of the range edge that everyone can see.
Trading the CHoCH without confirmation
The first counter-trend break fails often. Wait for displacement, a fair value gap, or a clean retest before committing risk to the new direction. If none of those arrive within a dozen candles, downgrade the label to noise and re-mark the structure from scratch.
Ignoring the timeframe stamp
A fifteen-minute CHoCH inside a four-hour uptrend is a scout report, not a reversal. Always note which timeframe produced the label and rank it accordingly.
Redrawing swings after the fact
Moving your swing marks to fit the trade you want is self-deception. Define your swing rules once — fractal count, body-versus-wick — and apply them mechanically.
Pre-Trade Checklist
Run this list before acting on any labeled break. It takes seconds and filters most bad trades.
- External range mapped on the four-hour chart.
- The broken swing sits at a range edge, not inside chop.
- A candle body closed through the level.
- The break direction agrees with the higher-timeframe bias, or displacement proves a genuine turn.
- A liquidity sweep preceded any counter-trend break.
- An active session — London or New York — produced the break.
- Entry, stop, and target all mapped before the retest arrives.
Failure Walkthrough: The CHoCH That Lied
Now study the failure case, because it teaches more than the wins. GBPUSD trends up on the one-hour chart and pulls back after a BOS. A minor swing low breaks by a few pips — small candles, no gap, mid-session lull. Many traders mark it as a CHoCH and short the retest. Then the trap springs: within three candles, price reclaims the broken level with a strong body close and rips to a fresh high, running every stop above the minor swing. The chart below shows the sequence, with the weak break and the reclaim candle labeled.
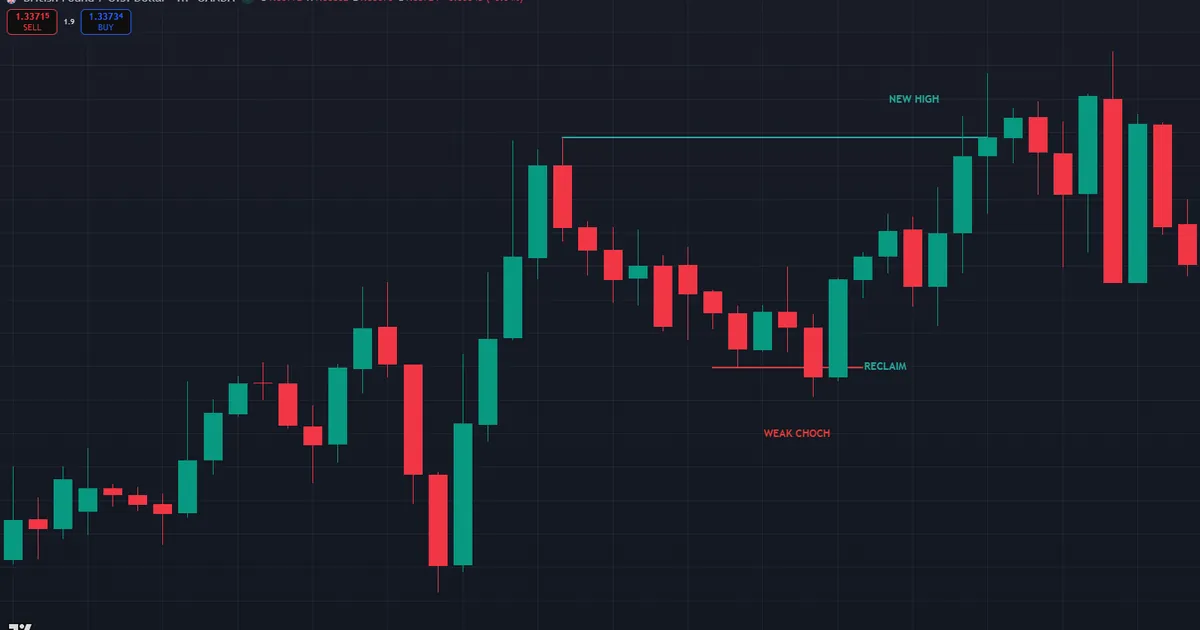
The diagnosis is textbook inducement: an engineered internal break that recruited early sellers, whose stops then fueled the real move. Our guide to inducement in trading dissects this trap in detail. The invalidation rule keeps the damage small — once a body closes back through the broken swing, the CHoCH idea is void. Exit immediately, without averaging and without hoping.
Afterwards, log three facts: the timeframe of the break, whether displacement accompanied it, and whether a sweep preceded it. Weak breaks that skip those ingredients fail in clusters, and your own journal will show that pattern faster than any course. Two extra columns pay for themselves here: the candle count between the break and the reclaim, and the pip distance the fake move traveled before reversing. Both numbers shrink noticeably on genuine breaks, so tracking them builds an evidence-based feel for which prints deserve your risk.
Limitations and Honest Caveats
Structure labels are descriptive, not predictive. Indeed, ranging markets print alternating BOS and CHoCH signals that mean nothing, because there is no trend to continue or change. So always check the higher timeframe first; inside a daily consolidation, four-hour labels mislead more than they help.
Subjectivity is the second problem. Also, swing selection varies between traders, and indicators using different fractal settings will label the same chart differently. Third, news candles can break any swing without institutional intent behind the move. Finally, a CHoCH fails often enough that trading it without displacement, liquidity context, and a defined invalidation level is guesswork. So treat every label as one input in a stacked decision, never as the decision itself.
On statistics, stay honest: no fixed reliability number exists for either label, and any source quoting one made it up. What can be said qualitatively is directional — external breaks outperform internal ones, displaced breaks outperform drifts, and session-timed breaks outperform dead-hour prints. Build your own numbers from your own journal.
Related Concepts to Study Next
Two neighboring ideas complete this map. Displacement is the candle-quality test that separates a meaningful break from a technical one; our guide to displacement in trading shows how to grade it in seconds. Meanwhile, the market structure shift you met earlier formalizes the upgraded CHoCH. Stack the three — label, quality test, upgraded signal — and structure reading becomes a routine rather than an argument. A practical drill cements it: replay one week of any major pair on the one-hour chart, label every break aloud, then grade each label against what followed. Twenty minutes of that exercise teaches more than another hour of theory.
FAQ
What does CHoCH mean in trading?
CHoCH stands for change of character. It is the first close beyond a counter-trend swing point — below the last higher low in an uptrend, or above the last lower high in a downtrend. Thus it warns that the prevailing trend may be turning.
Is a CHoCH bullish or bearish?
Either. A bearish CHoCH breaks below a higher low in an uptrend. Meanwhile, a bullish CHoCH breaks above a lower high in a downtrend. So the label describes the break’s relationship to the prior trend, not a fixed direction.
Can a BOS and a CHoCH happen at the same level?
Yes, on different timeframes. Indeed, a four-hour CHoCH can be a one-hour BOS, because the smaller timeframe may already be trending in the new direction. So always state the timeframe when you label a break.
Does a break of structure need displacement too?
Strictly, no — any with-trend body close beyond the swing counts as a BOS. Still, a displaced BOS with a fresh imbalance carries more information, because it leaves a zone the trend can defend on the next pullback.
Which is stronger, a CHoCH or an MSS?
An MSS is the stronger signal. It is a CHoCH that breaks with displacement — large candle bodies and a fair value gap. Meanwhile, a CHoCH without displacement is only an early warning.
Should I trade every CHoCH I see?
No. Instead, most practitioners require a liquidity sweep before the break, displacement through the swing, and higher-timeframe alignment before acting. Even then, position sizing and stops matter more than the label. Results are not guaranteed; past performance is not indicative of future results.
External references
- For background on this concept, see Trend at Investopedia.
- For broader market context, see Chart Analysis at StockCharts ChartSchool.

About the author
Written by Dominic Walsh, a Forex trader and MT4/MT5 indicator, Expert Advisor and script developer. Every tool on forexmt4systems.com is tested on live charts before release and ships with ready-to-use compiled MT4 (.ex4) and MT5 (.ex5) files. Learn more about the trader and developer behind this site.
How we build, test and correct every tool: Editorial & Testing Policy. Trading carries risk; see the disclaimer.