
Inducement in trading is engineered bait: a small, obvious pullback level that tempts traders into entering early, right before price sweeps their positions and delivers into the real zone of interest. Smart money concepts (SMC) traders shorten it to IDM. So by the end of this guide, you will be able to spot inducement on a chart, place it inside the inducement-after-BOS sequence, and stop being the trader it was built for.
The concept features heavily in the teaching of Michael Huddleston, the Inner Circle Trader (ICT), and across the wider SMC school. It sounds abstract at first. Yet on a chart it reduces to one repeatable structure, and that structure is learnable in an afternoon.
What Is Inducement in Trading?
Inducement is minor liquidity resting between current price and a deeper point of interest (POI), such as an order block or a fair value gap. The minor level looks like a valid entry, so early traders position there. Then their stops settle just beyond it, forming a small pool of resting orders. Hence the name: the level exists to induce participation.
Price sweeps that pool first. The triggered stops create the burst of orders that carries price into the deeper POI, where larger participants actually want to transact. So the minor level was never the destination. Plainly, it was the fuel for the trip.
Think of IDM as a miniature, purpose-built pool in the sense our guide to the liquidity pool in forex explains: the same mechanics as the big session pools, compressed into a single pullback swing.
The Hero Chart: EURUSD Bait and Delivery
Now anchor the definition on a real chart. The EURUSD 1-hour chart below shows the whole sequence. A minor pullback low printed at 1.14258 and looked like a ready-made long entry. The real point of interest sat lower: a demand zone spanning 1.14060 to 1.14200, the origin of the prior rally.
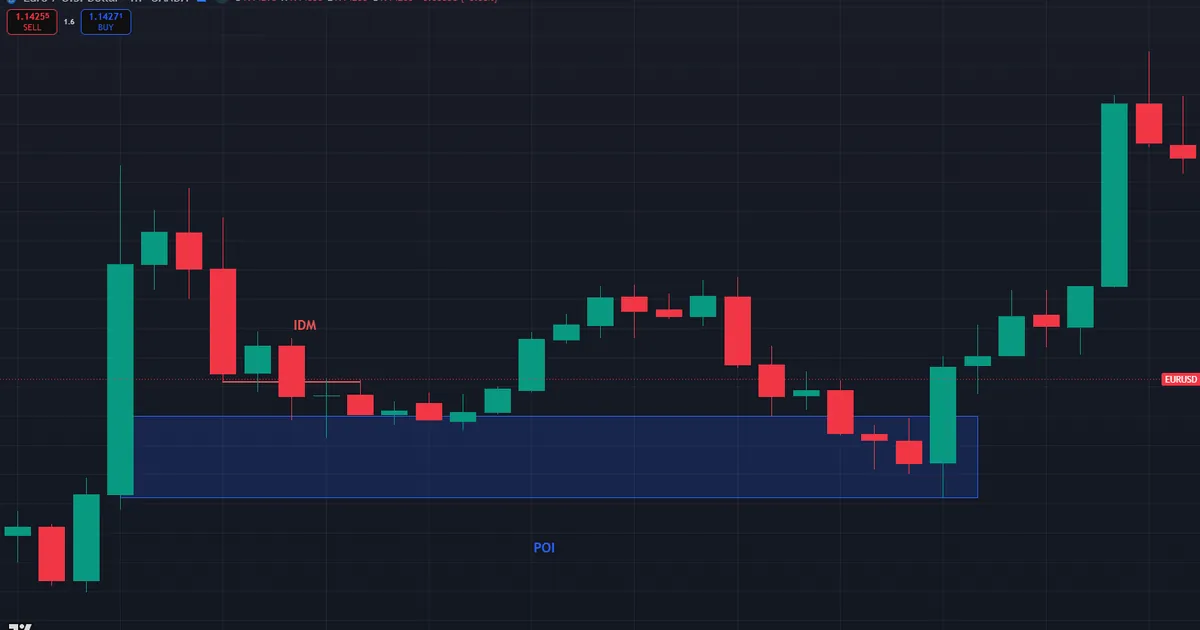
Follow the route price takes. The 1.14258 low gets swept first, and the sell stops beneath it fire as market sells. That burst delivers price straight into the 1.14060-1.14200 zone, where the real buying interest waited. From inside the zone, EURUSD turns and climbs to 1.14824, more than fifty pips beyond the swept low. Whoever bought the bait funded the trip; whoever waited for the zone rode it.
Note the width of each level too. The POI spans fourteen pips, from 1.14060 to 1.14200, while the bait was a single minor swing. Real interest tends to occupy space, because size cannot fill at one tick. When your planned “entry” is a line and the deeper zone is a band, you are probably looking at the bait.
Why Inducement Exists
Retail education trains a uniform habit: after a breakout, buy the first pullback. Millions of traders act on it, so their behavior is predictable. Thus the first minor swing low after a bullish break collects early long entries, and a tight cluster of sell stops builds a few pips beneath that swing. Meanwhile, the pattern repeats because the curriculum never changes.
Large buyers want the opposite location. Their orders rest at the deeper POI, often an unmitigated order block below; the full mechanics live in our guide to order block trading. To reach that zone with sellers available, the market first trips the stops under the minor swing. Hence the early entries are not collateral damage. Indeed, they are the point.
The psychology compounds after the sweep. Stopped-out longs feel robbed, watch price rally from the zone below, and chase the move late, adding fuel a second time. Meanwhile, the traders who understood the sequence entered where the induced group exited. Every stage transfers positioning from the impatient to the prepared, and no stage requires anyone to see anyone else’s orders.
Inducement vs Stop Hunt
The two ideas overlap but sit at different scales. A stop hunt is any raid on a stop cluster, wherever it forms. Inducement is more specific: the minor pool that forms inside a pullback, directly in front of a POI, and gets consumed on the way there. So every inducement sweep is a small stop run, while most stop runs at session extremes have nothing to do with IDM. Thus scale separates the two labels in practice. Vocabulary also drifts between educators, so define levels by location and role rather than by name; the chart does not care what anyone calls a swing.
The Inducement-After-BOS Sequence
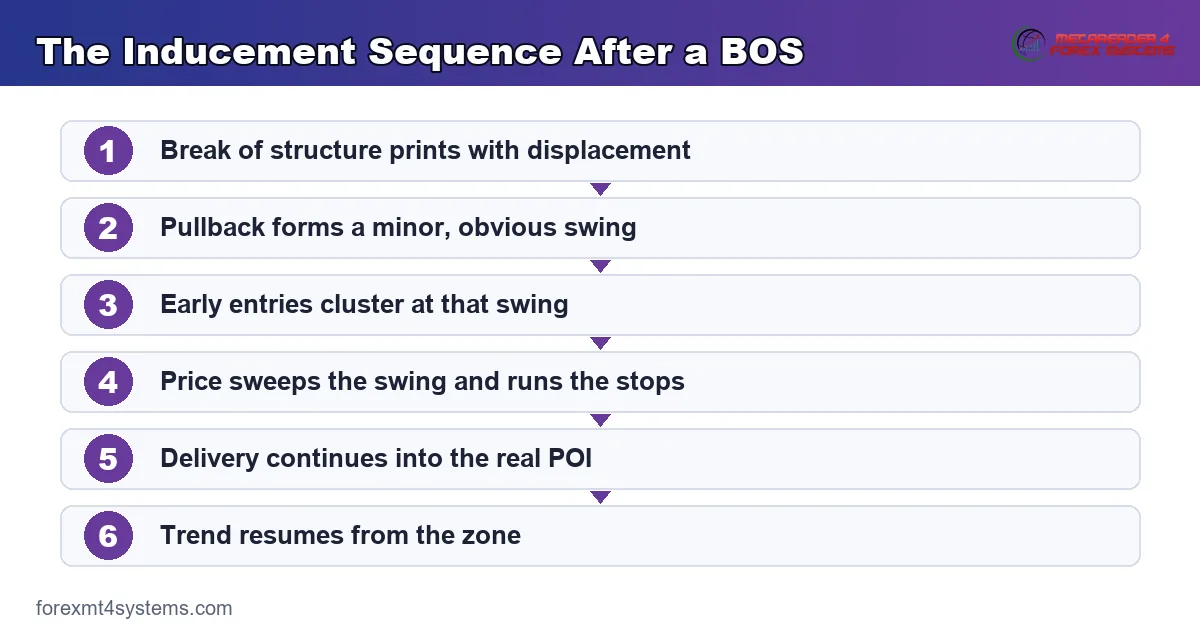
A break of structure (BOS) is a close beyond the previous swing point in the direction of the trend; it signals continuation. Inducement gets its power from what follows a BOS. The bullish version runs like this:
- Price closes above the last swing high with displacement, printing a bullish BOS.
- A pullback begins from the new high.
- The pullback pauses and prints a minor higher low. This swing is the IDM candidate.
- Early longs enter at that higher low, stops beneath it.
- Price sweeps the IDM, running those stops.
- The move extends into the true POI below, then the trend resumes.
Bearish setups mirror every step. Also note the sequencing rule many SMC traders apply: a POI earns trust only after the inducement in front of it has been taken. No sweep, no entry. Truly, that one rule filters most premature trades. Write the six steps on a card and tick them in order, because skipping a step is how the sequence quietly turns back into guessing. The flow below compresses the whole sequence into one glance.
How to Spot Inducement Step by Step
Work from structure down to the trigger:
- Define the dealing range: the swing low to swing high that produced the latest BOS.
- Mark the POI inside that range, such as the order block that launched the breakout leg.
- Look between current price and the POI. The first minor swing in that gap is your IDM candidate.
- Confirm it is obvious. Real inducement looks like a clean entry level; subtle swings attract few orders.
- Wait for the sweep. Price should run the IDM and keep going toward the POI, not bounce there.
- Plan the entry at the POI, not at the IDM, with the stop beyond the zone.
Retracement depth adds a useful filter. Inducement swings often form in the shallow third of the pullback, while strong POIs sit deeper, frequently inside the 62-79% optimal trade entry (OTE) zone. So run the levels with our fibonacci calculator and stay suspicious of “entries” parked well above the 50% mark. Also expect the IDM to look better than the real zone; bait works because it looks attractive. Then let the checklist veto the impulse.
IDM on Lower Timeframes
The same sequence fractals down. An H1 pullback contains its own M15 break, pullback, and minor swing, so an M15 IDM often sits inside the H1 route to the deeper zone. Trade the timeframe you marked. Sweeping an M15 bait level says nothing about the H1 zone below it, and mixing the two mid-trade is how clean plans dissolve into improvisation.
What the Evidence Can Support
Be honest about the evidence as well. No public data set counts IDM sequences, so nobody can quote a true completion percentage, and backtests suffer from hindsight labeling. What holds up qualitatively: obvious swings attract orders, sweeps of those swings precede many zone fills, and displacement separates delivery from drift. Tag each sequence in your own journal and let your sample speak.
Worked Example 1: GBPUSD After a Bullish BOS
Picture GBPUSD breaking above a swing high at 1.2710 with a wide-bodied hourly candle, a clean bullish BOS. The launch leg started from an order block at 1.2664-1.2672, still unmitigated. Then the pullback begins, and price prints a minor higher low at 1.2688 before bouncing a few pips.
That 1.2688 swing is textbook IDM. Early longs buy the bounce with stops near 1.2683, well above the order block. Next, during the London morning, price rolls over, trades to 1.2681, and keeps sliding into 1.2670, inside the order block. So the induced longs are out, and their stops helped deliver price to the real zone.
Now the actual setup appears. Longs entered around 1.2670 with stops under 1.2660 target the high above 1.2710, roughly 10 pips of risk against 40 or more of room. Both traders held the same bias. Yet the sequence decided which one survived, and that is the entire lesson of inducement. Indeed, location did all the work. Manage the winner at structure: trail the stop behind each new higher low and bank partials into the 1.2710 retest, because delivered trades still fail sometimes.
Inducement in the Wider SMC Workflow
IDM is a timing refinement, not a standalone system. Bias still comes first from the higher timeframe: trend, draw on liquidity, and premium versus discount. If those fundamentals are new, start with our overview of what ICT trading is, then layer inducement on top. Next, add IDM only once the basics feel routine.
Inside that workflow, IDM answers one narrow question: has the obvious early entry been swept yet? Before the sweep, patience. Then, after the sweep, attention, because the POI beneath is next. Meanwhile, marking BOS levels and IDM swings by hand teaches the pattern quickly, and our market structure inducements indicator automates the same detection on MT4 and MT5, alongside the broader set of ICT indicators for MT4 and MT5.
Timeframes and Session Timing
Pair the charts top-down. Mark the BOS, the POI, and the IDM candidate on H4 or H1, then drop to M5 or M15 to watch the sweep unfold in real time. London and New York opens do most of the sweeping: roughly 2:00 to 5:00 a.m. and 7:00 to 10:00 a.m. New York time. An IDM that survives the Asian session often gets taken in the first London hour. So set an alert at the IDM level and stop staring at every candle between the windows. Midweek sequences, Tuesday through Thursday, also tend to print cleaner than Monday drift or Friday position squaring.
Download the complete indicator database
Put these concepts on your charts. One email unlocks the full library of 1,380+ indicators with compiled MT4 and MT5 files, plus my TradingView scripts. No paywall, no spam, unsubscribe any time.
Get free access to my indicator database
One email unlocks 1,380+ free MT4, MT5 and TradingView indicators — the complete library. No single-tool download; you get the whole database.
Worked Example 2: Bearish Inducement Into Supply
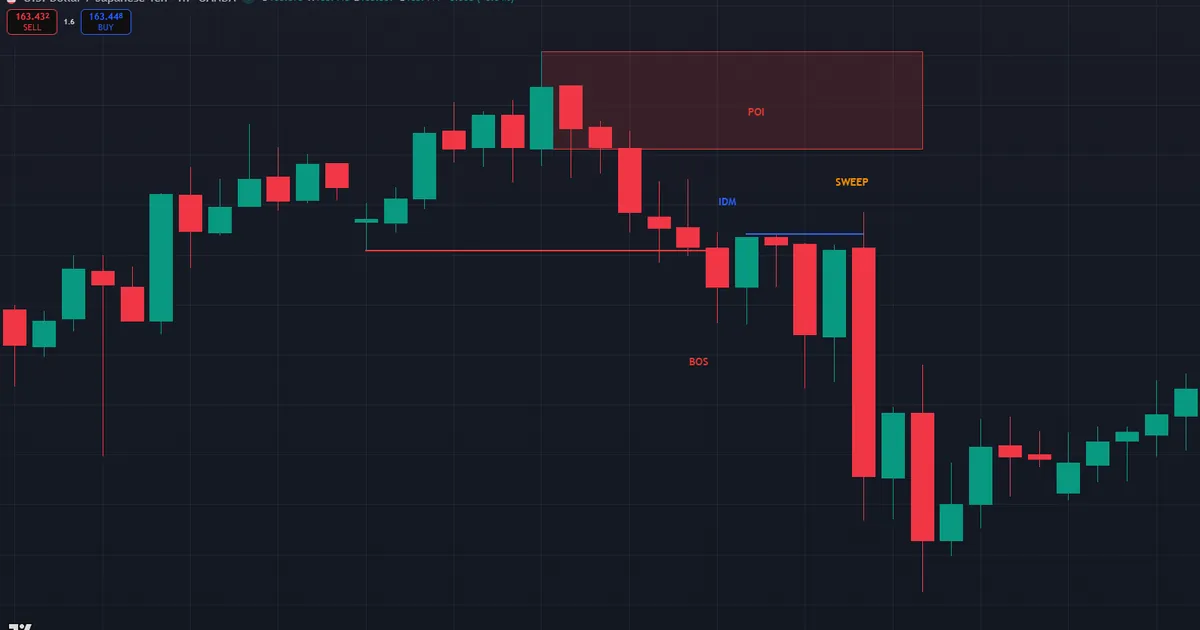
Now mirror the sequence to the short side. Picture USDJPY breaking below a swing low at 155.40 with a strong hourly candle, a clean bearish BOS. The launch leg fell out of a supply zone at 156.05-156.25, still unmitigated. Then the pullback climbs and stalls at a minor lower high of 155.78.
That 155.78 swing is the bait. Early shorts sell it with buy stops near 155.85, well below the supply zone. Work the steps:
- Confirm the bearish BOS at 155.40 and mark the 156.05-156.25 supply as the POI.
- Label the minor lower high at 155.78 as the IDM candidate.
- Wait while price sweeps above 155.85, running the early stops.
- Watch delivery continue into 156.10, inside the zone.
- Plan the short inside the supply with a stop above 156.30, beyond the zone.
- Target the swing low at 155.40 first, then the next sell side pool beneath it.
The annotated chart below shows this bearish version with the BOS, the IDM sweep, and the POI reaction labeled.
Reading the Short Once It Fills
Direction changed; the logic did not. The stop sits beyond the supply because a close-and-hold above it would say the pullback is really a reversal. Meanwhile, the first target is the BOS low, since delivered price tends to revisit the level that started the sequence. Manage at structure: trail behind each lower high, and close the remainder if price prints a fresh higher low above the zone. No stage of this depends on prediction, only on the order of events.
Notice who is trapped at each stage. The early shorts from 155.78 covered at a loss into the sweep, and breakout buyers who chased the push above 155.85 bought the top of the delivery leg. Their exits and entries both handed the supply zone its counterparties.
Common Mistakes and How to Fix Them
Five errors repeat endlessly around IDM. Each has a correction:
- Buying the first pullback level. That level is usually the bait. Fix: require the minor swing to be swept before the POI earns trust.
- Labeling subtle swings as IDM. Bait works because it is obvious. Fix: if the level would not tempt a course-taught trader, it is not inducement.
- Entering at the IDM sweep itself. The sweep is delivery, not destination. Fix: plan the entry at the POI beneath, with the stop beyond the zone.
- Forcing the label onto every pullback. Strong trends skip the sequence entirely. Fix: no clear IDM, no setup; skip rather than invent.
- Ignoring the higher timeframe bias. A perfect IDM against the daily draw is still a bad trade. Fix: run the sequence only in the bias direction.
- Moving the stop inside the zone. A probe deeper into the POI is normal delivery. Fix: keep the stop beyond the far edge and size for that distance from the start.
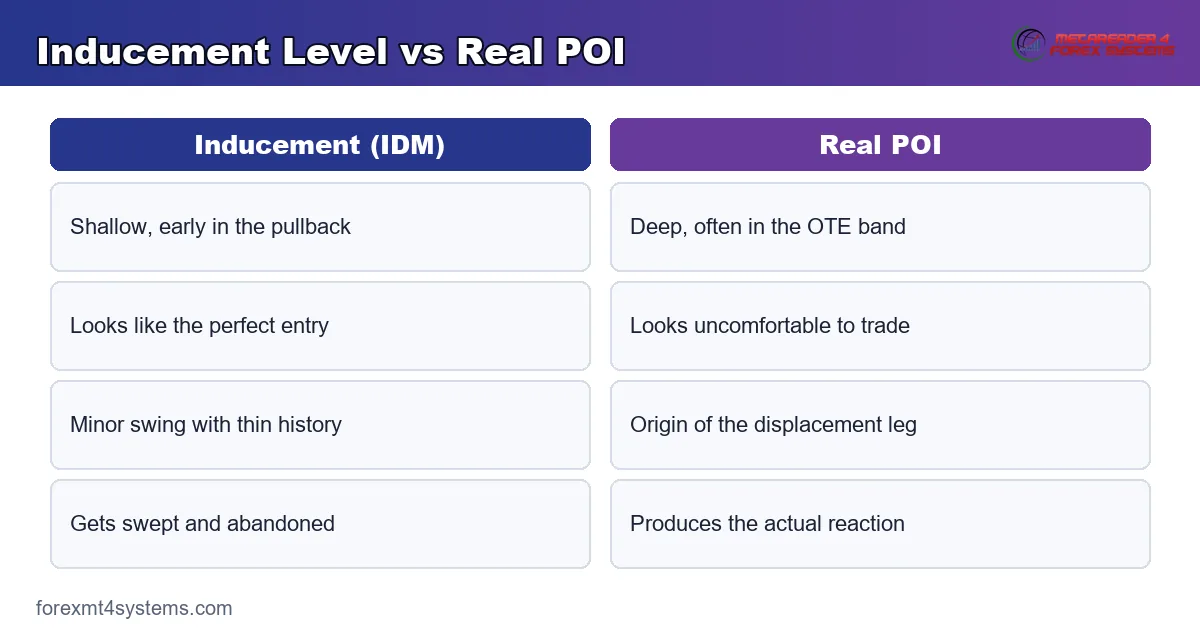
The comparison below separates the bait from the destination at a glance. Keep it beside the platform until the distinction is reflex.
Pre-Entry Inducement Checklist
Check every line before committing to an IDM-based trade:
- Is there a fresh BOS with displacement on H1 or H4?
- Is the POI marked, and did it launch the breakout leg?
- Does an obvious minor swing sit between price and the POI?
- Has that swing been swept, with delivery continuing toward the zone?
- Does the POI sit in the deeper part of the pullback, near the OTE band?
- Is the stop planned beyond the zone, never inside it?
- Does the whole idea point with the daily bias?
- Have I logged the sequence, with screenshots, before the outcome is known?
When the Sequence Fails: Sweep, Then Straight Through
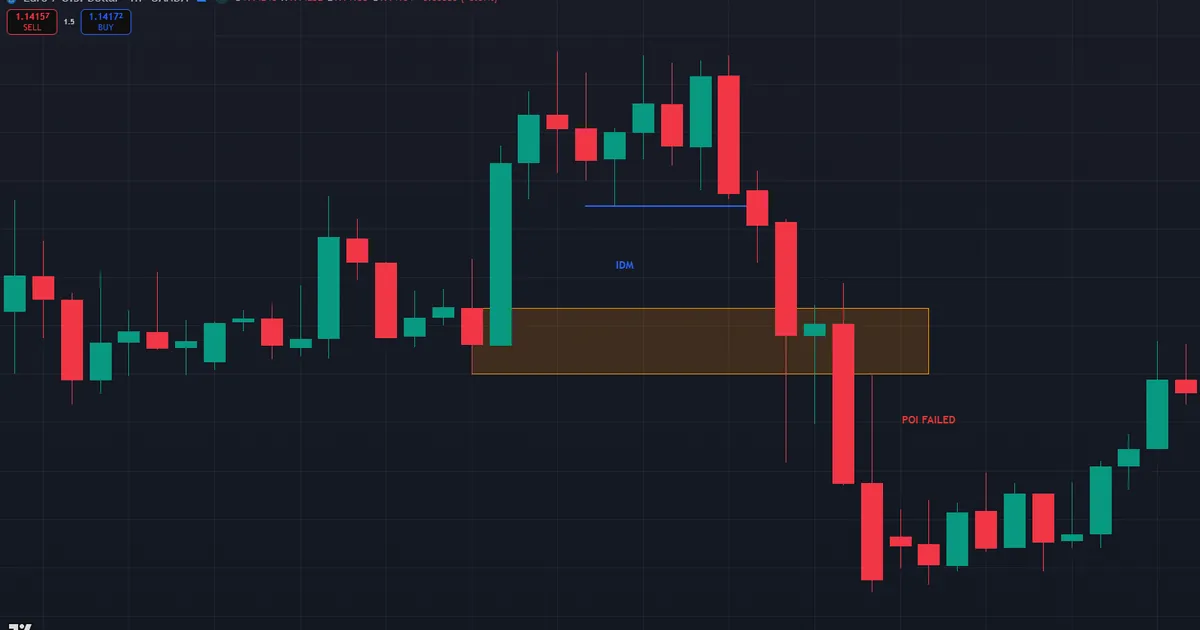
The most common failure looks perfect until the last step. Price sweeps the IDM exactly as expected, reaches the POI, and then slices through the zone without pausing. The read was right about the bait and wrong about the destination, which is why entries need a reaction at the zone, not just an arrival.
The chart below shows that failure: the IDM low gets swept, the demand zone fills, and price closes straight through it with no bounce worth the name.
Invalidation and the Log
The invalidation rule keeps the damage small. A close-and-hold beyond the far edge of the POI kills the setup; exit or stand aside rather than average in, because a POI that fails once rarely recovers on the same visit. Then log the event: instrument, the BOS, the IDM, and how the zone broke. After twenty logged sequences, count which contexts failed most. Perhaps your broken zones cluster on news days, or against fresh weekly trends. Cut the weakest context and the survivors improve with no new theory.
A second failure flavor is the no-show. Price sweeps the IDM, dips a few pips toward the zone, and reverses before ever tagging it. Chasing that move is tempting and usually expensive. Let it go; a sequence that skips its own destination did not complete, and incomplete sequences belong on the watchlist, not in the account.
Honest Limitations
Inducement is the most subjective label in SMC. Any pullback contains minor swings, and calling one of them “the IDM” involves judgment two competent traders can dispute. Also, backtests flatter the concept, because the swept swing is easy to pick after the outcome prints. Judge every read at the hard right edge, and refuse invented precision: no public data set counts how often IDM sequences complete, so any exact figure is marketing. Truly, IDM adds nothing when no clear POI exists beneath the bait, and it cannot rescue a trade taken against higher timeframe bias.
Related Concepts to Study Next
Two structural neighbors round out the skill. First, our guide to BOS vs CHoCH sharpens the structure reads this whole sequence depends on, because a mislabeled break produces a mislabeled IDM. Second, the optimal trade entry article deepens the retracement-depth filter that separates shallow bait from deep zones. Then revisit the EURUSD hero chart and re-run the sequence yourself, level by level, until the route from 1.14258 to the zone and back to 1.14824 feels inevitable in hindsight and merely probable in real time. Between them, the two linked guides cover the judgment calls this setup lives or dies on: which break is real, and which depth deserves trust.
FAQ
What does IDM mean in SMC trading?
IDM is shorthand for inducement: the minor liquidity, usually a small pullback swing, that rests between current price and a deeper point of interest. SMC traders expect price to sweep the IDM before the POI produces a reaction. Plainly, it is bait marked in advance.
Is inducement the same as a liquidity sweep?
Not quite. Inducement is the level where early entries and their stops accumulate, while the sweep is the event that runs those orders. Every inducement invites a sweep. Yet sweeps also occur at session highs, equal lows, and other pools unrelated to IDM.
Does inducement form after every BOS?
No. Fast, one-directional trends often pull back shallowly and resume without printing a clean minor swing. So when no obvious IDM exists, many SMC traders simply skip the setup rather than force a label onto noise.
What is an inducement zone?
It is the small area around the IDM swing where early entries and their stops concentrate, typically a few pips wide. Traders mark it as a zone rather than a line because sweeps overshoot single prices. So mark zones, not lines. Width scales with the timeframe: an H4 inducement zone spans more pips than an M15 one.
How deep should price pull back before the real POI?
There is no fixed number, yet strong POIs commonly sit in the deeper half of the pullback, often inside the 62-79% OTE band. Inducement swings tend to form in the shallow third. So depth is a fast first filter: a “zone” parked far above equilibrium deserves suspicion.
How do I avoid being induced?
Delay the entry. Skip the first obvious pullback level, mark the deeper POI, and require the minor swing to be swept before committing. Also, journal each sequence you trade, because a written record sharpens the eye faster than memory does. Results are not guaranteed; past performance is not indicative of future results.
External references
- For background on this concept, see Bull Trap at Investopedia.
- For broader market context, see Bull Trap at BabyPips.

About the author
Written by Dominic Walsh, a Forex trader and MT4/MT5 indicator, Expert Advisor and script developer. Every tool on forexmt4systems.com is tested on live charts before release and ships with ready-to-use compiled MT4 (.ex4) and MT5 (.ex5) files. Learn more about the trader and developer behind this site.
How we build, test and correct every tool: Editorial & Testing Policy. Trading carries risk; see the disclaimer.