
The optimal trade entry (OTE) is the retracement window between 62% and 79% of an impulse swing, with a sweet spot at 70.5%. Michael Huddleston, the Inner Circle Trader (ICT), popularized it as the pullback zone where the stop stays tight while the target sits far away. So by the end of this guide, you will know how to anchor the Fibonacci tool, mark the zone, and time entries inside it.
First, we define the levels and the logic behind them. Then we walk through two worked examples with exact prices, one long and one short. Also covered: confluence with fair value gaps and order blocks, the mistakes that drain the setup, and the conditions that break it.
What Is the Optimal Trade Entry?
Plainly, the OTE meaning comes down to this: the deep part of a pullback where a trend still has room to resume. Price makes an impulsive move and then retraces. Instead of chasing the breakout, you let price return to the deep portion of that impulse. Your stop then hides just beyond the swing origin. Hence the appeal: small defined risk against a full continuation leg.
Three numbers define the zone. First, 62% (0.618 on most platforms) marks the shallow edge. Second, 70.5% sits midway, and ICT calls it the sweet spot. Third, 79% (0.786) guards the deep edge; beyond it, the pullback threatens the swing origin itself. Thus the shorthand traders repeat: enter inside 62 to 79, lean on 70.5.
Reading the Zone on a Real Chart
The chart below shows the setup on the EURUSD 1-hour chart: one bullish impulse from 1.14060 up to 1.14824, with the OTE zone drawn across its retracement.
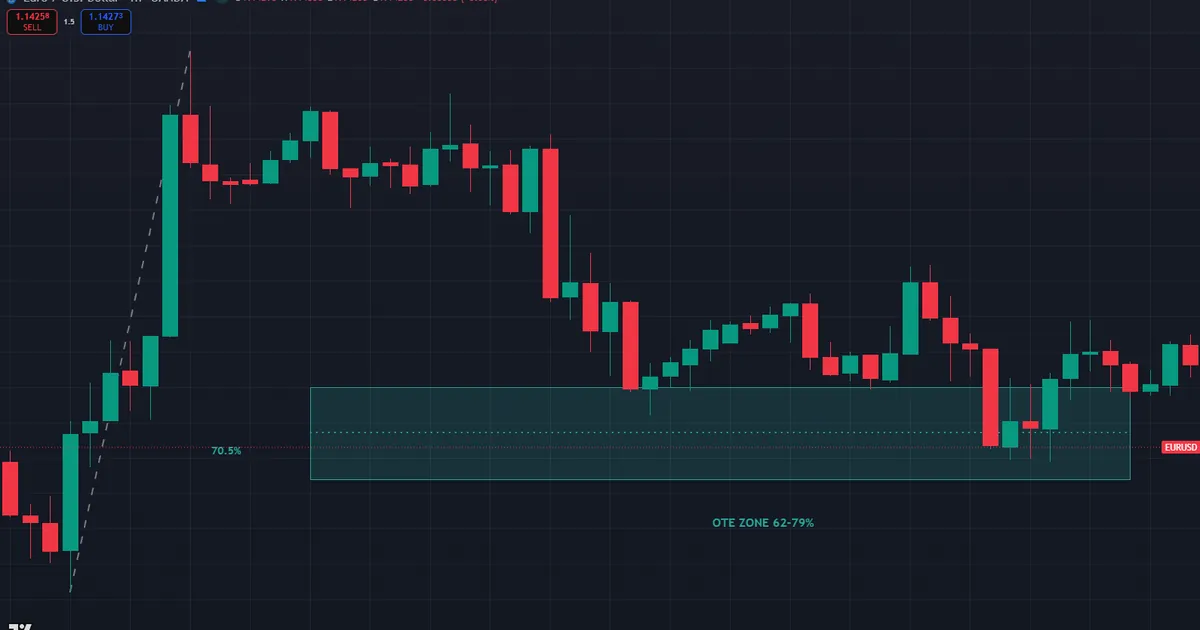
Walk the levels on that chart. The impulse spans 76 pips, so the 62% retracement lands at 1.14350, the 70.5% sweet spot prints as the dotted line at 1.14285, and the 79% level holds 1.14220. Price then pulled back over several hours, tapped 1.14244 deep inside the zone, and bounced. Note the geometry worth copying: the dip ran a few pips past the sweet spot, yet it turned a couple of pips above the 79% line — inside the window, short of invalidation. Every number came from the swing itself, not from opinion.
ICT OTE Fibonacci Levels and Settings
Most platforms preload 0.618 and 0.786 in the Fibonacci retracement tool. So you only add one custom level: 0.705. For a bullish setup, drag the tool from the swing low to the swing high of the impulse leg. Then read each retracement line as a measure of how far price has pulled back from that high. Meanwhile, a bearish setup reverses the anchors, and the zone prints above price.
The ICT OTE Fibonacci levels also include targets. Indeed, ICT projects extensions at -0.5, -1.0, and -2.0 of the anchored swing — the first objective, the symmetrical swing, and the extended run. Rather than compute these by hand, run any swing high and low through our free Fibonacci calculator. It returns the 62%, 70.5%, and 79% prices plus the matching extension targets.
Anchor selection causes most errors with this tool. First, use the full impulse leg — wick to wick — not an inner swing. Second, re-anchor whenever a new displacement extends the leg, because the old zone dies with the old swing. Third, never stretch the tool across a choppy range; the OTE assumes one impulsive origin.

Why the 62 to 79 Retracement Works
The zone is not magic geometry. Truly, its edge comes from three mechanical facts about pullbacks. Each one rewards patience over chasing.
First, depth buys stop quality. A fill at 70.5% sits close to the swing origin, so the stop costs a fraction of what a breakout chaser pays. Second, the 62 to 79 retracement usually overlaps the discount half of the dealing range, which means longs get filled below fair value rather than above it. Third, deep pullbacks shake out weak hands. Late buyers who chased the impulse bail near the lows of the dip, and their exits supply liquidity to traders entering the OTE window. Hence the zone tends to attract patient limit orders rather than panicked market orders.
Whose orders sit behind the bounce? Under the lows of the dip rest the stops of early longs, and their forced exits hand fills to patient limit buyers. Meanwhile, breakout chasers who bought the top of the impulse surrender near the bottom of the pullback, adding supply that larger buyers absorb. Thus the crowd pays the worst price twice — first chasing, then capitulating — while the OTE buyer waits for both flows to finish.
A word on statistics, because the internet overpromises here. No fixed success percentage attaches to the 62-79 window, and anyone quoting one across all pairs and sessions is guessing. What a journal can show you is conditional quality: how your zones behave with a sweep behind them versus without, in kill zones versus overnight, with confluence versus bare. Track those splits for a few dozen trades and the numbers you get will be yours, which makes them worth something.
Where the OTE Sits in the SMC Workflow
The zone never stands alone; it works as step three of a four-step sequence. First comes higher-timeframe context: the daily and 4-hour charts name the draw on liquidity and the direction worth trading. Next comes the point of interest — the OTE zone itself, ideally overlapping another array. Then a lower-timeframe confirmation validates the touch. Finally the entry goes to work with a stop behind the swing origin.
Timeframe Pairing That Keeps Zones Clean
Pair one framing chart with one trigger chart, and keep the roles separate. A common split anchors the impulse on the 1-hour or 4-hour chart, then drops to the 5- or 15-minute chart for the trigger — a small structure shift or a sharp rejection wick at the level. Zones drawn on 1-minute swings die within the hour, so resist that temptation. Equally, never demand a 4-hour confirmation for a 1-hour zone; the trigger belongs one to three steps below the framing chart.
Session Timing in New York Time
Timing filters the taps. Zone touches during the London kill zone (2:00-5:00 New York time) and the New York kill zone (7:00-10:00 New York time) meet real order flow, so rejections there carry conviction. By contrast, a tap during the late New York afternoon or the Asian lull often drifts sideways instead of bouncing. Many traders therefore let an overnight touch pass and wait for the next session to prove interest.
A Session-Timed Sequence in Practice
Put the pieces together across one trading day. The daily chart shows price drawing toward an old high, so the bias is long. During the London kill zone, a displacement leg breaks a 1-hour swing and sets the anchors. Through the late morning, price drifts back toward the zone while you mark the three levels and check for overlapping arrays. Then the New York session opens, the tap arrives, and a 5-minute shift confirms the turn. Each timeframe did one job, and no single chart carried the whole decision.
How to Find the Optimal Trade Entry Step by Step
Here is how to find the optimal trade entry in seven steps. Also, keep the order strict — skipping the bias step is the most common mistake.
- Set the higher-timeframe bias. Then decide which liquidity pool price is drawing toward on the daily and 4-hour charts.
- Wait for displacement: an impulsive leg that breaks a swing point with conviction. Weak, overlapping legs do not qualify.
- Anchor the Fibonacci across that leg, from the swing low to the swing high for longs (reverse for shorts).
- Mark the zone between the 62% and 79% retracement levels. Also note the 70.5% line inside it.
- Let price trade into the zone, ideally during the London kill zone (2:00-5:00 New York time) or the New York kill zone (7:00-10:00 New York time).
- Confirm with a rejection signal: a lower-timeframe market structure shift or a decisive close back in the trend direction.
- Place the stop just beyond the swing origin. Then target the -0.5 and -1.0 extensions.
Worked Example 1: The EURUSD Long in Detail
Return to the hero chart. The 1-hour impulse ran from 1.14060 to 1.14824, and the retracement entered the zone in the pullback that followed. A resting limit at the 70.5% line, 1.14285, filled as price dipped to 1.14244 and turned.
Now the numbers. The stop goes at 1.14030, three pips below the swing origin, for 25.5 pips of risk. Target one, the -0.5 extension, waits at 1.15206 — 92 pips from entry, roughly 3.5R before costs. Target two, the -1.0 extension, projects to 1.15588 for any runner. So one clean impulse produced the entry, the stop, and both targets without a single subjective line.
Note what kept the trade honest. Indeed, the tap held above the 79% level at 1.14220, so the zone never came close to invalidation. Plan the exit ladder in advance: first partial at -0.5, stop to entry afterward, remainder working toward -1.0.
Worked Example 2: A GBPUSD OTE Short
Shorts mirror every rule, so here is the bearish version with fresh numbers. Say GBPUSD breaks support and displaces from 1.27400 down to 1.26600 on the 1-hour chart — an 80-pip impulse. Anchor the Fibonacci from the swing high to the swing low. The zone now sits above price: 62% at 1.27096, the 70.5% sweet spot at 1.27164, and 79% at 1.27232.

Price grinds back up into the zone during the New York morning. Then a 15-minute structure break turns it down at the sweet spot, and the sell fills at 1.27164. The stop goes at 1.27430, three pips above the swing high, for about 27 pips of risk. Target one, the -0.5 extension, waits at 1.26200 — 96 pips, again roughly 3.5R. Meanwhile, the -1.0 extension at 1.25800 serves the runner if momentum holds.
Manage the short the same way as the long. First partial comes off at the -0.5 extension, the stop moves to entry, and the remainder works toward -1.0. If price stalls for several hours above the 62% line without progress, many traders scratch the trade early; a valid rejection should leave the zone within a handful of candles.
Compare the two examples and the symmetry stands out. Same anchors, same levels, same stop logic — only the direction flipped. Drill both directions until the mirror feels automatic.
Download the complete indicator database
Put these concepts on your charts. One email unlocks the full library of 1,380+ indicators with compiled MT4 and MT5 files, plus my TradingView scripts. No paywall, no spam, unsubscribe any time.
Get free access to my indicator database
One email unlocks 1,380+ free MT4, MT5 and TradingView indicators — the complete library. No single-tool download; you get the whole database.
Stacking Confluence: FVG, Order Blocks, and Discount
An OTE zone on its own is only a measurement. Still, the setups worth taking stack independent reasons at the same price. Three confluences matter most.
First, fair value gaps (FVGs) — unfilled imbalances left behind by the impulse. When an FVG overlaps the 70.5% line, the entry gains a mechanical fill level; the full guide to fair value gap trading explains how to grade them. Second, order blocks. The last opposing candle before displacement often sits inside the OTE window, and the full guide to order block trading shows how to refine the entry to its open price. Third, the dealing range itself. For longs, the whole zone should rest below the 50% equilibrium — in premium and discount terms, you buy discount only.
Confluence also grades the sweet spot itself. Truly clean setups show the 70.5% line, an FVG, and an order block open within a few pips of one another. Sparse zones with no such overlap deserve smaller size or a pass.
Grading Zones Before You Trade Them
Turn that observation into a simple tier system. An A-grade zone stacks three things: a sweep before the impulse, an FVG or order block overlapping the sweet spot, and a tap inside a kill zone. A B-grade zone shows two of the three, and a C-grade zone shows one or none. Size follows the grade — full planned risk on A setups, reduced on B, and a pass on C. The discipline matters more than the labels; grading forces you to articulate why this zone deserves money before the fill, not after.
Marking all of this by hand gets tedious across pairs. So many traders let ICT indicators for MT4 and MT5 draw the gaps, blocks, and dealing ranges automatically, then reserve judgment for the trade decision itself.
Common Mistakes with the Optimal Trade Entry
Most OTE losses trace back to a handful of repeat errors. Check your journal against these six.
- Anchoring an inner swing. The tool must span the full impulse leg, wick to wick. Correction: zoom out and anchor the origin of the displacement, not a minor pause.
- Trading without a bias. A zone that fights the higher-timeframe draw is a countertrend gamble. Correction: name the draw first; skip the zone when the daily chart disagrees.
- Forcing zones inside ranges. Choppy legs produce arguable anchors and dead zones. Correction: demand one impulsive origin before drawing anything.
- Treating 70.5% as automatic. A resting limit with no confirmation invites reversals straight through it. Correction: require a rejection signal, or cut size when resting orders blind.
- Ignoring re-anchors. When displacement extends the leg, the old zone expires. Correction: redraw from the same origin to the new extreme.
- Oversizing the tight stop. A close stop tempts traders into positions too large for the account. Correction: fix account risk first, then let stop distance set the size.
Read the six as one theme: the zone only works downstream of good context. Anchors, bias, and market state decide whether the fib lines mean anything; the entry tactic itself is the easy part. Review the list weekly against your journal, and fix the earliest broken step first — errors at the anchor stage poison everything after them.

Pre-Trade OTE Checklist
Run this list before the order goes in. Seven yes answers earn the trade; one no means pass.
- Higher-timeframe bias named, with a draw on liquidity ahead.
- Displacement leg identified, wick-to-wick anchors set.
- Zone marked at 62%, 70.5%, and 79%, prices written down.
- At least one extra confluence overlaps the zone.
- Tap arriving inside a London or New York kill zone.
- Confirmation trigger defined on the 5- or 15-minute chart.
- Stop set beyond the origin, size computed from it.
Where the Optimal Trade Entry Fails
Strong trends often pull back only 33-50% before running again. So a trader who insists on 62-79% misses the cleanest moves entirely. Accept the trade-off; the OTE swaps frequency for stop quality.
Deep retracements cut the other way. Sometimes price knifes through 79%, takes the swing origin, and flips the bias — what looked like a pullback was a reversal. Also, ranges are hostile territory: without a clear impulse, every anchor choice is arguable and the zone means little. News releases add a further hazard, since one print can traverse the entire zone and the stop behind it. Hence the standing rule: no higher-timeframe bias, no OTE trade.
Treat the sweet spot as a reference, not a promise. Indeed, plenty of valid continuations reject at 62% and never touch 70.5%, while others need the full 79% before turning. So test the zone on your own pair and session in a journal before trading it live.
A Failure Walkthrough, Level by Level
Here is how a break looks in numbers. Suppose a EURUSD impulse runs from 1.15210 to 1.15890, and the pullback enters the zone at 1.15468. Price stalls near the sweet spot at 1.15411, ticks lower, and then a news candle closes at 1.15290 — a full 1-hour close beyond the 79% level at 1.15353. The next bar removes the swing origin at 1.15210. What looked like a pullback was a reversal, and the zone is dead.
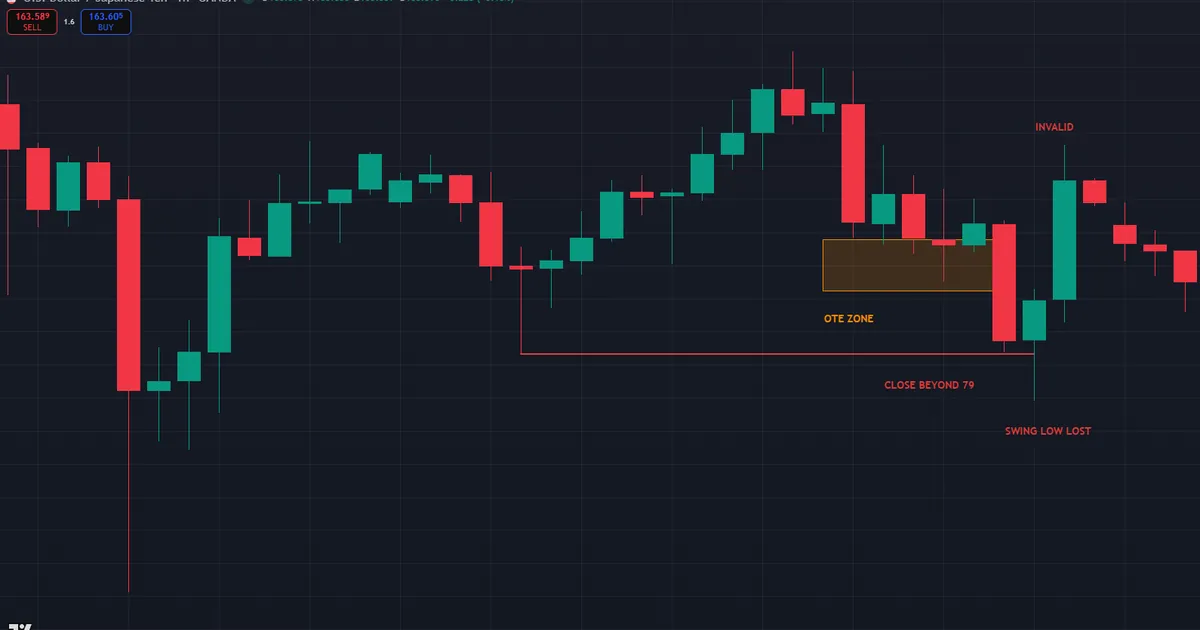
The invalidation rule caps the damage. Exit, or cancel the resting order, on any full candle close beyond 79%; never average down inside a failing zone. Afterward, log three facts: the session of the tap, the depth price reached, and which confluence was missing. Over time those notes reveal which failures were avoidable and which were simply cost of doing business. Failed zones teach anchor selection faster than winners do.
Related Concepts
Two neighboring ideas sharpen the OTE further. First, inducement in trading explains the shallow fake-out that often lures early buyers in before the true dip into the zone. Second, ICT daily bias covers the higher-timeframe read that decides whether a zone deserves an order at all. Pair them with the displacement and premium-discount ideas above, and the entry model becomes a complete process. Study one concept per week, apply it to your existing OTE journal, and the review compounds: each idea explains a batch of past trades that previously looked random.
FAQ
What does OTE mean in trading?
OTE stands for optimal trade entry, an ICT concept. Plainly, it is the 62-79% Fibonacci retracement of an impulse swing, where a pullback entry keeps the stop close to the swing origin. The 70.5% level marks the preferred spot inside that window.
Which Fibonacci levels do I need for the ICT OTE?
Use 0.62, 0.705, and 0.79 for the entry zone. Most platforms already include 0.618 and 0.786, so you only add the 0.705 line. Meanwhile, extensions at -0.5, -1.0, and -2.0 serve as targets.
Is the 70.5% level required for an entry?
No. Any well-confirmed rejection inside the 62 to 79 window qualifies. Still, many traders rest limit orders at 70.5% when other confluence overlaps it, since that midpoint defines the sweet spot.
Does the optimal trade entry work on all timeframes?
The geometry applies from monthly charts down to one-minute charts. Yet lower timeframes carry more noise, so most traders frame the swing on the 1-hour or 4-hour chart and time the trigger on 5- or 15-minute charts.
Do I need a liquidity sweep before an OTE setup?
A sweep is not mandatory, yet impulses that begin by running an old low or high tend to produce cleaner zones. The sweep clears resting orders, so the pullback that follows meets less opposition. Many traders grade sweep-born zones a tier higher and size the rest smaller.
Does price always respect the OTE zone?
No. Shallow pullbacks can reverse before 62%, and full reversals can trade straight through 79%. So treat the zone as a framework for planning risk, not a prediction. Results are not guaranteed; past performance is not indicative of future results.
External references
- For background on this concept, see Fibonacci Retracement at BabyPips.
- For broader market context, see Golden ratio on Wikipedia.

About the author
Written by Dominic Walsh, a Forex trader and MT4/MT5 indicator, Expert Advisor and script developer. Every tool on forexmt4systems.com is tested on live charts before release and ships with ready-to-use compiled MT4 (.ex4) and MT5 (.ex5) files. Learn more about the trader and developer behind this site.
How we build, test and correct every tool: Editorial & Testing Policy. Trading carries risk; see the disclaimer.