
The leading vs lagging indicators debate shapes how every trader reads a chart, because the two families answer opposite questions. A leading tool tries to predict a turn before it happens, while a lagging tool waits and confirms a move already underway. Choose the wrong family for the moment, and even a good signal steers you into a poor trade.
This guide settles the leading vs lagging indicators question with plain rules. So by the end, you will know how each family is built, which tools fall where, and how to pair a predictive oscillator with a confirming trend tool on a live EURUSD chart.
Leading vs Lagging Indicators: The Core Split
Leading indicators aim ahead of price. They read momentum, so they often flag a stretched move before it turns. The RSI, the Stochastic, and Williams %R all belong here, since each one reacts fast to recent price change.
Lagging indicators trail price on purpose. They smooth data to filter noise, so they confirm a trend only after it forms. Moving averages and the MACD sit here, because both lean on averages that need past bars before they settle.
Look at a concrete frame first. The chart shows EURUSD on the one-hour timeframe with a 14-period RSI in the lower pane and a 50-period EMA on price. Near 1.140, the RSI turns up while price still dips, and only later does price reclaim the lagging EMA. That single picture shows one tool leading and one confirming. Because the two react at different speeds, they rarely fire at the same instant, and that gap is exactly the information you want.

Prediction Versus Confirmation
The split comes down to timing and trust. A leading tool offers an early read, yet it fires more false signals because prediction is hard. A lagging tool offers a late read, yet it earns more trust because it waits for proof.
Neither trait is better in the abstract. Early signals help you enter near the start of a move, while confirmed signals keep you out of false starts. So the real skill lies in knowing which trait a moment calls for, then reaching for the matching family.
Why the Distinction Matters
The label changes how you read a signal. When a leading tool fires, you treat it as a question that still needs an answer. When a lagging tool fires, you treat it as an answer that already arrived, though a little late.
Traders who blur the two make predictable errors. They chase early oscillator signals as if confirmed, then wonder why so many fail. Because they never asked which family a tool belongs to, they trust every line the same way. So the simple act of sorting your tools sharpens every decision that follows.
How Each Family Is Built
The math explains the behaviour, so learn it once. A few ideas separate the two families, and every trait flows from them.
- Oscillator range. A leading oscillator such as the RSI maps recent momentum onto a bounded scale. Because it reacts to the latest bars, it shifts quickly and hints at turns early.
- Extreme zones. Leading tools mark stretched conditions at fixed levels, such as 70 and 30 on the RSI. Those zones warn of a possible turn before price confirms one.
- Moving average smoothing. A lagging tool averages many past closes into one line. Because it blends history, it reacts slowly and filters out short-lived noise.
- The MACD blend. The MACD subtracts one average from another, so it still lags yet reads trend strength. It confirms shifts a beat after they begin.
- The trade-off. Speed costs accuracy, and accuracy costs speed. So a leading tool trades false signals for early entries, while a lagging tool trades late entries for cleaner ones.
So the two families sit at opposite ends of a single trade-off. The diagram below lines their builds up side by side.

Where Common Tools Fall
Sorting your toolbox by family clears up a lot of confusion. Most traders own tools from both camps without realising which is which. So a quick sort tells you what each line on your chart actually does. Once the labels are clear, you stop asking one tool to do the other’s job, which removes a whole class of avoidable mistakes.
The table below places the tools most forex traders use into their proper family. Read it as a map, not a ranking, since each tool earns its place in the right context. Keep in mind that a few tools blur the line, yet the build usually settles the question.
| Tool | Family | What it does |
|---|---|---|
| RSI | Leading | Flags stretched momentum early on a bounded scale |
| Stochastic | Leading | Reads momentum against a recent range, hints at turns |
| Williams %R | Leading | Marks overbought and oversold on an inverted scale |
| Moving average | Lagging | Smooths price to confirm the direction of the trend |
| MACD | Lagging | Confirms trend shifts through a cross of two averages |
| Bollinger Bands | Lagging | Wrap a moving average, so the centre line trails price |
Notice the pattern in that map. Oscillators cluster in the leading column, while anything built on a moving average sits in the lagging one. So the build of a tool, not its popularity, decides its family. When you meet a new indicator, look at its formula first, and its family usually reveals itself at once.
Fitting Both Families Into a Workflow
The families work best as a team, not as rivals. So a smart routine gives each one a defined job rather than forcing a choice between them.
Let the lagging tool set your bias first. A 50 or 200 EMA tells you which way the trend leans, so you trade with it rather than against it. Then let the leading tool time the entry within that bias, catching the pullback low or the momentum shift.
The Bias-Then-Timing Sequence
Sequence keeps the two families from clashing. Because the lagging tool frames the trend, the leading tool only needs to find a good moment inside it. So you never fade a strong trend on a lone oscillator signal.
Follow the same order every time. Read the trend on the higher timeframe with a lagging tool, drop to your trading timeframe, then wait for the leading tool to fire in the trend’s direction. Because the order never changes, your reads stay consistent under pressure.
Matching Family to Market State
Market state tips the balance between the families. In a strong trend, lean on the lagging tool, since oscillators pin at extremes and mislead. In a range, lean on the leading tool, since its extreme zones mark real turning points between the walls.
So read the state before you pick a lead tool. A quick glance at whether price trends or chops tells you which family to trust more right now. Because the same chart can shift state, that check pays off on every fresh setup.
Testing Which Family Fits Your Style
Style matters as much as market state. A patient swing trader may lean on lagging tools, since later entries suit a slower pace. A quick intraday trader may lean on leading tools, since early reads suit a fast one.
Test the balance on your own history. Scroll back through a year of charts and mark which family gave you the cleaner reads at your usual timeframe. Because the answer depends on how you actually trade, no textbook can decide it for you. So let your journal, not a rule of thumb, set the mix you rely on.
Worked Example: Pairing the Two on EURUSD
Picture EURUSD trending up on the four-hour chart, with a rising 50-period EMA marking the bias. Price pulls back toward that EMA near 1.138, and the RSI cools from a hot reading down toward 42.
Watch the two families combine. The leading RSI curls up off 42 first, hinting the dip is ending. Then the lagging EMA holds as price reclaims it, confirming the trend still runs. The chart below marks that lead-then-confirm pair.

Now the trade builds itself. A trader buys as a bullish candle closes near 1.140, with a stop below the pullback low around 1.134. That places roughly 60 pips of risk on the position. Because the leading tool warned early and the lagging tool confirmed, the entry stayed both timely and filtered.
The follow-through rewarded the read. Price pushed toward 1.152, the EMA kept rising, and the RSI climbed without pinning. So the lagging tool held the direction while the leading tool timed the start, each doing the job it does best.
Note where the stop sat. The pullback low near 1.134 rested under both the EMA and a prior swing, so it made a clean line in the sand. Because the invalidation sat below real structure, a normal wobble would not shake the trade out early.
Sizing the Trade From the Stop
Risk comes first, not last. With a 60-pip stop fixed, position size follows from the account risk you accept per trade. Our free position size calculator turns that stop and risk into an exact lot in seconds, so no trade drifts oversized.
Then keep the risk steady across trades. A fixed fraction of the account on each idea smooths the equity curve, so one loser never dents the balance hard. Because the size scaled to the stop, the plan held firm from setup to setup.
Reading the Exit With Both Families
A clean entry is only half the job, since the exit decides the result. So let both families guide the hold. In this EURUSD case, the rising EMA argues for staying in the move while the RSI climbs without pinning.
Watch for the two families to disagree. When the RSI pokes above 70 while the EMA still rises, the lagging tool wins the tie, so you hold and trail the stop. Only when price loses the EMA does the exit case turn firm. Because the lagging tool anchors the trend, it settles the disputes the leading tool starts.
Download the complete indicator database
Put these concepts on your charts. One email unlocks the full library of 1,380+ indicators with compiled MT4 and MT5 files, plus my TradingView scripts. No paywall, no spam, unsubscribe any time.
Get free access to my indicator database
One email unlocks 1,380+ free MT4, MT5 and TradingView indicators — the complete library. No single-tool download; you get the whole database.
Common Mistakes and How to Fix Them
The two families look simple, yet the same errors repeat on every timeframe. Most trace back to trusting one family for a job the other should do, and the fixes follow beneath the graphic.

Trusting Leading Signals Blindly
An early oscillator signal feels powerful, yet it fails often. A leading tool predicts, so it guesses wrong more than a confirming tool does. Instead, treat each early signal as a heads-up, then wait for a lagging tool or price to confirm before you commit.
Fading a Trend on an Oscillator
An overbought RSI in a strong uptrend does not mean sell. Leading tools pin at extremes when a trend runs hard. So use the reading as a caution only, and let the lagging trend tool decide whether the move still has force.
Chasing Lagging Signals Late
A lagging tool confirms after the fact, so acting on it blindly means entering late. Buying only when a slow average finally turns can hand back much of the move. Instead, pair the lagging confirmation with a leading tool that gets you in sooner within the trend.
Mixing Only One Family
Loading three oscillators or three moving averages defeats the point. Because tools within a family echo each other, they add no fresh view. Instead, pick one leading tool and one lagging tool, so prediction and confirmation both appear on the chart.
Ignoring the Higher Timeframe
A leading signal on the five-minute means little against a falling daily trend. Truly, the higher timeframe frames every lower read. So check the daily direction with a lagging tool first, then time entries with the leading one.
Expecting Precision From Either Family
Both families give a read, not a promise. A trader who waits for an exact top or bottom will wait forever, since neither camp pinpoints turns. Instead, accept a range around each signal and let structure fill the gaps. Because the tools estimate rather than measure, a margin of error belongs in every plan built on them.
A Pre-Trade Leading and Lagging Checklist
Run this short list before every entry. A few seconds here saves hours of regret later. So slow down, tick each item, and let a failed check keep you out of a marginal trade.
- Higher-timeframe trend set by a lagging tool such as an EMA.
- Market state named as trend or range, which tips the balance.
- A leading tool timing the entry within that bias.
- One tool from each family, never three of a kind.
- An early signal confirmed by price or a lagging read.
- Stop distance set from structure or a volatility read.
- Entry, stop, and target planned before the trade goes live.
When Leading and Lagging Tools Fail
Study the failure case as hard as the winner. Here is a common one. EURUSD trends up firmly on the one-hour chart. A trader watches the RSI hit overbought, trusts that leading signal alone, and shorts against the trend.
Then the losses stack up. Price keeps climbing, the RSI stays pinned above 70 for hours, and the lagging EMA rises the whole time. The chart below shows that trend, with the pinned oscillator marking the false early signal while price walks up the rising average.
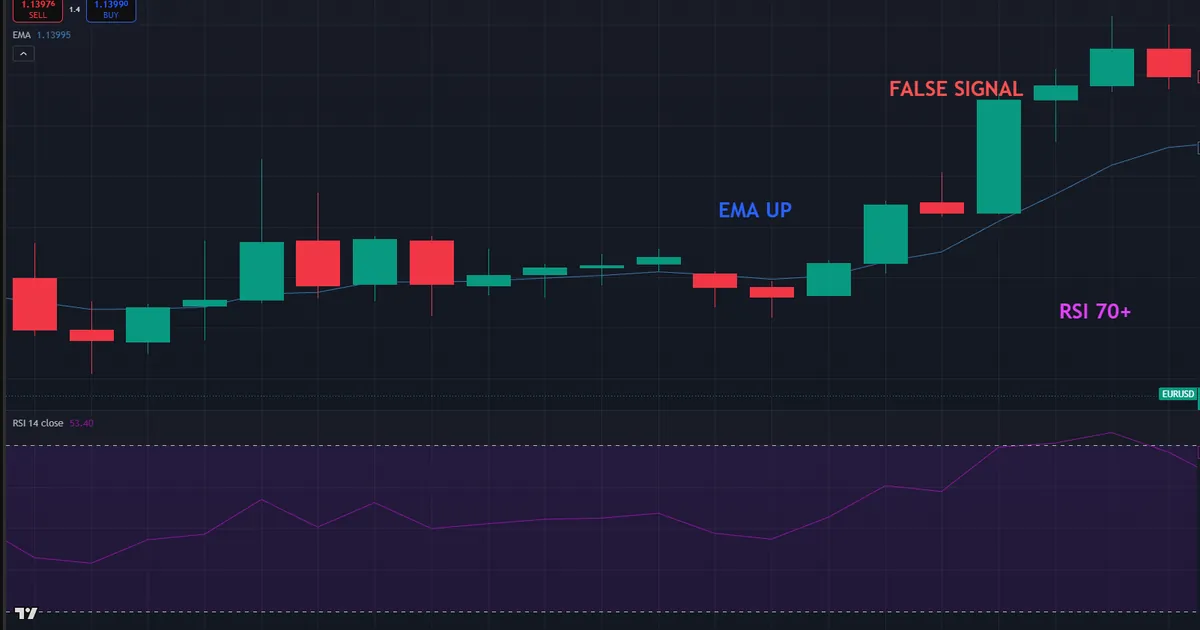
So what went wrong? The trader trusted a leading tool where a lagging one ruled. Because the EMA showed a strong uptrend, the overbought RSI meant strength, not exhaustion. Hence the rule that saves the account: never fade a lagging trend read on a lone leading signal.
Notice how the fix needed no new tool. The rising EMA already sat on the chart, ignored. Had the trader read the lagging tool first, the short would never have fired. So the lesson is about order and respect, not about adding more lines to the screen.
Both Families Share Blind Spots
Be honest about what neither family can do. Both read only past price, so neither sees a rate decision or a jobs report coming. A single news candle can spike a leading tool and drag a lagging one at once, trapping traders on either side.
So check the economic calendar before you lean on any read. Around a major release, step back and let the dust settle. Because both families react to price, they react to news even later, and that gap can prove costly on any timeframe.
Volume adds a partial fix here. Since volume reflects real participation, it can hint at a shock building before price fully reacts. Yet even volume reads the past, so it softens the blind spot without erasing it. So treat every tool as a rear-view mirror, useful for judging the road behind but never the road ahead.
Speed and Accuracy Always Trade Off
Be honest about the core limit too. No setting turns a leading tool accurate or a lagging tool fast. You can shorten an average to speed it up, yet it then whipsaws like an oscillator. So accept the trade-off and pair the families rather than chase a tool that does both.
Many traders spend years hunting a single perfect indicator. Yet the search misunderstands the trade-off at the heart of this topic. Because speed and accuracy pull against each other, no one tool can lead and confirm at once. So the mature move is to stop hunting and start pairing, letting two honest tools do what one cannot.
Related Concepts to Study Next
The topic connects to a web of sibling ideas, and a few deserve your next reading hour. Start with the practical playbook in our guide to how to combine indicators, which turns this split into a routine. Then ground the lagging side with our walk-through of moving averages explained.
Two more guides sharpen the picture. Because the MACD sits firmly in the lagging camp, read our full guide to the MACD for a deeper look at how it confirms. Then compare two leading tools in our RSI vs Stochastic guide to see how oscillators differ among themselves.
For hands-free charting, the oscillator indicators archive gathers the leading tools, while the trend indicators archive holds the lagging ones. Tools speed the work, yet the logic above still carries the trade. So learn the rules first, and let any indicator plot what you already understand.
FAQ
What is the difference between leading and lagging indicators?
A leading indicator tries to predict a turn before it happens, usually through momentum. A lagging indicator confirms a move already underway, usually through moving averages. So leading tools give early signals and lagging tools give trusted ones.
Which type is more reliable?
Lagging tools fire fewer false signals because they wait for proof. Leading tools warn earlier but guess wrong more often. Neither wins outright, so most traders pair them and let each cover the other’s weakness.
Is the RSI a leading or lagging indicator?
The RSI is a leading indicator. It reads recent momentum on a bounded scale, so it often turns before price does. That early read helps, yet it also produces more false signals than a lagging trend tool.
Can I use only lagging indicators?
You can, and many trend traders do. Lagging tools keep you on the right side of a strong move and filter noise. The cost is later entries, so you may hand back part of each move at the start and the finish.
How do I combine a leading and a lagging tool?
Let the lagging tool set your bias and the leading tool time the entry. So a moving average names the trend, then an oscillator finds a good moment within it. That pairing gives you both an early entry and a trend filter.
Do these tools work in every market?
They work best when the market state matches the family, trends for lagging tools and ranges for leading ones. In choppy or newsy conditions, both can fail together. So match the family to the conditions and pair them when you can. Manage risk on every trade. Results are not guaranteed; past performance is not indicative of future results.
External references
- For background on this concept, see Leading Indicators at BabyPips.
- For broader market context, see Economic Indicators at Corporate Finance Institute.

About the author
Written by Dominic Walsh, a Forex trader and MT4/MT5 indicator, Expert Advisor and script developer. Every tool on forexmt4systems.com is tested on live charts before release and ships with ready-to-use compiled MT4 (.ex4) and MT5 (.ex5) files. Learn more about the trader and developer behind this site.
How we build, test and correct every tool: Editorial & Testing Policy. Trading carries risk; see the disclaimer.