
Knowing how to combine indicators separates a clean chart from a cluttered mess of lines that all say the same thing. The goal is confluence, not confirmation bias, so you pair tools that measure different things and let each one cover ground the others miss.
This deep dive shows how to combine indicators without doubling your noise. So by the end, you will know why one leading and one lagging tool beat three of a kind, how volume adds a third view, and where even a smart combination fails on a live chart.
How to Combine Indicators the Right Way
Every indicator is a lens on the same price data. Some lenses read momentum, some read trend, and some read participation through volume. So the trick is to choose lenses that show you different things rather than three copies of one view.
A strong combination answers three questions at once. What direction does the trend lean? How stretched is the current move? And does volume back the story? Because each tool tackles a separate question, their answers reinforce rather than repeat one another.
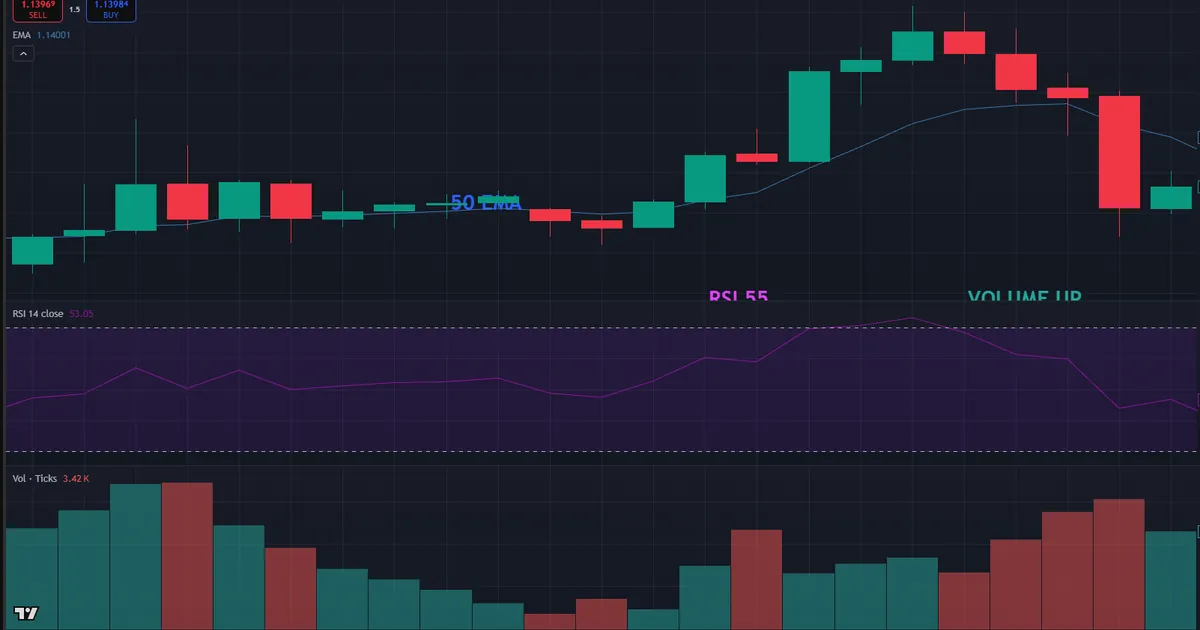
Look at a clean example first. The chart shows EURUSD on the one-hour timeframe with a 50-period EMA on price, a 14-period RSI in a lower pane, and a volume histogram beneath. Price holds above the EMA near 1.142, the RSI sits near 55, and volume rises into the push. That single frame answers all three questions in one glance.
The One-Leading-One-Lagging Rule
The core rule fits in a sentence. Pair one leading tool with one lagging tool, then stop. A leading tool such as an oscillator hints at turns early, while a lagging tool such as a moving average confirms the trend behind them.
Balance is the point of that rule. Because a leading tool warns early and a lagging tool confirms late, together they frame both the risk and the reality of a move. So you gain an early heads-up without abandoning the steadier check that keeps you on the right side of the trend.
Confluence Is Not Confirmation Bias
People confuse confluence with piling up agreement, yet the two differ sharply. True confluence means independent tools point the same way for independent reasons. Confirmation bias means you keep adding tools until one finally agrees with a trade you already wanted.
Guard against that slide with honesty. Define your rule before you look at the chart, then let it accept or reject the trade. Because the rule came first, you cannot bend the tools to suit a bias formed after the fact. So a written rule is the simplest defence against fooling yourself.
Why Redundant Stacking Fails
Many charts drown under three or four tools from the same family. The reasoning sounds fair at first, yet the math betrays it. Here is why the habit hurts more than it helps.
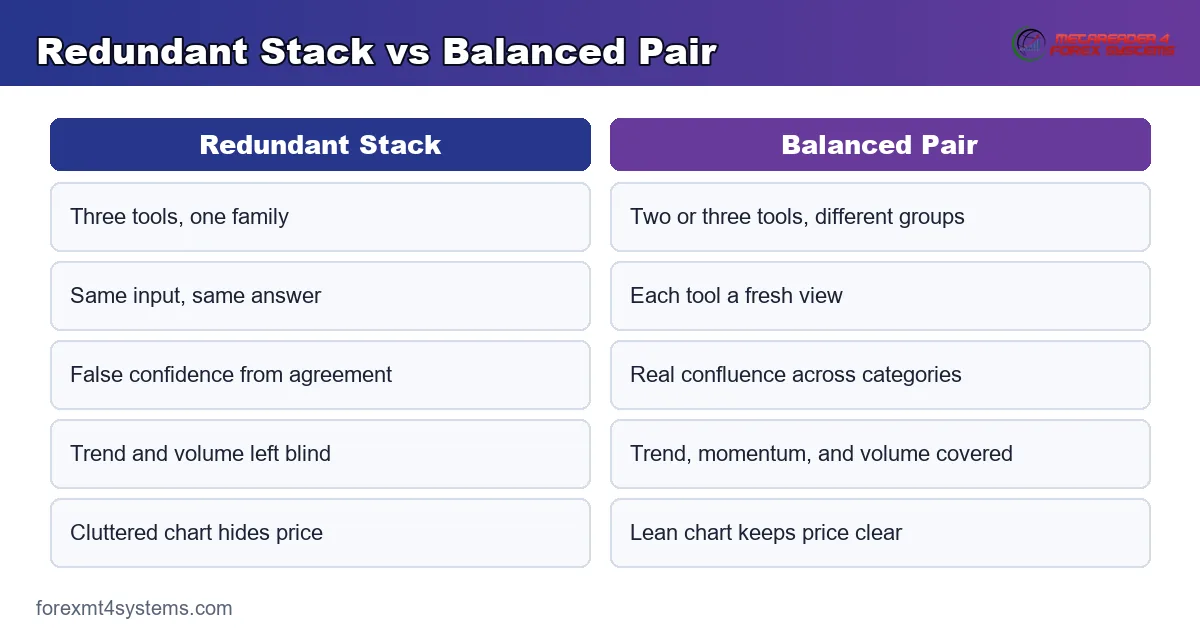
- Same input, same answer. The RSI, the Stochastic, and Williams %R all read momentum from recent price. So they usually agree, which feels reassuring but adds no new information.
- False confidence. Three tools nodding along fools you into oversizing. Because the agreement is baked into their shared math, it proves nothing about the trade.
- Blind spots stay blind. Stacking momentum tools leaves you with no read on trend or volume. So the very risks you needed to see remain hidden behind a wall of oscillators.
- Analysis paralysis. More lines mean more conflicting wiggles to interpret. So decisions slow down while the setup you wanted slips past.
- Cluttered charts. A busy screen hides price itself, which is the only thing that pays you. So clarity falls as the indicator count climbs.
So the fix is not more tools but better-chosen ones. The diagram below contrasts a redundant stack against a balanced pair.
Categories That Play Well Together
Group indicators by what they measure, then pick across groups. Trend tools include moving averages and the MACD. Momentum tools include the RSI, the Stochastic, and Williams %R. Volatility tools include Bollinger Bands and the ATR, while volume tools include On Balance Volume and simple volume bars.
Choose one from a group, then move to a different group. A moving average plus an oscillator covers trend and momentum. Add a volume tool and you cover participation too. Because each pick comes from a fresh category, the set stays lean while its coverage grows wide.
Adding Volume as a Third View
Volume answers a question that price tools cannot. It shows whether real participation backs a move or whether price drifts on thin air. So a breakout on rising volume looks far more trustworthy than one on fading volume. That extra view often matters most exactly when price alone looks convincing.
Keep the volume read simple. On Balance Volume adds volume on up bars and subtracts it on down bars, so its slope confirms or questions the price trend. When price and On Balance Volume climb together, the move has support. When they split, the move looks hollow, so caution pays.
A Simple Three-Slot Template
Think of your chart as three slots to fill, no more. Slot one holds a trend tool, slot two holds a momentum tool, and slot three holds volume or volatility. So the moment a chart tries to sprout a fourth line, you know to stop.
This template keeps every chart consistent. Whatever pair or timeframe you open, the same three slots wait to be filled. Because the structure never changes, your eye learns to read it fast under pressure. So you spend energy on the trade rather than on deciding which tools to load.
Fitting a Combination Into a Workflow
A good set of tools means little without an order of operations. So build a fixed sequence and follow it on every chart the same way.
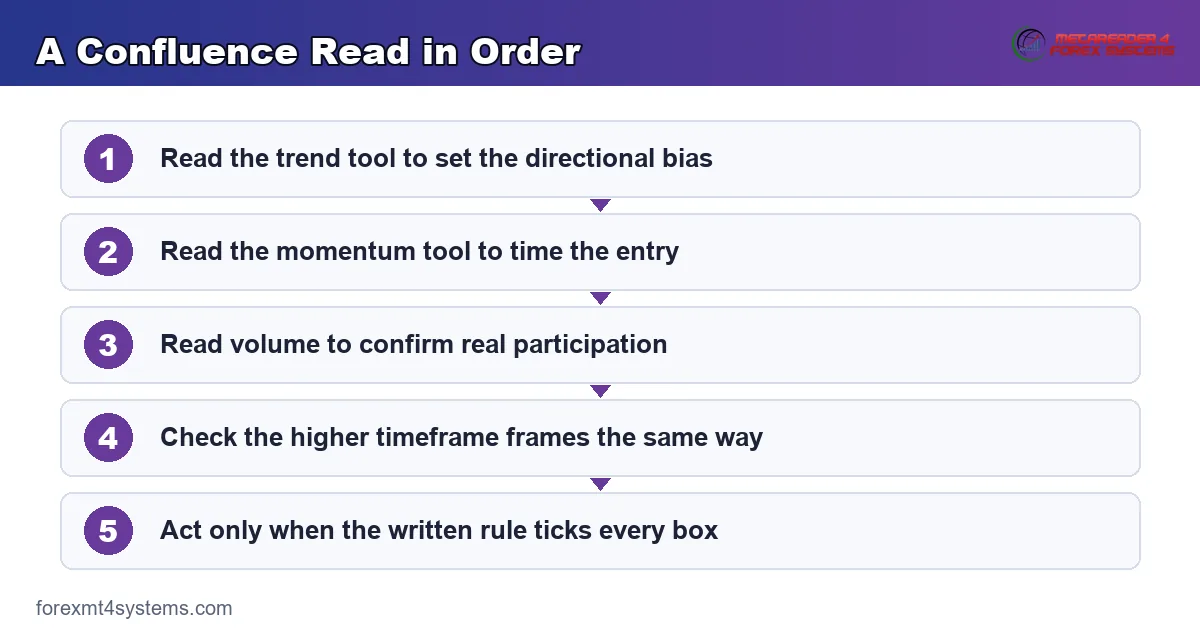
Start with the trend tool to set your bias, then read the momentum tool for timing, and finish with volume for a sanity check. Because the sequence never changes, your reads stay consistent from one session to the next. So habit replaces guesswork under pressure.
Writing a Confluence Rule
Confluence works only once you define it in advance. So write down what agreement looks like before you risk a cent. For a long, you might require price above the 50 EMA, the RSI leaving oversold, and volume rising on the bounce.
Then trade only when every box ticks. Because a shared signal across categories filters out many lone false starts, the setups you take usually read cleaner. So the rule trades a lower count of signals for a higher quality of each one.
Matching Tools to Timeframe
Timeframe shapes which tools shine. On the daily chart, a slow moving average and the MACD frame the big trend well. On the five-minute chart, a faster oscillator and volume catch quick shifts that a slow average would miss.
Keep the categories fixed while you adjust the speed. A trader might run a 200 EMA on the daily and a 20 EMA on the five-minute, yet both fill the same trend slot. So the framework holds steady even as the exact settings flex with the clock.
Testing the Combination on History
A combination earns trust only after you test it on past bars. Scroll back through a year of one-hour EURUSD data and mark every time all three slots agreed on a long. Then note what price did over the next twenty bars, so the numbers speak rather than your hopes.
Keep the journal honest and plain. Record the trend state, the levels, each tool reading, and the outcome for every sample. Because a written record cannot flatter you, it exposes the setups that pay and the ones that leak. Over a few dozen trades, the value of cross-category agreement usually shows on your own charts.
Worked Example: A Confluence Long on EURUSD
Picture EURUSD trending up on the four-hour chart, with price pulling back toward a rising 50-period EMA near 1.138. The RSI has cooled from a stretched reading down toward 45. Volume thinned during the dip, a normal sign of a pause.
Watch the three tools align. Price reclaims the 50 EMA, the RSI curls back above 50, and volume ticks up as buyers return. The chart below marks that trio of signals at the pullback low.
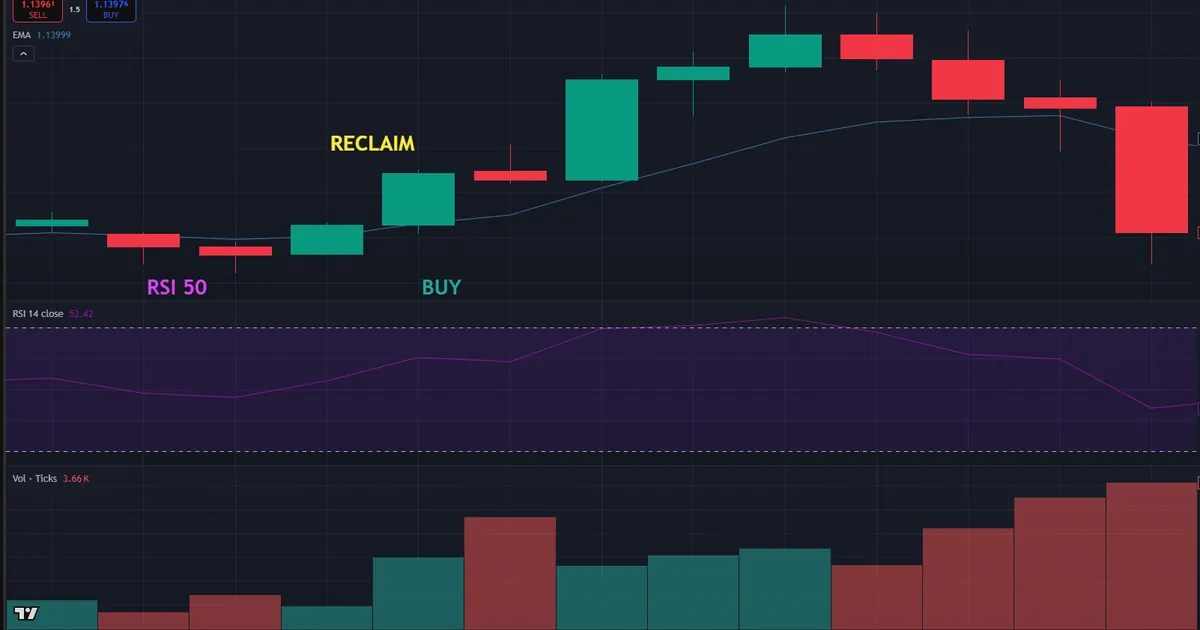
Now the trade builds itself. A trader buys as a bullish candle closes near 1.140, with a stop below the pullback low around 1.134. That places roughly 60 pips of risk on the position. Because all three categories agreed, the entry carried weight that no single tool could supply.
The follow-through rewarded the read. Price pushed toward 1.152, the RSI climbed without pinning, and volume held firm on the advance. So the trend tool set direction, the momentum tool timed the entry, and volume confirmed the push had support.
Note where the stop sat. The pullback low near 1.134 rested under the EMA and a prior swing, so it made a clean line in the sand. Because the invalidation sat below real structure, a normal wobble would not shake the trade out early.
Sizing the Trade From the Stop
Risk comes first, not last. With a 60-pip stop fixed, position size follows from the account risk you accept per trade. Our free position size calculator turns that stop and risk into an exact lot in seconds, so no confluence trade ever drifts oversized.
Then keep the risk steady across trades. A fixed fraction of the account on each idea smooths the equity curve, so one loser never dents the balance hard. Because the size scaled to the stop, the plan held firm from setup to setup.
Reading the Exit With the Same Set
A clean entry is only half the job, since the exit decides the result. So let the same three tools guide the hold. In this EURUSD case, a rising RSI and firm volume both argue for staying in the move while price holds above the EMA.
Watch for the set to turn against you. When price loses the 50 EMA, the RSI rolls over, and volume fades on the advance, the story has changed. Because two or three slots now disagree, you trail the stop or step aside. So the combination that framed the entry also frames a disciplined exit.
Download the complete indicator database
Put these concepts on your charts. One email unlocks the full library of 1,380+ indicators with compiled MT4 and MT5 files, plus my TradingView scripts. No paywall, no spam, unsubscribe any time.
Get free access to my indicator database
One email unlocks 1,380+ free MT4, MT5 and TradingView indicators — the complete library. No single-tool download; you get the whole database.
Common Mistakes and How to Fix Them
Combining tools sounds simple, yet the same errors repeat across every chart. Most trace back to adding tools instead of choosing them, and the fixes follow beneath the graphic.
Stacking the Same Family
Running the RSI, the Stochastic, and Williams %R together only triples one view. Because they share their input, they nod along without adding insight. Instead, keep one momentum tool, then spend the freed space on a trend or volume read.
Ignoring the Trend Tool
Some traders lean only on oscillators and skip a trend read entirely. So they fade strong moves that keep running. Instead, anchor every setup with a moving average or the MACD, then let momentum time the entry within that bias.
Over-Optimising Every Setting
Endless tweaking of periods and levels fits the past, not the future. A setting that looks perfect on old data often fails on new bars. Instead, keep standard settings and change the market you trade, not the numbers, when results disappoint.
Trading Before All Tools Agree
Jumping in on one green light defeats the purpose of a combination. So a lone RSI signal against the trend tool invites a fight with the market. Instead, wait for your written rule to fill every box before you commit real risk.
Forgetting the Higher Timeframe
A perfect combination on the five-minute means little against a falling daily trend. Truly, the higher timeframe frames every lower read. So check the daily direction first, then take confluence signals that lean with that bias.
Letting the Chart Grow Cluttered
Charts creep toward clutter one tool at a time. A trader adds a line to explain a past loss, then never removes it. Soon the screen hides price behind a tangle of colours. Instead, audit your chart monthly and strip any tool that has not earned its slot. Because a clean chart reads faster, fewer lines often lead to better decisions.
A Pre-Trade Confluence Checklist
Run this short list before every entry. A few seconds here saves hours of regret later. So slow down, tick each item, and let a failed check keep you out of a marginal trade.
- Higher-timeframe trend read on the daily and four-hour charts.
- One trend tool naming the direction, such as a moving average.
- One momentum tool timing the entry, such as the RSI.
- One volume or volatility tool confirming participation.
- No two tools drawn from the same family.
- Every box in your written confluence rule ticked.
- Stop, size, and target planned before the trade goes live.
When a Good Combination Fails
Study the failure case as hard as the winner. Here is a common one. A trader loads the RSI, the Stochastic, and Williams %R on EURUSD, sees all three pinned overbought, and shorts into a strong uptrend on the one-hour chart.
Then the losses stack up. Price keeps climbing, all three oscillators stay pinned high for hours, and each short stops out a little higher. The chart below shows that trend, with the three overbought tools crowded in the lower panes while price walks steadily up.
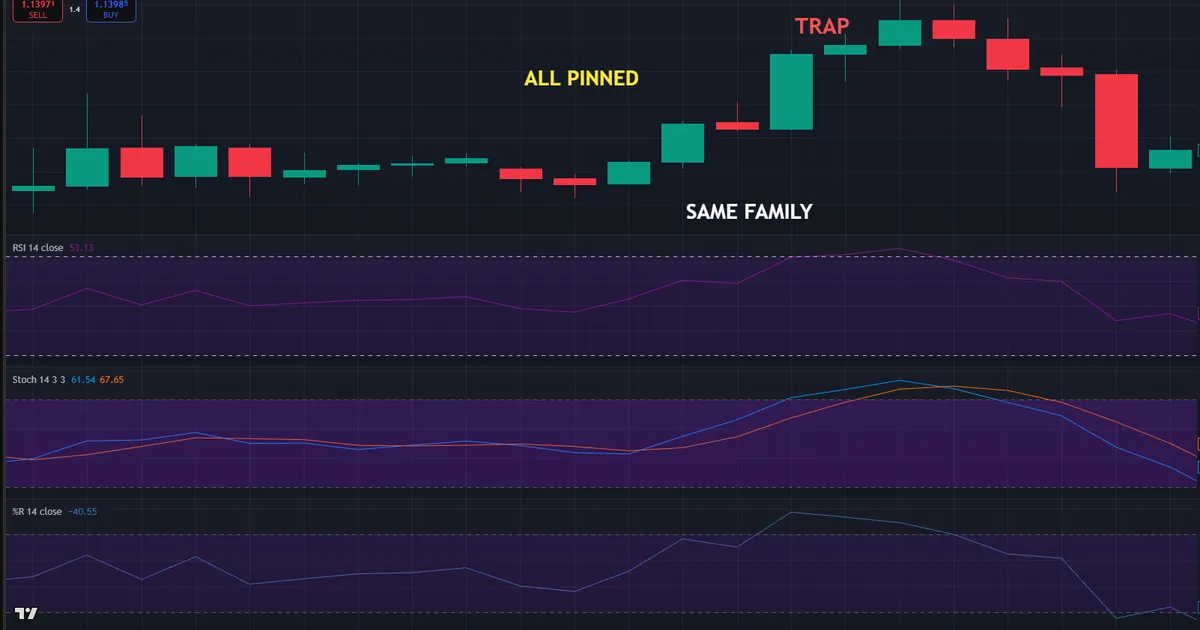
So what went wrong? The three tools were triplets, not a team. Because they share the same momentum math, their agreement carried no independent weight. A trend tool would have shown the uptrend clearly and kept the trader out of every short. Hence the rule that saves the account: never let one category masquerade as three.
Notice the fix costs nothing extra. Swapping one of those three oscillators for a moving average would have flipped the whole read. So the lesson is about the mix, not the number, of tools. One well-chosen trend line beats a crowd of momentum gauges that all echo the same note.
No Combination Beats a Bad Market Read
Be honest about the limits. Even a balanced set of tools cannot fix a wrong read of the market state. In a violent, newsy market, trend and momentum both whip, so confluence forms and fails within minutes.
Guard against that with context. Check the economic calendar and the session before you trust any combination. Because indicators read past price, they lag a shock, so no set of lines survives a surprise rate decision unscathed.
Correlation Can Fool a Multi-Chart Trader
Be honest about a subtler trap. Running the same combination across EURUSD and USDCHF feels like two setups, yet those pairs move nearly opposite each other. So a long on one and a short on the other can double a single bet in disguise.
Treat correlated pairs as one exposure. Before you stack trades across charts, check how the pairs relate, then size the group as a whole. Because hidden correlation inflates risk quietly, a quick check keeps your true exposure honest.
The same caution applies within a single chart. Two tools that seem different can still lean on the same input under the hood. So test whether your picks truly disagree at times, since a pair that never conflicts is really one tool wearing two labels. That test protects the whole premise of a smart combination.
Related Concepts to Study Next
The topic connects to a web of sibling ideas, and a few deserve your next reading hour. Start with the split at the heart of it all in our guide to leading vs lagging indicators. Then see the rule in action with our walk-through of how to use RSI and MACD together.
Two more guides sharpen the picture. Because a volatility tool pairs well with an oscillator, read how to trade Bollinger Bands with RSI for a concrete cross-category example. Then ground the trend slot with our guide to moving averages explained.
For hands-free charting, the oscillator indicators archive gathers the momentum tools, while the trend indicators archive holds the direction tools. Tools speed the work, yet the logic above still carries the trade. So learn the rules first, and let any indicator plot what you already understand.
FAQ
How many indicators should I use at once?
Two or three is plenty for most traders. Pair one trend tool with one momentum tool, then add volume if you want a third view. More than that usually clutters the chart and hides price without adding real insight.
Why is stacking the same type of indicator a problem?
Tools from one family share their input, so they usually agree by design. That agreement adds no new information and breeds false confidence. So spread your picks across categories to see trend, momentum, and volume rather than one view three times.
What is the best indicator combination?
No single set fits everyone, since context and style differ. A moving average, an oscillator, and a volume tool cover the main questions for many traders. Test any combination on history before you trust it with real risk.
Should leading or lagging tools take priority?
Let the lagging trend tool set your bias and the leading momentum tool time the entry. So the trend tool decides which direction you trade, while the oscillator decides when. Neither leads alone, since each covers a gap the other leaves.
Does adding volume really help?
Volume shows whether real participation backs a move, which price tools cannot reveal. A breakout on rising volume reads stronger than one on fading volume. So a simple volume tool often adds more than a fourth price-based indicator would.
Can indicators alone make a trading system?
No, tools only support a plan built on risk, market state, and clear rules. Even a smart combination fails without those foundations. Build the process first, add the tools second, and treat every indicator as a helper rather than a system in itself. Manage risk on every trade. Results are not guaranteed; past performance is not indicative of future results.
External references
- For background on this concept, see Technical Indicators at Corporate Finance Institute.
- For broader market context, see Confluence at BabyPips.

About the author
Written by Dominic Walsh, a Forex trader and MT4/MT5 indicator, Expert Advisor and script developer. Every tool on forexmt4systems.com is tested on live charts before release and ships with ready-to-use compiled MT4 (.ex4) and MT5 (.ex5) files. Learn more about the trader and developer behind this site.
How we build, test and correct every tool: Editorial & Testing Policy. Trading carries risk; see the disclaimer.