
Knowing how to use pivot points gives you a ready-made map of support and resistance before the session even opens. The tool prints a central line and several levels above and below it, and price reacts to those lines all day long.
This guide shows how to use pivot points in real forex trades. So by the end you will trade a clean bounce off support, judge a break through resistance, and read the pivot as a bias line rather than a magic number.
Floor traders built pivot points decades ago to size up a market fast. They needed a single sheet of levels for the day, calculated from yesterday’s range, and the idea carried straight onto modern charts. That simplicity is why the tool still earns screen space today.
How to Use Pivot Points in Forex
A pivot point is the average of yesterday’s high, low, and close. That one number, the PP line, acts as the day’s fair-value anchor. Price above it leans bullish, and price below it leans bearish.
From that anchor the tool projects support and resistance levels. R1, R2, and R3 sit above the pivot, while S1, S2, and S3 sit below it. So the chart gains a full ladder of levels, each one a spot where price has a reason to pause.
The levels are objective, which is their great strength. Every trader using the standard formula sees the same lines on the same pair. Because the crowd watches identical levels, the reactions there become a little self-fulfilling, and that shared attention gives the lines their edge.
Look at a live read first. The chart shows EURUSD on the fifteen-minute timeframe with the Pivot Points Standard indicator on daily levels. The central pivot sits near 1.1417, price trades just above it, and R1 waits overhead near 1.1454. That single frame holds the anchor and the first target together.
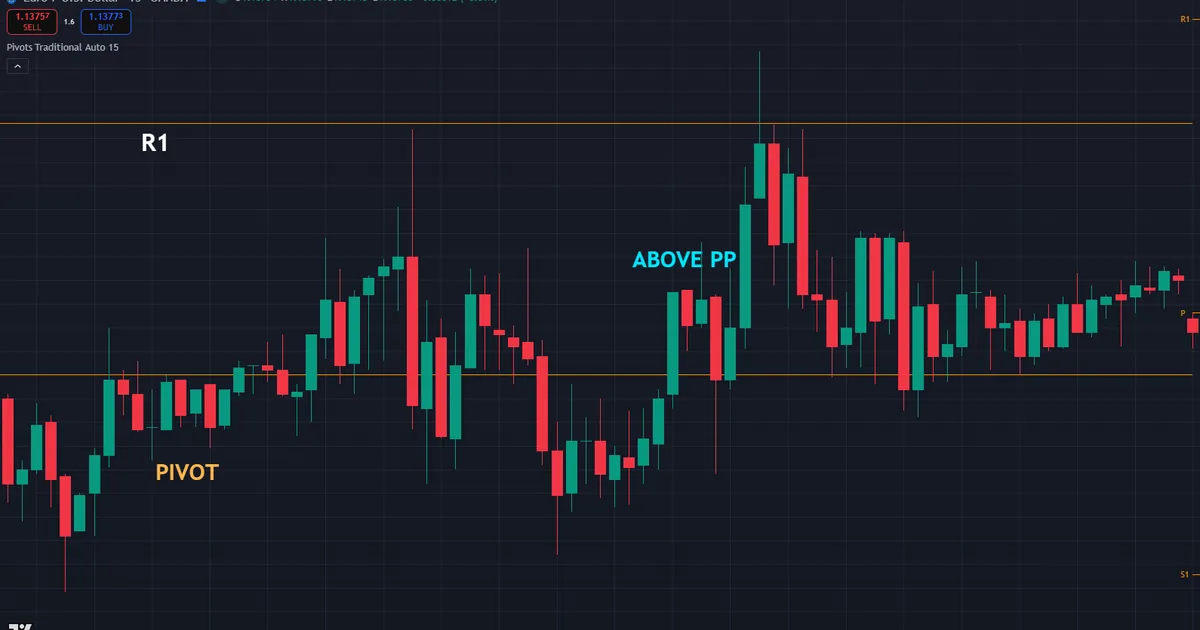
Trace the logic from left to right. First price opened above the pivot, so the daily bias leaned up. Then it pulled back toward the PP line and held. Finally it pushed on toward R1, exactly the level the tool had marked at the open. Because the map was drawn early, the trade plan wrote itself.
Why does this matter for real trades? The levels give you structure, not a blind buy or sell. So a touch of R1 means one thing in a strong uptrend and the opposite inside a quiet range. Read the context first, and the same level stops sending mixed signals.
How the Levels Are Calculated
The math is small, so learn it once and reuse it forever. A handful of formulas build the entire ladder from yesterday’s numbers.
- Pivot point. Add yesterday’s high, low, and close, then divide by three. This PP line is the anchor for the whole day.
- First resistance. Double the pivot and subtract the low. R1 is usually the first upside target and the first real ceiling.
- First support. Double the pivot and subtract the high. S1 is usually the first downside target and the first real floor.
- Outer levels. R2, S2, R3, and S3 extend the range using the pivot and yesterday’s high-low spread, marking the stretched zones for big days.
So the ladder is not guesswork. It flows directly from the prior session’s range, which is why a wide day pushes the levels far apart and a quiet day squeezes them together. The concept graphic below shows that ladder laid out around the central pivot.

Notice the practical takeaway. Because the levels come from yesterday, they are fixed for the whole session and never repaint. So you can plan entries, stops, and targets around them before the first candle even prints, which is a rare luxury in trading.
Daily, Weekly, and Monthly Pivots
The timeframe of the pivot sets its reach. Daily pivots, built from yesterday’s bar, suit intraday trading on the hour and lower charts. They refresh each day, so they track the near-term battle closely.
Weekly and monthly pivots use longer bars and hold for longer. Swing traders lean on them because the levels stay put for days or weeks. So match the pivot period to your holding time, and the levels will sit at the right scale for your trades.
The Two Core Ways to Trade Pivots
Pivot points support two clear playbooks, and the market decides which fits. Learn both, then let the day’s character point you to the right one.
Trading the Bounce
The bounce is the range-day playbook. When price drifts down to S1 and stalls, buyers often step in and push it back toward the pivot. So a rejection candle at S1 sets up a long with a stop just below the level.
The mirror works overhead. When price rises into R1 and stalls, sellers often fade it back toward the pivot. Because the levels cap a quiet range, the bounce trade fits days with no strong trend or news behind them.
Confirmation keeps you honest. Wait for a clear rejection wick or a small reversal candle at the level rather than buying the touch blind. Then let the pivot line itself act as your first target, since price so often gravitates back to that anchor.
Trading the Break
The break is the trend-day playbook. When price closes decisively through R1, the ceiling often becomes a floor, and the move can extend toward R2. So a break-and-retest of R1 sets up a long in the direction of the push.
The downside mirrors it. A firm close below S1 can open the door to S2, especially on a news-driven day. Because a real break needs momentum, this playbook suits trending sessions rather than sleepy ranges.
Patience separates the break from the fake. A single wick through a level rarely holds, so wait for a candle to close beyond it. Then look for a retest that holds the broken level before you commit, which filters most of the traps.
Fitting Pivots Into a Workflow
Session context comes first, since forex runs around the clock. Daily pivots reset at a fixed time, so the levels mean the most during the active London and New York hours. Because liquidity peaks then, the reactions at each level tend to be cleaner.
Confluence lifts the odds sharply. A pivot level that lines up with a round number or a prior swing carries far more weight than one floating alone. So mark where the pivot ladder overlaps other structure, and trade those overlaps first.
Pairing with a trend read sharpens the bias. When the daily trend points up, favour the bounces off support and the breaks through resistance. Our note on support and resistance shows how to blend pivots with the wider level map.
Also let the calculator do the arithmetic. You do not need to work the formulas by hand each morning, since a simple pivot point calculator prints the full ladder in a second. Then you can focus on the read rather than the maths. Most charting platforms also plot the ladder automatically once you add the indicator, so the levels appear the moment you open the pair on any given trading morning.
A Worked Example on EURUSD
Now trace a full bounce from setup to exit. The chart shows EURUSD on the fifteen-minute timeframe with daily pivots. Price opens near the pivot at 1.1417, drifts down through the morning, and reaches S1 near 1.1384 as the London session warms up.

Walk the read step by step. First price arrived at S1, a level the tool had marked at the open. Then a candle printed a long lower wick and closed back up, a clean rejection. Because the bounce came at a known floor with confirmation, the setup lined up neatly.
Reading the Trade Step by Step
The entry followed the rejection. A long sat just above S1 once the reversal candle closed, with a stop a few pips below 1.1380 under the level. So the risk stayed small and clearly defined from the start.
The target used the pivot ladder. Price so often returns to the central pivot after a bounce, so the PP line near 1.1417 gave a logical first exit. Because the ladder framed both the stop and the target, the whole plan sat on the chart before the trade opened.
Follow-through rewarded the patience. Price lifted off S1, climbed back toward the pivot, and stalled there as expected. Meanwhile the invalidation stayed simple, since a firm close below S1 would have flipped the bias and killed the idea.
Download the complete indicator database
Put these concepts on your charts. One email unlocks the full library of 1,380+ indicators with compiled MT4 and MT5 files, plus my TradingView scripts. No paywall, no spam, unsubscribe any time.
Get free access to my indicator database
One email unlocks 1,380+ free MT4, MT5 and TradingView indicators — the complete library. No single-tool download; you get the whole database.
Common Mistakes and How to Fix Them
The tool is simple, yet the same errors repeat on every pair. Most trace back to one decision, mapped in the graphic below: is today a range day for bounces or a trend day for breaks. So the fixes below all flow from reading that character right.

Buying Every Touch of a Level
The most common trap is buying the instant price touches S1. On a trend day that level gives way, and the blind buy fights the move. Instead wait for a rejection candle, since the confirmation separates a real bounce from a level about to break.
Ignoring the Daily Bias
Price above the pivot leans bullish, and price below it leans bearish. Trading against that bias stacks the odds against you. So check which side of the PP line price sits on, and favour trades that agree with it.
Using Pivots on the Wrong Timeframe
Daily pivots on a weekly swing trade sit at the wrong scale, and the levels flicker too fast to help. So match the pivot period to your holding time. Weekly pivots suit swings, while daily pivots suit intraday work.
Forgetting News Events
A major release can blow straight through every level in seconds. Trading a quiet bounce into a rate decision invites a nasty surprise. So check the calendar first, and stand aside through the high-impact prints.
Treating Pivots as Exact Prices
Levels are zones, not razor-thin lines. Price often overshoots a pivot by a few pips before it turns. So give each level a small buffer, and place stops beyond that buffer rather than right on the number.
A Simple Pivot Point Checklist
Run this short list before you act on any pivot signal.
- Read the bias. Note whether price sits above or below the central pivot.
- Judge the day. Decide whether the session looks like a range or a trend.
- Pick the playbook. Trade bounces in a range and breaks in a trend.
- Look for confluence. Favour levels that align with round numbers or old swings.
- Wait for confirmation. Take a rejection candle for a bounce or a close-and-retest for a break.
- Size the risk. Set the stop beyond the level, then let a position size calculator fix the lot.
Work the list top to bottom and most weak signals filter themselves out. Because each step demands context, the setups that survive tend to be the ones worth trading.
When Pivot Points Fail
No tool is a promise, and pivots fail often enough to respect. The most common failure is a strong trend day that slices through level after level without pausing.
Picture a EURUSD trend day near 1.1400. Price reaches R1 and a range trader shorts it, expecting a fade back to the pivot. Then a firm bid drives price straight through R1, on to R2, and the short bleeds against a market that simply refused to turn.
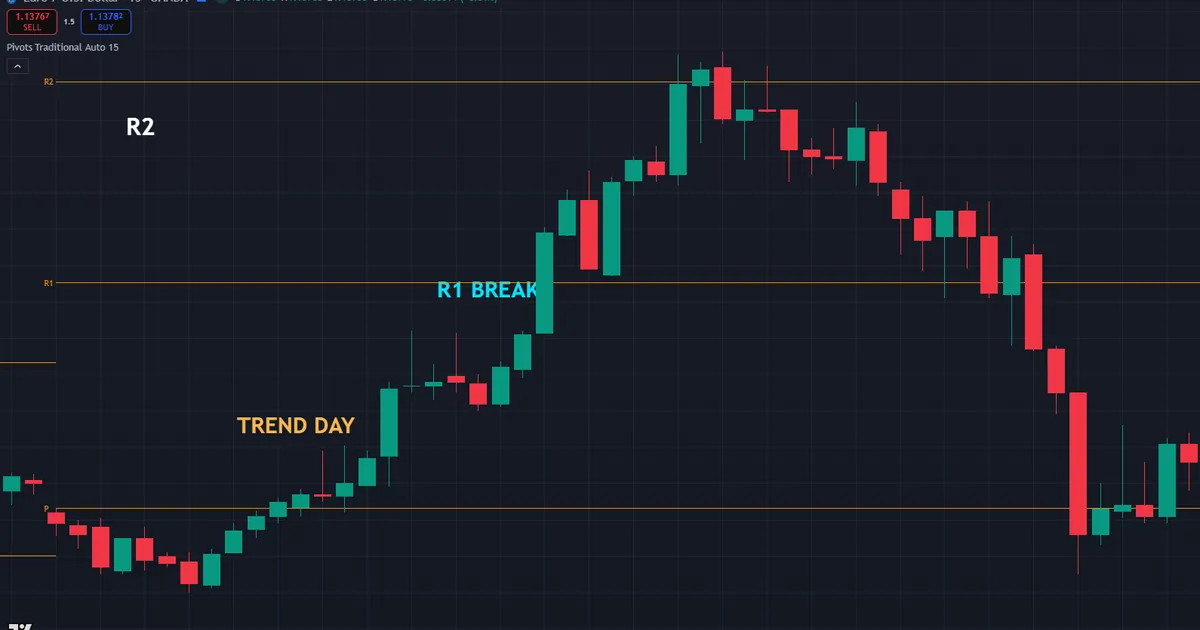
So what went wrong? The day was trending, not ranging, so the bounce playbook was the wrong tool. Because the trader faded a level on a momentum day, the setup became a trap instead of a fade.
Here is the calmer way to handle it. First judge the day before you pick a playbook. On a trend day, trade the breaks and retests instead of the fades. Because the risk stayed small, the bad read was a scratch rather than a wound.
Thin or gappy sessions also distort the levels. Over a weekend gap or a holiday, price can open far from the pivot and ignore the ladder entirely. So treat the levels with caution when liquidity is light and the prior range no longer reflects the market.
An unusual prior day skews the whole ladder too. If yesterday printed a huge spike on a one-off event, today’s levels stretch to match and sit far from current price. Because the inputs were distorted, the resulting map can mislead, so sanity-check the ladder against recent structure before you lean on it. When the levels look stretched far beyond normal, give them less weight and let recent price action lead the read instead of the numbers on the sheet.
How Reliable Are Pivot Points
Honesty beats hype with any level tool. Pivot points are a map, not a crystal ball, and they shine brightest when the whole market watches the same lines. So their value rises on liquid pairs during the busy sessions, where the crowd reacts at each level.
Reliability climbs when several factors line up. A pivot that sits on a round number carries more weight than one alone. A pivot that agrees with the daily bias beats one that fights it. Because each layer of confluence filters noise, stacked levels simply hold up better than a single line.
Reliability drops on illiquid pairs and quiet hours. When few traders watch, the reactions at each level turn ragged and unreliable. So the major pairs during London and New York give the cleanest reads, and the exotic crosses give the muddiest.
Set Honest Expectations
Every method has losing trades, and pivots are no exception. Some bounces fail, some breaks fake out, and some run clean to target. Because outcomes vary, the edge lives in a repeatable process with tight risk, not in any single perfect level.
Keep a record so the tool earns your trust over time. A short log of each pivot trade, its context, and its result shows which levels and sessions suit your style. Our trade journal gives you a simple place to track that, and the data beats a hunch every time.
Combining Pivots With Candles
Candlestick signals sharpen the timing at each level. A pin bar or an engulfing candle right at S1 tells you the level is holding in real time. So the pivot names the location, and the candle names the moment, which is a natural division of labour.
This pairing filters many weak touches in one step. Because the level supplies the where and the candle supplies the when, you skip the blind touches that lack any confirmation. That single habit turns a rough level map into a precise timing tool on the busy pairs.
Reading the Central Pivot as a Bias Line
The central pivot does more than mark a level. It splits the day into a bullish half and a bearish half, which frames every other decision. So the first read each morning is simply which side of the pivot price sits on.
Above the pivot, buyers hold the upper hand, and dips toward the line often find support. Below it, sellers lead, and rallies into the line often meet resistance. Because the bias flips at that one number, a break back across the pivot can signal a genuine shift in the day’s tone.
Watch how price treats the line on the retest. A clean hold above the pivot after a pullback confirms the bullish bias and often precedes the push to R1. Meanwhile a failure to reclaim the pivot after a dip warns that control has passed to the sellers for the session.
Related Concepts to Study Next
Pivots connect to a web of level-based ideas, and two deserve your next reading hour. To ground the tool in its basics, read our primer on pivot points explained, which covers the anchor and the ladder in full. Meanwhile the formulas branch into several families, so our guide to the types of pivot points shows how Fibonacci, Camarilla, and others differ.
For automated help, the trend indicators archive plots these bias tools for you, while the Fibonacci indicators archive covers the ratio-based levels that pair so well with pivots. Tools speed the work, yet the logic above still carries the trade.
FAQ
What are pivot points used for in forex?
Pivot points mark ready-made support and resistance for the session, built from yesterday’s high, low, and close. Traders use the central pivot as a bias line and the R and S levels as targets and reversal zones. The lines help plan entries, stops, and exits in advance.
How do I calculate the pivot point?
Add yesterday’s high, low, and close, then divide the total by three. That gives the central pivot. From there, double the pivot and subtract the low for R1, or subtract the high for S1. A pivot calculator handles the full ladder for you.
Should I trade bounces or breaks at pivots?
It depends on the day. On a quiet range day, trade bounces off the levels back toward the pivot. On a trending or news-driven day, trade breaks through the levels in the direction of the push. Reading the day’s character decides the playbook.
Which pivot timeframe should I use?
Match the pivot period to your holding time. Daily pivots suit intraday trading on the hour and lower charts. Weekly and monthly pivots suit swing trades that last several days, since those levels hold for longer stretches.
Do pivot points repaint or change during the day?
No, and that is a big advantage. Daily pivots are fixed at the session open from the prior day’s bar, so the levels never move during the day. That stability lets you plan the whole trade before the first candle prints.
Can I trade pivot points on their own?
You can, but they read best with context. Pair the levels with the daily bias, confluence, and firm risk control for cleaner trades. Manage risk on every trade. Results are not guaranteed; past performance is not indicative of future results.
External references
- For background on this concept, see Pivot Points at BabyPips.
- For broader market context, see Pivot Points at Corporate Finance Institute.

About the author
Written by Dominic Walsh, a Forex trader and MT4/MT5 indicator, Expert Advisor and script developer. Every tool on forexmt4systems.com is tested on live charts before release and ships with ready-to-use compiled MT4 (.ex4) and MT5 (.ex5) files. Learn more about the trader and developer behind this site.
How we build, test and correct every tool: Editorial & Testing Policy. Trading carries risk; see the disclaimer.