
The types of pivot points share one goal yet reach it by different maths. Each formula turns yesterday’s range into a ladder of support and resistance, but the spacing and the weighting change from one method to the next.
This guide walks the five main types of pivot points side by side. So by the end you will know how Standard, Fibonacci, Camarilla, Woodie, and DeMark levels differ, and which one suits your pair and your style.
All five methods trace back to floor traders who needed a fast read on the day. They wanted objective levels drawn before the open, calculated from the prior session. That shared root is why every type still starts from the same three numbers: yesterday’s high, low, and close.
The Main Types of Pivot Points
Pivot points come in five common families, and each answers the same question a little differently. Where will price find support and resistance today, based on yesterday’s action?
The Standard method is the classic, an equal-weight average of the high, low, and close. Fibonacci pivots keep that same anchor but space the levels using ratio multipliers. Camarilla pulls the levels in tight around the close, while Woodie leans on the close more heavily, and DeMark builds a conditional set from the open-close relationship.
Look at a live read first. The chart shows GBPUSD on the fifteen-minute timeframe with the Pivot Points Standard indicator on daily levels. The central pivot sits near 1.3377, with R1 above near 1.3395 and S1 below near 1.3356. That single frame shows the anchor and its first levels in one clean view.
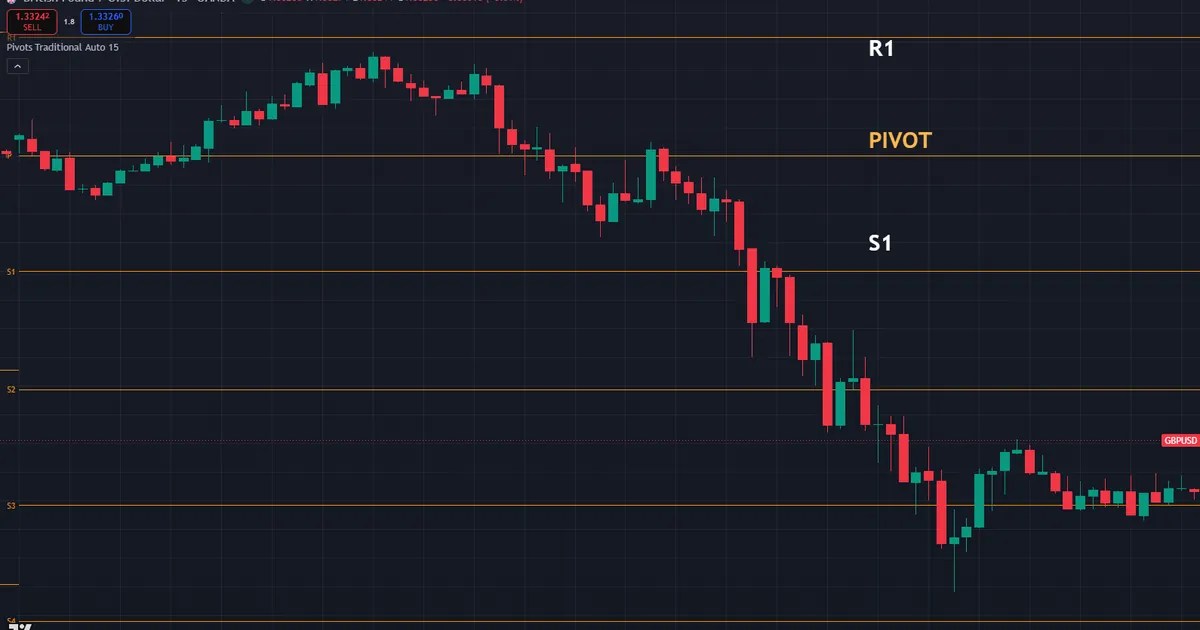
Trace the idea from there. Every other type would place its own pivot near that same anchor, then spread its support and resistance lines at different distances. So the core stays constant while the spacing shifts, and that shift is the whole story of the five families.
Why does the choice matter for real trades? Tighter levels like Camarilla suit fast mean-reversion, while wider levels suit trend targets. So the right type depends on how you trade, not on which method is best in the abstract. A scalper and a swing trader can look at the same pair and reasonably choose two different families.
How Each Type Is Calculated
The formulas are compact, so learn the pattern once and the differences stand out. Each family starts from the same inputs and then applies its own twist.
- Standard. The pivot equals the high plus the low plus the close, divided by three. R1 doubles the pivot and subtracts the low, and S1 doubles it and subtracts the high.
- Fibonacci. The pivot matches the Standard anchor, then the levels sit at 38.2, 61.8, and 100 percent of yesterday’s range above and below it.
- Camarilla. The levels build from the close plus the range times small multipliers, so the key lines cluster tightly around the close.
- Woodie. The pivot weights the close twice, using high plus low plus two closes divided by four, which pulls the anchor toward the session’s end.
- DeMark. A conditional value shifts with the open-close relationship, producing a single support and resistance pair rather than a full ladder.
So the differences are real but small. Each type still leans on yesterday’s high, low, and close, and each still draws lines where price may pause. The concept graphic below stacks the five families so you can see how the spacing changes.
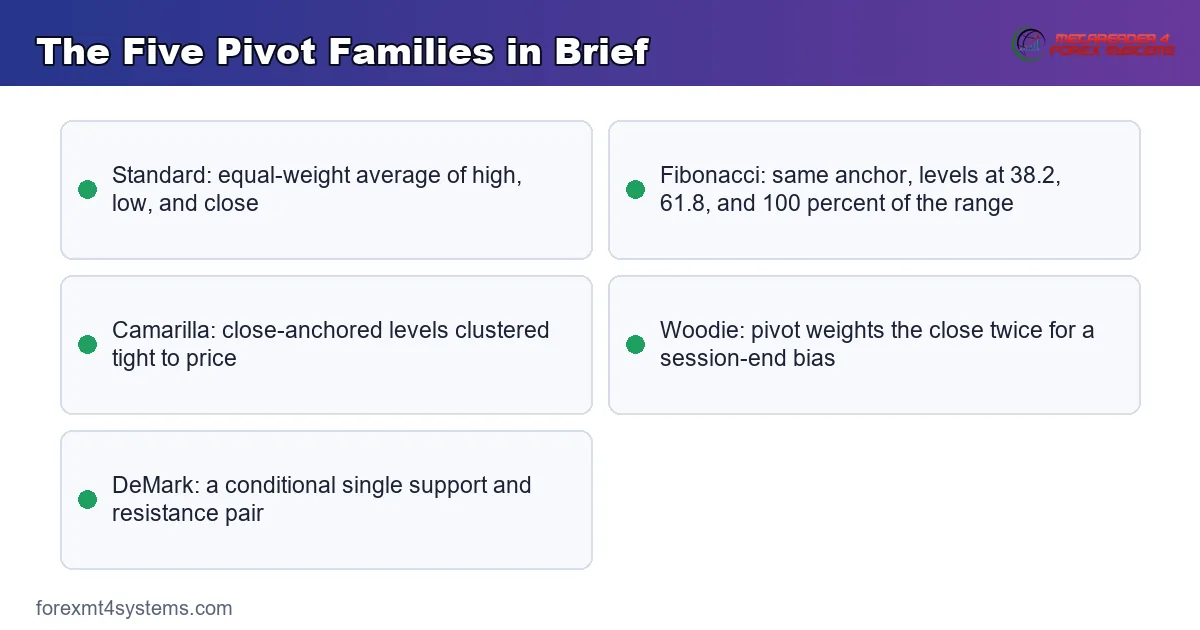
Notice the practical takeaway. Because the inputs are shared, the pivots themselves land close together across most methods. The real divergence shows in the outer levels, where Fibonacci and Standard spread wide while Camarilla stays tight to the close.
A Side-by-Side Comparison
The table below sums up the five families at a glance. Read it as a menu, then pick the type that matches how you like to trade.
| Type | Pivot Formula | Level Spacing | Best Suited To |
|---|---|---|---|
| Standard | (High + Low + Close) / 3 | Even, medium width | All-round intraday trading |
| Fibonacci | (High + Low + Close) / 3 | Ratio-based, 38.2 to 100% | Traders who already use Fibonacci |
| Camarilla | Close-anchored levels | Tight, close to price | Fast mean-reversion scalps |
| Woodie | (High + Low + 2 x Close) / 4 | Even, close-weighted | Traders who value the close |
| DeMark | Conditional on open vs close | Single support-resistance pair | Simple one-level bias reads |
Read the table row by row and the pattern is clear. Standard and Woodie stay close in shape, Fibonacci reshapes the spacing, and Camarilla and DeMark each solve a narrower job. Because the goal is shared, switching types changes the detail rather than the whole approach.
When to Use Each Type
Choosing a type is about fit, not ranking. Each family has a natural home, so match the method to your market and your habit.
Standard and Woodie for the All-Rounder
Standard pivots are the safe default, and most platforms show them first. The levels sit at sensible, even distances that suit the major pairs on the hour chart. So a new trader loses nothing by starting here and learning the reactions.
Woodie pivots differ mainly in the anchor, since they weight the close twice. Traders who believe the closing price carries the most information lean this way. Because the pivot pulls toward the close, Woodie levels can sit a touch differently on days with a strong finish.
Fibonacci for the Ratio Trader
Fibonacci pivots suit anyone already using the golden-ratio levels. The 38.2 and 61.8 percent lines line up naturally with retracement thinking, so the two tools reinforce each other. Our free Fibonacci calculator helps you check those ratio levels quickly alongside the pivots.
Camarilla for the Scalper
Camarilla pivots pull the key levels tight around the close, which suits fast mean-reversion. Scalpers watch the third and fourth levels for sharp reversal or breakout cues. Because the lines sit close to price, the method fires more setups on quiet range days than the wider families do.
DeMark for the Minimalist
DeMark pivots strip the ladder down to a single support and resistance pair. The conditional formula shifts with the open-close relationship, giving one clean bias read. So a trader who wants less clutter and a single decision line often prefers this compact approach.
The conditional twist deserves a closer look. When yesterday closed below its open, the formula leans the levels lower, and when it closed above the open, they lean higher. Because the prior bar’s shape feeds directly into the calculation, DeMark levels adapt to momentum in a way the fixed formulas do not. So the method quietly encodes a read of the previous session’s tone before you even glance at today’s price action on the chart.
Fitting Pivot Types Into a Workflow
Pick one type and learn it well before you compare others. Flipping between families every session muddies your read, since each spaces its levels differently. So commit to a default first, and add a second type only once the first feels natural.
Match the type to your holding time as well. Scalpers gravitate to Camarilla, intraday traders to Standard, and ratio fans to Fibonacci. Because the spacing suits different speeds, the right type quietly reduces the number of judgement calls you face.
Confluence still rules whichever type you choose. A level that overlaps a round number or an old swing beats one that stands alone. Our guide on pivot points explained covers how to read those overlaps across any of the five families.
Let a calculator handle the arithmetic every time. You never need to work the multipliers by hand, since a pivot point calculator prints the full ladder for each type in a second. Then you can spend your energy on the read instead of the maths.
A Worked Example on GBPUSD
Now compare two types on the same day. The chart shows GBPUSD on the fifteen-minute timeframe with Standard pivots. The pivot sits near 1.3377, S1 near 1.3356, and price drifts down toward that first support through the London morning.
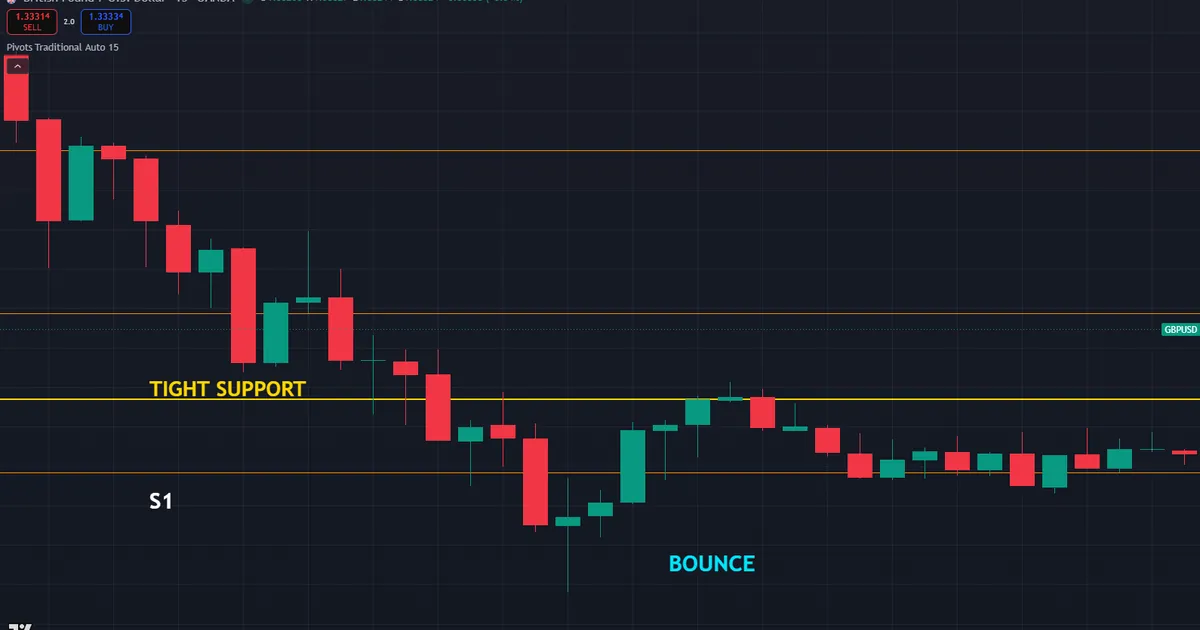
Walk the read step by step. First price reached S1, the Standard first support. A Camarilla trader would have seen a tighter third-level support a few pips higher, catching the turn sooner. Because the two methods space the levels differently, they mark slightly different entry zones on the very same chart.
Reading the Trade Step by Step
The Standard read waited for the S1 test. A rejection candle at 1.3356 offered a long, with a stop just below the level. So the risk stayed small, and the central pivot near 1.3377 gave a logical first target.
The Camarilla read acted earlier and tighter. Its clustered support sat a touch above S1, so that trader entered sooner with a smaller stop but a nearer target too. Because both methods aimed at the same bounce, they simply framed the risk and reward at different distances.
Follow-through rewarded both plans in different measure. Price bounced off the support zone and climbed toward the pivot as expected. Meanwhile the choice of type shaped the trade size and the target, which is exactly how the families diverge in practice.
Download the complete indicator database
Put these concepts on your charts. One email unlocks the full library of 1,380+ indicators with compiled MT4 and MT5 files, plus my TradingView scripts. No paywall, no spam, unsubscribe any time.
Get free access to my indicator database
One email unlocks 1,380+ free MT4, MT5 and TradingView indicators — the complete library. No single-tool download; you get the whole database.
Common Mistakes and How to Fix Them
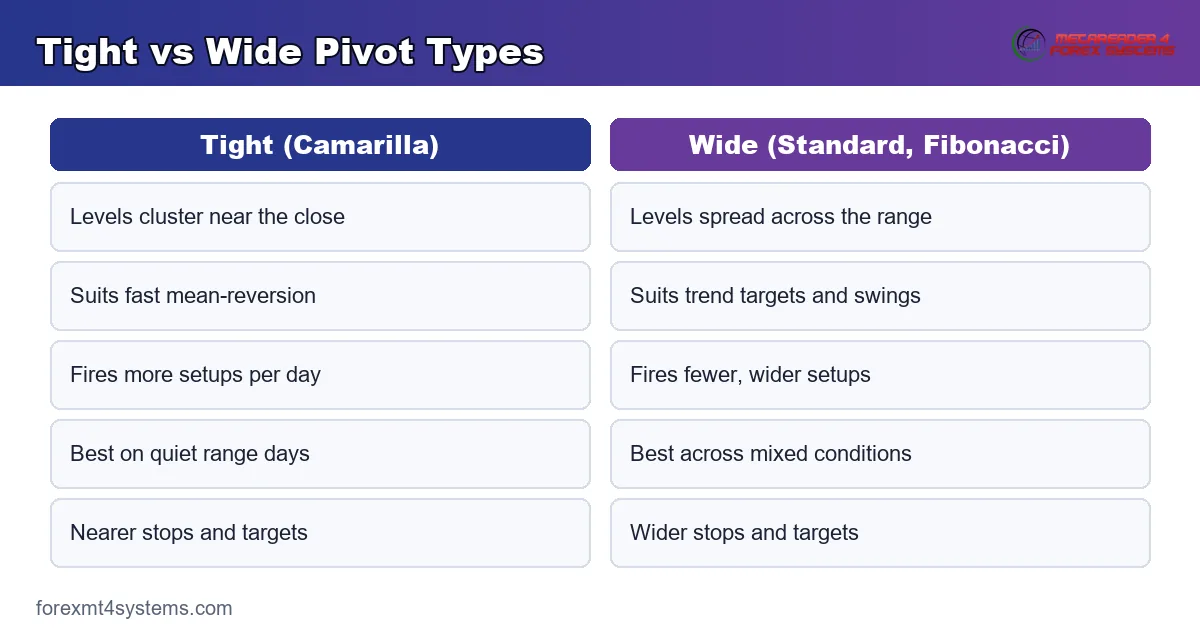
The types are simple, yet the same errors repeat across all of them. Most trace back to one decision, mapped in the graphic below: match the type to your style, then read the day. So the fixes below all flow from choosing well and reading the context.
Switching Types Too Often
Traders often hop between families chasing cleaner signals. Each switch resets your instincts, since the levels move. So pick one type, learn its reactions on your pairs, and change only with a clear reason.
Expecting Different Types to Agree
The five families space their levels differently, so their lines rarely match exactly. Waiting for all of them to line up leads to paralysis. Instead trust your chosen type, and treat overlaps with other structure as the real bonus.
Using Camarilla on Trend Days
Camarilla’s tight levels suit range days, not strong trends. On a momentum day, price slices through the clustered lines fast. So save the tight mean-reversion levels for quiet sessions, and switch your thinking to breaks when the day trends.
Ignoring the Session and News
Any pivot type can shatter on a big release. Trading a quiet fade into a rate decision invites a nasty gap through every level. So check the calendar first, and stand aside through the high-impact prints whichever type you use.
Treating Levels as Exact Prices
Every type marks zones, not razor lines. Price often overshoots a level by a few pips before it turns. So give each line a small buffer, and place stops beyond that buffer rather than right on the number.
A Simple Pivot Type Checklist
Run this short list before you rely on any pivot type.
- Choose your type. Match Standard, Fibonacci, Camarilla, Woodie, or DeMark to your style.
- Set the period. Use daily levels for intraday and weekly levels for swings.
- Read the bias. Note whether price sits above or below the central pivot.
- Judge the day. Decide whether the session suits bounces or breaks.
- Look for confluence. Favour levels that align with round numbers or old swings.
- Size the risk. Set the stop beyond the level, then confirm the lot with a position size calculator.
Work the list top to bottom and the type choice stops feeling random. Because each step demands context, the setups that survive tend to be the ones worth trading.
Limitations of Every Pivot Type
No type is a promise, and each shares the same weak spots. The biggest is a strong trend that ignores the levels and runs, regardless of which formula drew them.
Picture a GBPUSD trend day near 1.3360. Price reaches the first resistance and a range trader shorts it, expecting a fade. Then a firm bid drives price straight through the level and on to the next, and the short bleeds against a market that refused to turn.
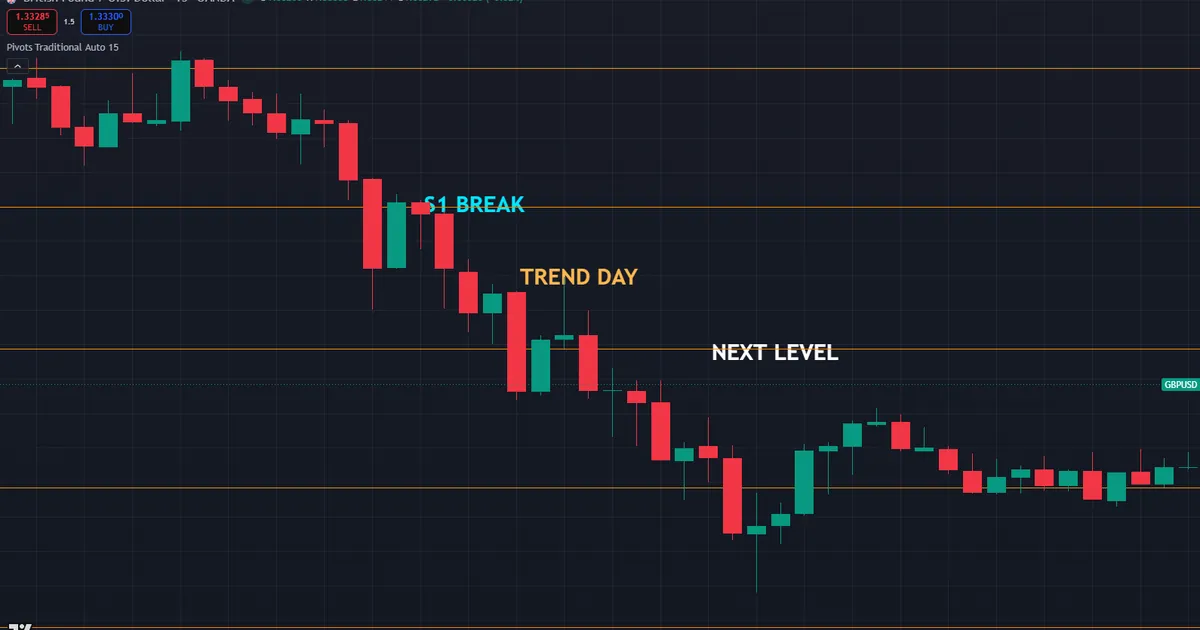
So what went wrong? The type did not fail; the read did. Because the trader faded a level on a momentum day, no formula could have saved the trade. The Standard, Fibonacci, or Camarilla lines would all have broken the same way.
Here is the calmer way to handle it. First judge the day, then pick bounces or breaks accordingly. On a trend day, trade the breaks and retests instead of the fades. Because the risk stayed small, the bad read was a scratch rather than a wound.
Thin liquidity and gaps hurt every type too. Over a weekend gap or in the quiet hours, price can open far from the pivot and ignore the whole ladder. So treat the levels with caution when the prior range no longer reflects the current market.
Who Developed Each Pivot Type
A little history explains why the families differ. Each method came from a trader solving a specific problem, so the design reflects a point of view rather than a rule handed down from nowhere.
Standard pivots grew out of the trading floors, where dealers needed a fast daily read. The equal-weight average was simple enough to work out by hand each morning. So the classic method spread widely precisely because anyone could calculate it in seconds.
Camarilla pivots came from Nick Scott in the late 1980s. He built the tight, close-anchored levels around the idea that price tends to return toward the prior close. Because his multipliers pull the lines in, the method suits the fast reversion trades he favoured.
Woodie pivots carry the name of the trader Tom Woodie, who weighted the close twice. He believed the closing price held the most information about the session. So his anchor leans toward where the day finished rather than treating all three inputs equally.
DeMark pivots came from Tom DeMark, a well-known market technician. His conditional formula shifts with the open-close relationship, which makes the levels adapt to the shape of the prior bar. That single pair suits traders who want one clean decision line.
How Reliable Are Pivot Types
Honesty beats hype with any level tool. Pivot types are maps, not crystal balls, and they work best when many traders watch the same lines. So the major pairs during the busy sessions give the cleanest reactions across every family.
Reliability climbs when several factors line up. A pivot that sits on a round number carries more weight than one alone. A level that agrees with the daily bias beats one that fights it. Because each layer of confluence filters noise, stacked levels simply hold up better than a lone line.
Reliability drops on illiquid pairs and quiet hours, whichever type you pick. When few traders watch, the reactions turn ragged and the levels lose their pull. So the choice of type matters far less than the liquidity and the context around the trade.
Set Honest Expectations
Every method has losing trades, and no pivot type escapes that. Some bounces fail, some breaks fake out, and some run clean to target. Because outcomes vary, the edge lives in a repeatable process with tight risk, not in the perfect choice of formula.
Keep a record so your chosen type earns its trust over time. A short log of each trade, its type, and its result shows which family and session suit your style. That written history beats a hunch, and it quietly guides you toward the method that fits your habits. Over a few dozen trades, the pattern in your own results speaks far louder than any general rule about which family is best, and it costs nothing but a moment of honest note-taking after each and every position finally closes on the chart.
Related Concepts to Study Next
Pivot types connect to a web of level-based ideas, and two deserve your next reading hour. To put the levels into action, read our walkthrough on how to use pivot points, which covers bounces and breaks in depth. Meanwhile the levels pair naturally with the wider map, so our note on support and resistance shows how to blend them.
For automated help, the Fibonacci indicators archive plots the ratio-based levels for you, while the trend indicators archive covers the bias tools that pair so well with any pivot type. Tools speed the work, yet the logic above still carries the trade.
FAQ
What are the main types of pivot points?
The five common types are Standard, Fibonacci, Camarilla, Woodie, and DeMark. Standard is the classic equal-weight average. Fibonacci spaces the levels by ratio, Camarilla clusters them near the close, Woodie weights the close more heavily, and DeMark builds a single conditional pair.
Which type of pivot point is best?
No single type is best; the right one depends on your style. Scalpers often prefer the tight Camarilla levels, intraday traders lean on Standard, and ratio fans choose Fibonacci. Test a type on your pairs and keep the one whose reactions you read most clearly.
How do Fibonacci pivot points differ from Standard?
Both share the same central pivot from the high, low, and close. Fibonacci pivots then place the support and resistance lines at 38.2, 61.8, and 100 percent of yesterday’s range, while Standard uses its own even formula. The anchor matches, but the spacing changes.
What makes Camarilla pivots different?
Camarilla pivots anchor their levels to the close and use small multipliers, so the key lines sit tight around price. The third and fourth levels guide reversal and breakout decisions. That tight spacing suits fast mean-reversion on quiet range days.
Do all pivot types repaint during the day?
No, none of them repaint. Every type fixes its levels at the session open from the prior period’s bar, so the lines stay put through the day. That stability lets you plan the whole trade in advance, whichever type you choose.
Can I use more than one pivot type at once?
You can, but start with one to avoid clutter. Once a single type feels natural, an overlap between two families can add confidence. Manage risk on every trade. Results are not guaranteed; past performance is not indicative of future results.
External references
- For background on this concept, see Camarilla Pivot Points at BabyPips.
- For broader market context, see Floor Trader at Corporate Finance Institute.

About the author
Written by Dominic Walsh, a Forex trader and MT4/MT5 indicator, Expert Advisor and script developer. Every tool on forexmt4systems.com is tested on live charts before release and ships with ready-to-use compiled MT4 (.ex4) and MT5 (.ex5) files. Learn more about the trader and developer behind this site.
How we build, test and correct every tool: Editorial & Testing Policy. Trading carries risk; see the disclaimer.