
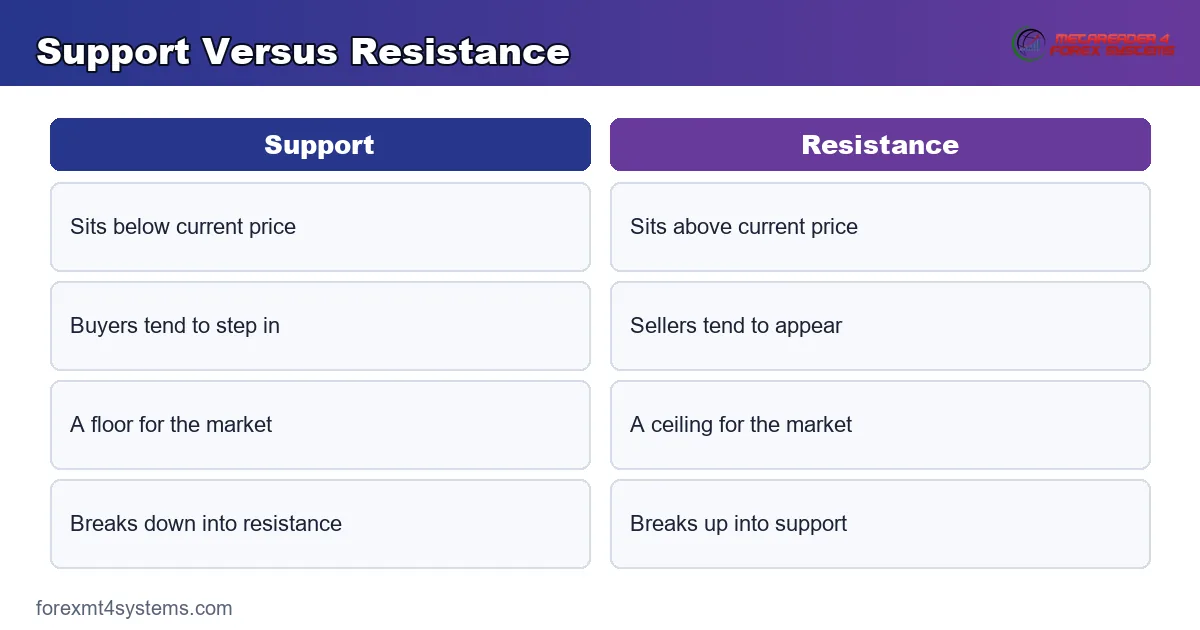
Support and resistance explained in one line: they are the price zones where a market has repeatedly stopped and turned. Support sits below price where buyers tend to step in, and resistance sits above where sellers tend to appear. These zones act as the market’s memory of where deals happened before, and they shape almost every trading decision on the chart.
This guide keeps support and resistance explained in plain terms for forex traders. By the end you will draw clean zones, understand why old resistance becomes new support, and use these levels to plan entries, stops, and targets with confidence.
Support and Resistance Explained for Forex
Every chart is a record of past decisions. When price falls to a level and buyers repeatedly defend it, that level becomes support. When price rises to a level and sellers repeatedly cap it, that level becomes resistance.
These are zones, not exact lines. Price often overshoots a level by a few pips, then snaps back. So think of support and resistance as bands with a little thickness, drawn around the area where reactions cluster rather than one perfect price.
Look at a concrete case. The chart shows EURUSD on the four-hour timeframe near 1.1452, with a horizontal resistance zone drawn across three prior highs. Price rallies into that zone twice, stalls, and falls away each time. That single frame shows how a level earns its status through repeated reactions.
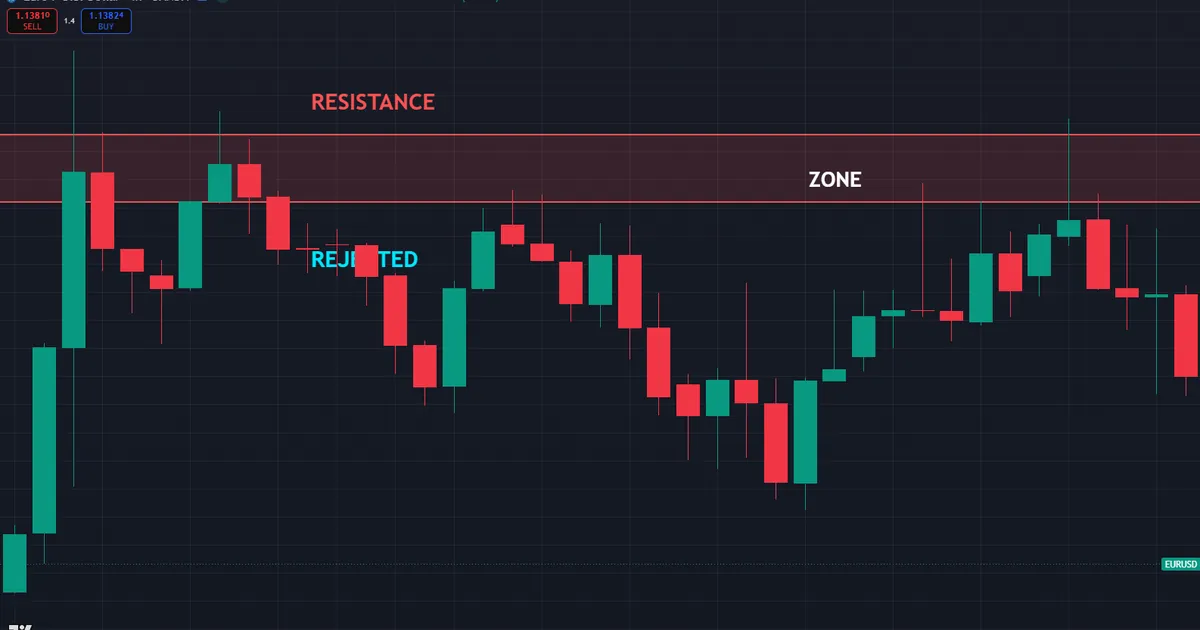
Now trace the logic from left to right. First price reaches the zone and sellers push it back. Then it returns and the same thing happens again. Because the market remembers where supply appeared, that shared memory keeps drawing sellers to the same area. So the zone framed exactly where the rallies ran out of room.
Why does this matter for real trades? Support and resistance give you a map of where reactions are likely, not a promise of one. So a touch of resistance is a place to watch closely, not an automatic short. Read the context first, and the zones become useful reference points rather than blind triggers.
Why Support and Resistance Form
The zones are not magic. They form because real orders and human behaviour cluster at memorable prices. Learn the causes once and the levels make sense forever.
- Order memory. Traders who missed a prior turn place orders to act if price returns to the same area.
- Round numbers. Prices ending in round figures attract attention, so orders bunch at those levels.
- Prior swings. Old swing highs and lows stay visible on the chart, drawing reactions when price revisits them.
- Regret and relief. Traders trapped on the wrong side often exit at breakeven when price returns, adding pressure at the level.
- Self-fulfilling focus. Because so many traders watch the same zones, their combined orders reinforce the reaction.
So a support or resistance zone is where the crowd has agreed, again and again, that price is expensive or cheap. That agreement leaves a footprint on the chart. The concept graphic below shows how repeated reactions build a zone over time.
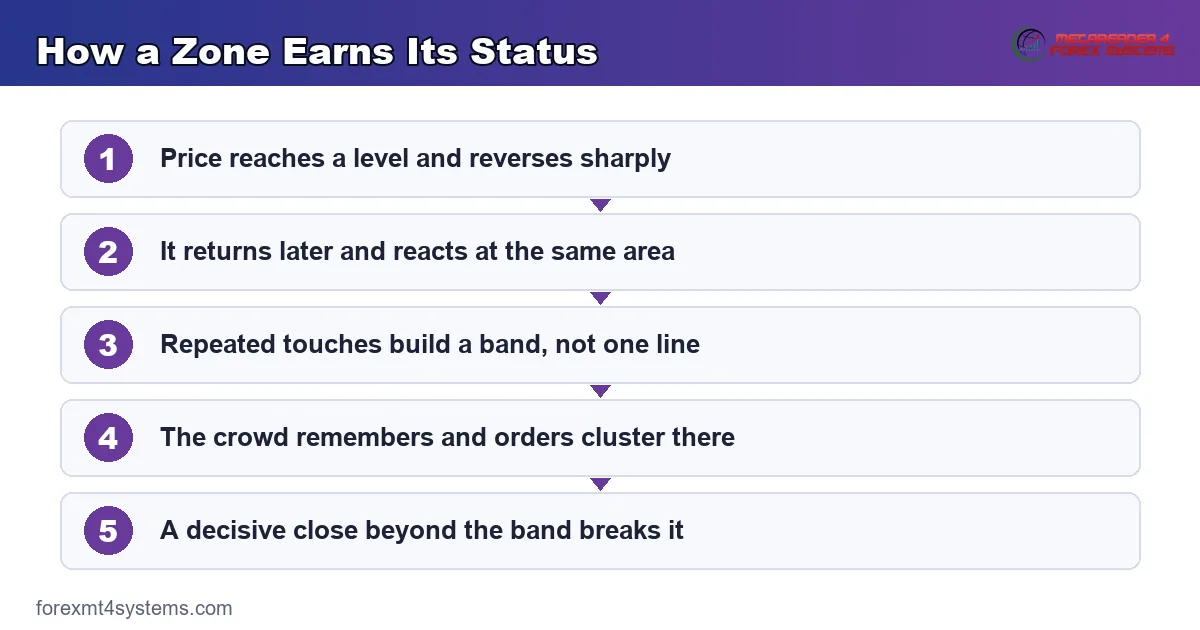
Because the zones rest on human memory, they weaken as they age. A level defended last week carries more weight than one from a year ago. So the freshness of a zone matters as much as how many times price has respected it.
Distance matters too. A zone that price has drifted far away from loses relevance, because the traders who cared about it have mostly moved on. So the levels closest to current price deserve the most attention, while far-off zones fade into history.
What Makes a Zone Strong
Not all levels are equal. A strong zone shows several clear reactions, ideally on a higher timeframe. So three sharp rejections from a daily level beat one shallow pause on the five-minute chart.
The reaction quality matters too. A hard, fast rejection shows committed sellers or buyers, while a slow drift suggests a soft level. So weigh both the number of touches and the force behind each one before you trust a zone.
The Psychology Behind the Levels
Every zone tells a story about human emotion. Traders feel regret when they miss a move and relief when a losing trade returns to breakeven. So both feelings drive orders back to the same prices.
Picture a trader who bought too high and watched price fall. When price climbs back to their entry, they often sell just to escape the loss. Because many traders share that instinct at the same level, their combined exits create resistance. So the zone reflects a crowd of decisions, not a single line on a screen.
Zones Versus Exact Lines
Beginners often draw support as a single pixel-perfect line. Real markets rarely respect that precision. So draw a band that covers the wicks and closes of the reactions, and treat any move inside that band as a test of the level.
Because the zone has thickness, a small break beyond it is not automatically a breakout. Price can poke past a level and reverse, trapping traders who acted on the first touch. So wait for a clear close beyond the zone before you call it broken.
Role Reversal: Support Becomes Resistance
This is the single most useful idea in the whole topic. When price breaks through a level, that level often flips its role. Old resistance becomes new support, and old support becomes new resistance.
The reason is memory again. Once buyers break above a resistance zone, that zone is now below price. Traders who sold there may cover on a return, and new buyers defend it. So the ceiling becomes a floor, and the flip gives you a fresh place to trade.
Trading the Flip
Role reversal creates some of the cleanest setups on the chart. After a break above resistance, wait for price to pull back to the broken zone. So the old resistance, now support, becomes a low-risk place to join the move with a tight stop below it.
The mirror applies on the downside. After a break below support, a pullback to the broken level offers a short with a stop just above. Because the flip is so widely watched, these retests often produce sharp, clean reactions that reward patience.
Why the Flip Fails Sometimes
A flip is a tendency, not a rule. A weak break with no follow-through can snap right back through the level. So confirm the break was decisive, with a strong close beyond the zone, before you trust the retest.
Because false breaks are common, the retest itself is your filter. If price returns to the broken zone and slices straight back through, the flip has failed. So keep your stop tight and let the level prove it has genuinely changed roles.
Volume can add useful confirmation to a flip. A break on rising participation tends to stick, while a break on thin, quiet trade often fades. So a decisive close backed by strong activity gives the retest a better chance of holding. Still, treat volume as one clue among several, not a signal on its own.
How to Draw Support and Resistance
Drawing clean zones is a skill worth practising. The goal is a few meaningful levels, not a chart covered in lines. So focus on the areas where price reacted most clearly.
Start on a higher timeframe, such as the daily or four-hour chart. Mark the obvious swing highs and lows where price turned sharply. Then draw a horizontal zone across each cluster of reactions, covering the wicks and bodies involved.
Decide how you weight wicks versus closes as you draw. Some traders anchor zones to closing prices, treating wicks as noise. Others include the full wick to capture the extreme. So pick one method and apply it consistently, because a steady rule beats guessing anew on every chart.
Keeping the Chart Clean
Less is more with these levels. Three or four strong zones give you a clear map, while a dozen lines create noise. So keep only the levels that price has respected clearly, and delete the rest.
Because clutter leads to hesitation, a clean chart helps you act. So revisit your zones regularly, remove the ones price has left far behind, and add fresh levels as new swings form. A tidy chart is easier to trust under pressure.
Pairing Zones With Other Tools
Support and resistance read best beside other reference points. A zone that lines up with a Fibonacci level or a round number carries extra weight. So look for confluence, because a level backed by more than one reason tends to hold better.
Our guide to Fibonacci retracement shows how those ratios often overlap with structure. When a Fibonacci level and a support zone share the same price, the case for a reaction grows stronger. So stack your tools and let them agree before you commit.
Worked Example: A Resistance Flip on EURUSD
Picture EURUSD grinding higher and stalling at a resistance zone near 1.1452 on the four-hour chart. Price has been rejected there twice, so the level is well established. The whole area looks like a firm ceiling.
Then the picture changes. A strong bullish candle closes decisively above 1.1452, breaking the resistance. Price runs on, then begins to pull back toward the broken zone. The chart below marks the old resistance, the breakout candle, and the pullback into the flipped level.
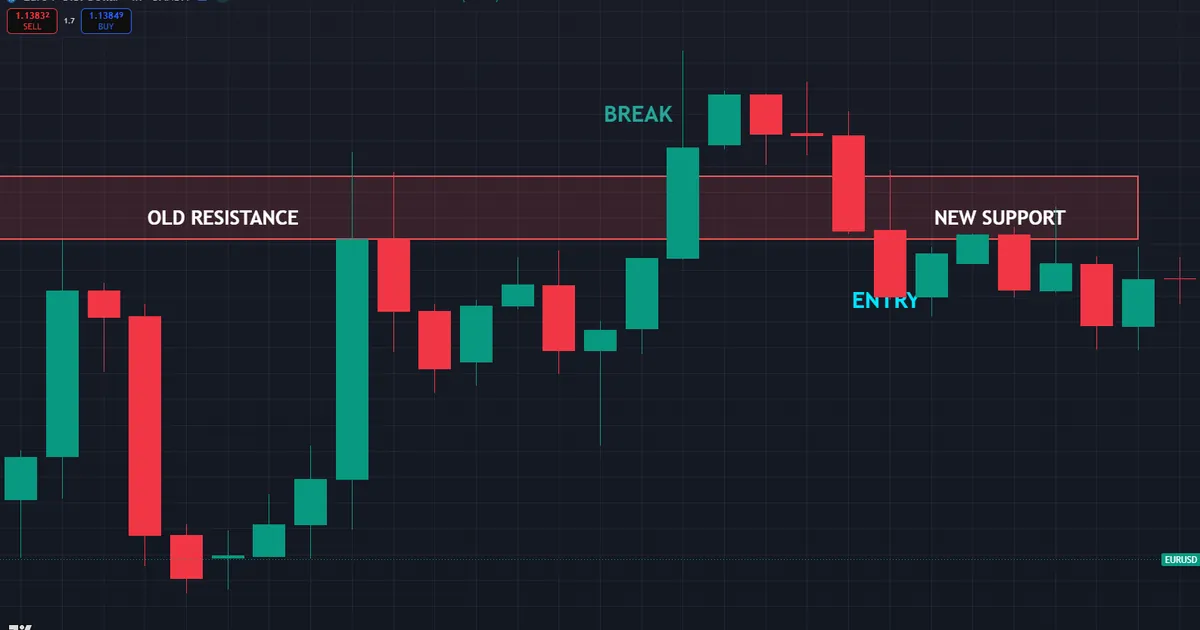
Now the trade builds itself. Price returns to the zone near 1.1455, and a bullish rejection candle shows the old ceiling acting as support. So a long on that candle carries a stop just below the zone, roughly 30 pips of risk near 1.1425. The entry rests on the flip and the reaction together.
The follow-through rewarded the read. Price bounced off the flipped zone, held above it, and pushed toward the next resistance higher up. So the role reversal gave a clean, low-risk entry in the direction of the break. That is structure doing its job as a map.
Why the Entry Made Sense
Notice how each piece supported the next. First the repeated rejections built a real resistance zone. Then the decisive break flipped it into support. Finally the rejection candle on the retest confirmed the flip. Because three reasons stacked together, the trade rested on evidence rather than hope.
Compare that with chasing the breakout candle itself. Buying the break offers a worse entry and a wider stop. Because the trader waited for the retest, the risk was small and the level was clear. So patience turned a good idea into a defined setup.
Download the complete indicator database
Put these concepts on your charts. One email unlocks the full library of 1,380+ indicators with compiled MT4 and MT5 files, plus my TradingView scripts. No paywall, no spam, unsubscribe any time.
Get free access to my indicator database
One email unlocks 1,380+ free MT4, MT5 and TradingView indicators — the complete library. No single-tool download; you get the whole database.
Common Support and Resistance Mistakes
The idea is simple, yet the same errors repeat on every timeframe. Most trace back to drawing too much or acting too soon, shown in the graphic below. So the fixes all flow from patience and a clean chart.
Drawing Too Many Levels
A chart buried in lines paralyses the trader. Every wiggle starts to look important, so none of them are. So keep three or four strong zones that price has clearly respected, and remove the rest.
Treating Zones as Exact Prices
Expecting a bounce to the exact pip invites frustration. Real levels are bands with some thickness. So draw a zone around the reactions and give price a little room to test it before you judge the outcome.
Ignoring the Higher Timeframe
A level that looks strong on the five-minute chart may be meaningless on the daily. The bigger picture sets the important zones. So mark your key levels from the higher timeframe first, then drop down to time the entry.
Acting on the First Touch
Buying the instant price reaches support ignores whether buyers actually showed up. A level can break as easily as it can hold. So wait for a rejection candle or a clear reaction before you commit to the trade.
Chasing a Break Too Early
Jumping on the first poke beyond a zone often catches a false break. Price frequently overshoots, then reverses. So wait for a decisive close beyond the level, and consider the retest for a lower-risk entry.
Forgetting to Update Zones
Old levels lose relevance as the market moves on. A zone from months ago may no longer matter. So review your chart regularly, keep the fresh and respected levels, and clear away the stale ones.
Support and Resistance Checklist
Run this short list before every entry. A few seconds here saves hours of regret later. So keep it beside the chart and let it slow your hand whenever a tempting level appears out of nowhere.
- Key zones drawn from the higher timeframe first.
- Each level backed by two or more clear reactions.
- Zones drawn as bands, not exact single lines.
- Confluence with Fibonacci or round numbers noted.
- A price-action reaction confirmed at the zone.
- Stop placed just beyond the zone, with size set from it.
- Entry, stop, and target defined before the trade goes live.
When Support and Resistance Fail
Study the failure case as hard as the winner. Here is a common one. EURUSD approaches a strong support zone near 1.1376 on the one-hour chart, and price has bounced there twice before. Every box looks ticked for a long.
Then the level gives way. Price slices straight through the zone, fails to bounce, and keeps falling with force. The chart below shows that broken support and the failed reaction.
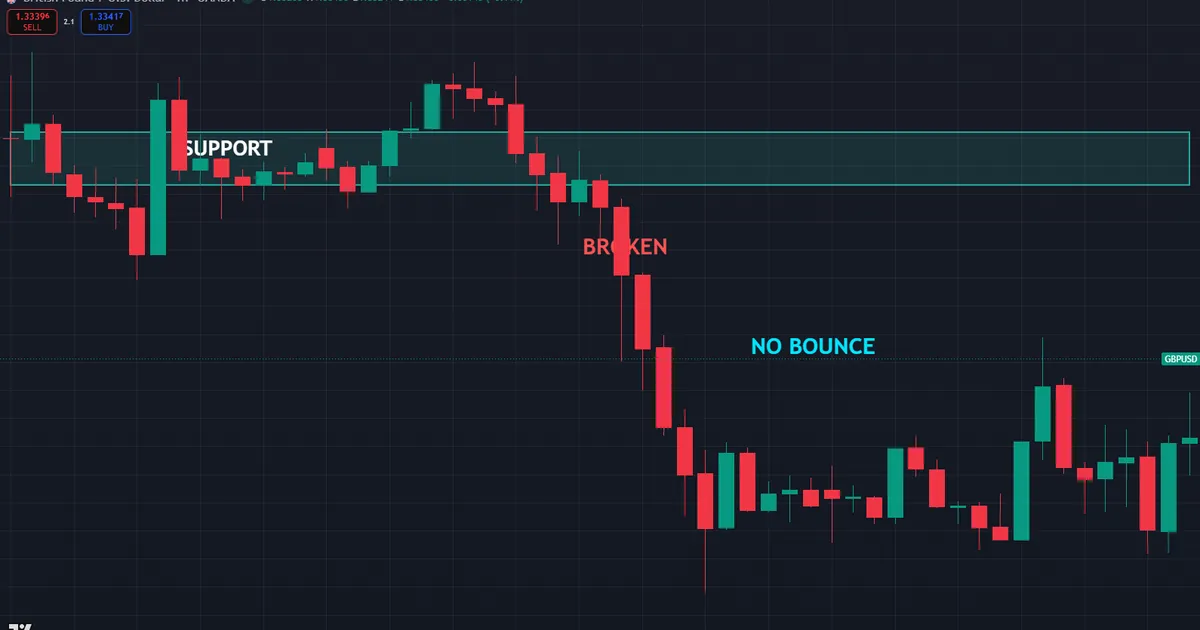
So what went wrong? Usually momentum overwhelmed the memory. A strong trend or a fresh catalyst can blow through any level, because the pressure behind price exceeds the orders defending the zone. Hence the invalidation rule that limits the damage: once price closes clearly beyond a zone with force, treat the level as broken, not as a bargain. Exit at once, without averaging down.
Strong Trends Break Levels
A powerful trend respects fewer levels than a range does. Momentum carries price through zones that would hold in calmer conditions. So in a strong trend, favour trading with the move and expect counter-trend levels to break more often.
News Overrides Structure
A high-impact release can send price straight through a zone in one candle. The level reflects past order flow, so it cannot price in a fresh shock. So a zone tested right after major news often fails, and waiting for the dust to settle protects you.
Sizing Keeps a Bad Read Small
Even a well-tested zone can break, so plan for it. Because a failed level reverses against you fast, a stop just beyond the zone caps the damage. Our free position size calculator turns that stop distance into a lot size that keeps each loss controlled. So a broken zone stays a scratch rather than a wound.
Related Concepts to Study Next
Support and resistance connect to a web of sibling tools, and a couple deserve your next reading hour. Pivots offer a formula-based version of the same idea, so our guide to pivot points shows how to map levels from yesterday’s range. Then applying Fibonacci alongside them sharpens your zones, and our guide to how to use Fibonacci retracement covers the overlap in detail.
Structure also underpins how you place stops and targets. Because a zone marks where reactions cluster, it gives you natural spots to hide a stop or aim a profit. So let the levels define your risk rather than a fixed pip count, and the trade plan writes itself.
For hands-free charting, the trend indicators archive helps you read the direction that decides whether a level holds, while the pattern recognition indicators archive flags the reactions forming at your zones. Tools speed the work, yet the structure above still carries the trade.
FAQ
What is support and resistance in simple terms?
Support is a price zone below the market where buyers tend to step in, and resistance is a zone above where sellers tend to appear. They form because traders remember where price turned before and place orders around those areas. Think of them as the market’s memory of past decisions, drawn as bands rather than exact lines.
Why does support become resistance?
When price breaks below a support zone, that zone sits above the market and often becomes resistance. Traders who bought there may sell on a return to breakeven, while new sellers defend the area from above. This role reversal is one of the most reliable patterns in structure trading, though it still needs a decisive break and a clean retest to confirm it.
How do I draw support and resistance correctly?
Start on a higher timeframe and mark the swing highs and lows where price turned sharply. Draw horizontal zones across each cluster of reactions, covering the wicks and bodies. Keep only a few strong levels so the chart stays clean and easy to read, and remove stale zones as price moves on.
Are support and resistance exact prices?
No, they are zones with some thickness rather than single lines. Price often overshoots a level by a few pips before reversing. So draw a band around the reactions and treat any move inside that band as a test of the level. Because the zone has thickness, a small poke beyond it is not automatically a break, and patience for a clear close protects you from traps.
Do support and resistance work in forex?
They do, because forex is highly liquid and many traders watch the same levels. The zones read best on higher timeframes and alongside confluence like Fibonacci or round numbers. Always wait for a price-action reaction before trading a level rather than acting on the first touch. Because so many participants watch the same round numbers and prior swings, forex structure tends to be respected cleanly on liquid major pairs.
Is support and resistance reliable on its own?
Structure maps probable zones, not certain turns, so it reads best beside other tools. Pair it with trend, confluence, and price-action confirmation for cleaner signals. Let the zones define your stops and targets, and manage risk on every trade. Results are not guaranteed; past performance is not indicative of future results.
External references
- For background on this concept, see Support at BabyPips.
- For broader market context, see Supply and Demand at Corporate Finance Institute.

About the author
Written by Dominic Walsh, a Forex trader and MT4/MT5 indicator, Expert Advisor and script developer. Every tool on forexmt4systems.com is tested on live charts before release and ships with ready-to-use compiled MT4 (.ex4) and MT5 (.ex5) files. Learn more about the trader and developer behind this site.
How we build, test and correct every tool: Editorial & Testing Policy. Trading carries risk; see the disclaimer.