
Bullish vs bearish divergence is the difference between a market quietly building strength and one quietly running out of steam. Both read the swings on price against the swings on an oscillator, and both warn you before the candles themselves turn.
This guide sets bullish vs bearish divergence side by side so you can name either one on sight. We use the Relative Strength Index on EURUSD and GBPUSD, and by the end you will read the higher low, the lower high, and know which way each pattern leans.
Traders reach for divergence because it hints early. Price often prints one last push before it turns, and the oscillator flags that weakness a few candles ahead. So the pattern buys you time, provided you read the two sides correctly.
Bullish vs Bearish Divergence at a Glance
Divergence means price and its momentum tool disagree. Price prints a fresh extreme, yet the oscillator refuses to follow. So the two lines pull apart, and that gap is the whole signal.
The two flavours sit at opposite ends of a swing. Bullish divergence forms at lows, when price carves a lower low but the oscillator lifts to a higher low. Bearish divergence forms at highs, when price stretches to a higher high but the oscillator sags to a lower high.
Look at a live read first. The chart shows EURUSD on the one-hour timeframe with the standard RSI(14). Price slides to a lower low near 1.1290 while the RSI turns up from a higher low around 34. That single frame holds the classic bullish divergence in one clean view.
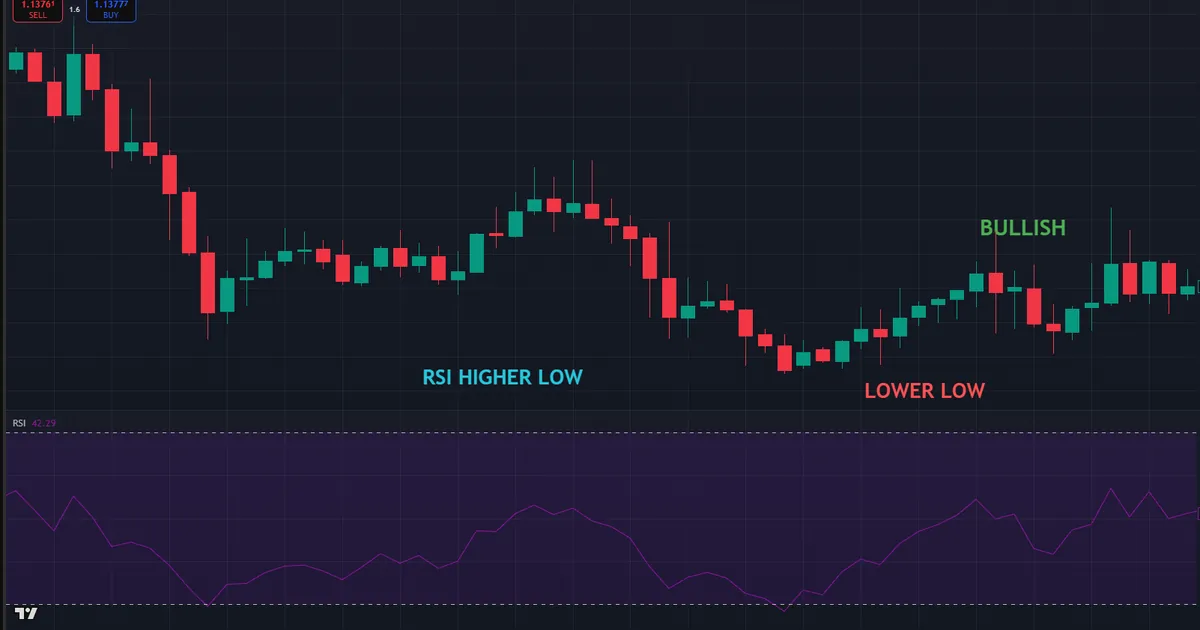
Notice what each side is telling you. Price says the downtrend still runs, since the low is lower. Momentum says the selling is thinner, since the RSI trough is higher. Because the crowd pushed price down with less force, a turn becomes more likely.
Here is the mirror case. When price grinds to a higher high but the RSI makes a lower high, buyers are spending more effort for less ground. So bearish divergence hints that an uptrend is tiring, even while the last candle still looks strong.
Why Momentum Leads Price
Momentum measures the speed of a move, not its position. So as a trend matures, the pace usually cools before the price itself rolls over. The RSI captures that cooling early, which is why its peaks and troughs can drift while price still pushes on.
Think of a car braking before a red light. The wheels still roll forward, yet the speed is already dropping. Divergence catches that same fading speed on the chart. Because momentum leads, the oscillator can warn you a few candles before the reversal shows in price.
Still, early does not mean certain. A cooling trend can reheat and run again, so the lead time is a heads-up rather than a trade by itself. Treat the divergence as the first clue, then let a trigger confirm that the turn has truly begun.
How Each Pattern Is Built
Both patterns share one engine, so learn it once and flip it for each side. Four ingredients define every divergence you will ever mark.
- Two swing points on price. Mark two adjacent lows for bullish, or two adjacent highs for bearish. They must be clear pivots, not tiny wiggles.
- The matching swings on the oscillator. Read the RSI value under each price pivot. These two readings decide whether momentum agrees or disagrees.
- The direction of disagreement. Bullish needs price lower but oscillator higher. Bearish needs price higher but oscillator lower.
- A trigger to act. Divergence is a warning, not an entry. Wait for a break of structure or a candle signal before you commit.
So the pattern is a simple comparison, repeated at every swing. The table below lays the two sides against each other so the contrast stays sharp.
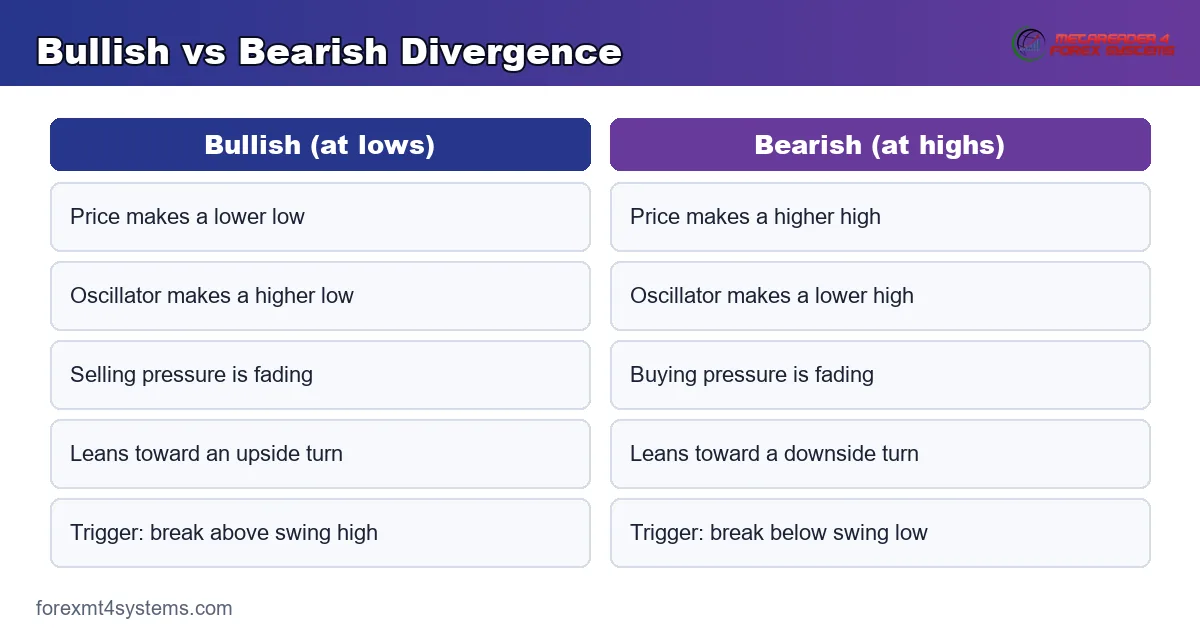
| Feature | Bullish Divergence | Bearish Divergence |
|---|---|---|
| Forms at | A market low | A market high |
| Price makes | A lower low | A higher high |
| Oscillator makes | A higher low | A lower high |
| Hidden message | Selling is fading | Buying is fading |
| Leans toward | An upside turn | A downside turn |
| Common trigger | Break above the last swing high | Break below the last swing low |
Read the table row by row and the symmetry pops out. Every bullish trait has a bearish twin, flipped top for bottom. Because the logic mirrors itself, one mental model covers both ends of the chart.
Regular Versus Hidden
The version above is regular divergence, which hints at a reversal. There is also hidden divergence, which hints at a continuation instead. So the same tool speaks two dialects, and the swing you compare tells you which.
Regular bullish reads price lower low against oscillator higher low. Hidden bullish flips one half, reading price higher low against oscillator lower low inside an uptrend. Our companion guide on hidden divergence walks that continuation case in full, so keep the two families separate as you learn.
Bullish Divergence in Detail
Bullish divergence is the bottom-side signal, and it forms while price still falls. The last leg down carves a fresh low, yet the RSI trough sits higher than the one before it. So sellers pushed price lower with less momentum behind the move.
Picture EURUSD sliding into a support shelf near 1.1280. The first swing low reads an RSI of 26, deeply oversold. Then price drifts a touch lower while the RSI only reaches 34 on the next dip. Because the second trough is shallower, the selling looks tired despite the lower price.
That gap sets up a long, but only with proof. Wait for price to break the small swing high between the two lows, or for the RSI to climb back above 30. Then place the stop under the fresh low, since a deeper low would say the sellers were not finished after all.
Bearish Divergence in Detail
Bearish divergence is the top-side signal, and it forms while price still rises. The last leg up stretches to a fresh high, yet the RSI peak lands lower than the one before it. So buyers pushed price higher with less momentum in the tank.
Picture GBPUSD grinding up toward 1.3520. The first swing high tags an RSI of 74, firmly overbought. Then price edges to a new high while the RSI only reaches 66. Because the second peak is weaker, the rally looks stretched even as the last candle prints green.
That gap sets up a short, again with proof. Wait for price to break the small swing low between the two highs, or for the RSI to slip back under 70. Then set the stop above the fresh high, since a higher high would invalidate the tiring-buyer read entirely.
Fitting Divergence Into a Workflow
Settings come first, and simpler is safer. Stick with the default RSI(14) and the 70/30 lines until the reads feel natural. Because a stable window keeps your swing readings honest, resist the urge to tinker mid-session.
Timeframe choice shapes the signal quality. On the one-hour and four-hour charts, divergence has room to breathe and fewer false pivots appear. Meanwhile the one-minute and five-minute charts throw so many micro-swings that the pattern loses meaning fast.
Pairing lifts the hit quality further. Divergence points to a zone, so let structure confirm the timing. A bullish divergence into a known support shelf is far cleaner than one floating in open space, and our note on support and resistance shows how to map those shelves.
Also decide in advance what counts as a trigger. Some traders wait for the RSI to cross back through 30 or 70. Others wait for a market-structure break on price. Either rule works, provided you pick one and apply it the same way every time.
Which Oscillator to Use
RSI is the common choice, yet it is not the only one. The MACD histogram and the Stochastic show divergence just as clearly, and each has its fans. Still, mixing three tools at once muddies the read, so start with one and add others only when a single tool feels thin.
For a broader momentum toolkit, the momentum indicators archive collects these oscillators in one place. Learn the divergence logic once, then apply it to whichever tool you trust most.
A Worked Example on GBPUSD
Now trace a full bearish case from setup to exit. The chart shows GBPUSD on the one-hour timeframe during an uptrend near 1.3500. Price prints a double top near 1.3510, roughly level with the earlier peak, then the RSI makes a clear lower high around 66 after tagging 72 on that first push.
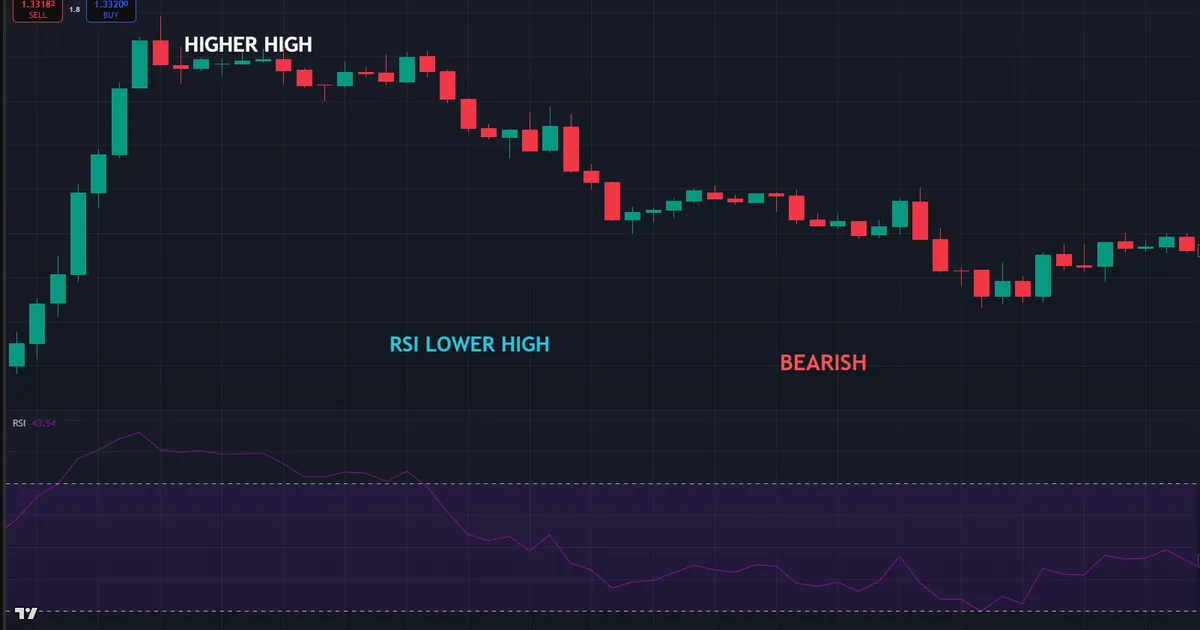
Walk the read step by step. First price made the higher high, so the trend still looked healthy on the surface. Then the RSI refused to match it, sagging to a lower peak. Because momentum lagged the price, the bearish divergence flagged tiring demand.
Reading the Trade Step by Step
The trigger came next. A candle closed back below the prior swing low, which broke the short-term structure. So the warning became a signal, and a short entry sat just under that broken level with a stop above the 1.3510 high.
Follow-through rewarded the patience. Price rolled over, slid back toward the 1.3440 area, and the falling RSI confirmed the shift. Meanwhile the invalidation stayed simple, since a push back above the high would have killed the idea outright.
Notice how each piece supported the next. The double top set the stage. The lower RSI high exposed the weakness. Finally the structure break named the entry and the stop. Because the tool framed every stage, the trader never had to guess.
Compare that clean read with a rushed one. A trader who shorted the instant the lower RSI high appeared would have sat through several more green candles first. So the wait for the structure break cost a little upside but removed most of the guesswork. That trade-off sits at the heart of patient divergence trading.
Also weigh the reward against the risk before you commit. The stop above 1.3510 was tight, and the first target near 1.3440 gave a clean move to work with. Because the level was close and the target was real, the setup earned its place rather than forcing a marginal trade.
Download the complete indicator database
Put these concepts on your charts. One email unlocks the full library of 1,380+ indicators with compiled MT4 and MT5 files, plus my TradingView scripts. No paywall, no spam, unsubscribe any time.
Get free access to my indicator database
One email unlocks 1,380+ free MT4, MT5 and TradingView indicators — the complete library. No single-tool download; you get the whole database.
Common Mistakes and How to Fix Them
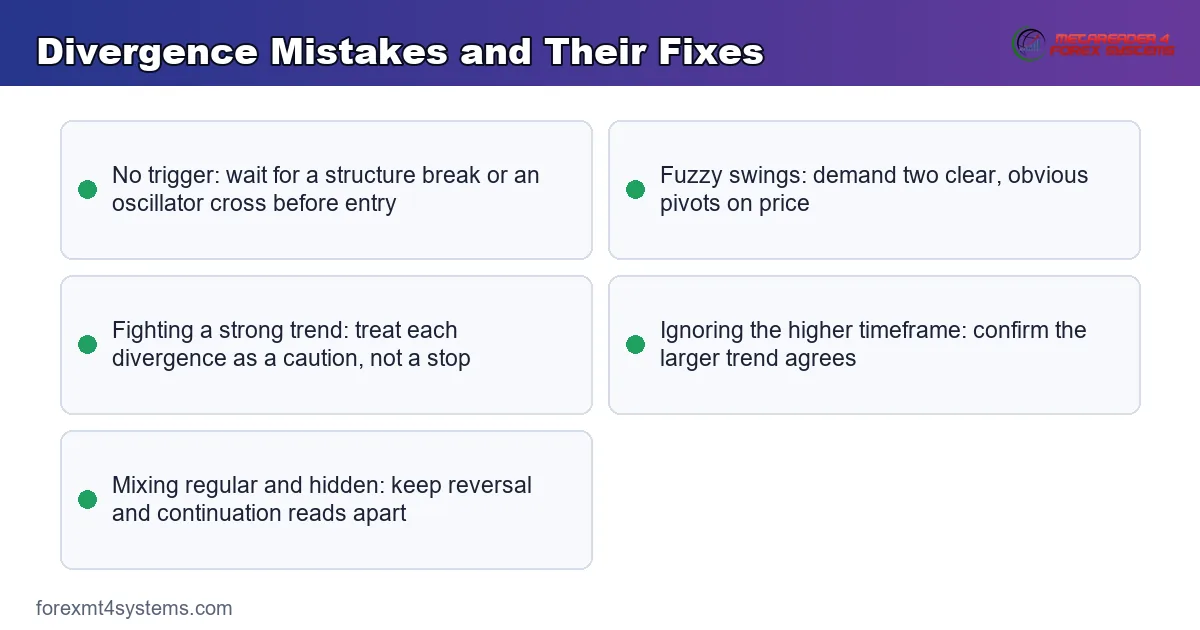
The pattern reads simply, yet the same errors repeat across every pair. Most trace back to acting on the disagreement alone, without a trigger or a level. The graphic below sorts the healthy read from the trap.
Trading Divergence Without a Trigger
Divergence can persist for many candles before price turns, and sometimes it simply fades. So entering the moment you spot it invites a slow bleed against your stop. Fix it by waiting for a structure break or an RSI cross before you commit a single lot.
Marking Fuzzy Swing Points
A divergence is only as clean as the pivots behind it. Vague, overlapping swings produce imaginary signals that vanish under scrutiny. Instead demand two obvious highs or lows, spaced far enough apart that anyone would mark them the same way.
Fighting a Powerful Trend
Regular divergence bets against the current move, which is dangerous in a strong run. A single bearish divergence rarely stops a freight-train uptrend on the first try. Because trends can print several divergences before topping, treat each one as a caution flag, not a stop sign.
Ignoring the Higher Timeframe
A bullish divergence on the five-minute chart means little if the daily trend points hard down. So check the bigger picture before you trust a small-timeframe signal. When the higher timeframe agrees, the divergence carries far more weight.
Confusing Regular With Hidden
Traders often mark a continuation setup and trade it as a reversal, or the reverse. That single mix-up flips the expected direction. Keep the definitions straight, and lean on our guide to divergence in trading whenever the labels blur.
A Simple Divergence Checklist
Run this short list before you act on any divergence, bullish or bearish.
- Name the type. Confirm whether price and the oscillator disagree the bullish way or the bearish way.
- Check the swings. Make sure both pivots are clean and obvious, not tiny wiggles.
- Find a level. Look for support under a bullish read or resistance above a bearish one.
- Read the higher timeframe. Confirm the larger trend does not fight your idea outright.
- Wait for the trigger. Take the trade only after a structure break or an oscillator cross.
- Size the risk. Set the stop beyond the swing, then let a position size calculator fix the lot.
Work the list top to bottom and most weak signals filter themselves out. Because each step demands proof, the ones that survive tend to be the ones worth trading.
When Divergence Fails
No pattern is a promise, and divergence fails often enough to respect. The most common failure is a strong trend that simply absorbs the signal and keeps running.
Picture a EURUSD downtrend near 1.1300. Price prints a lower low, the RSI lifts to a higher low, and the bullish divergence looks textbook. Then price barely bounces, rolls over, and slices to a fresh low while the divergence quietly evaporates.
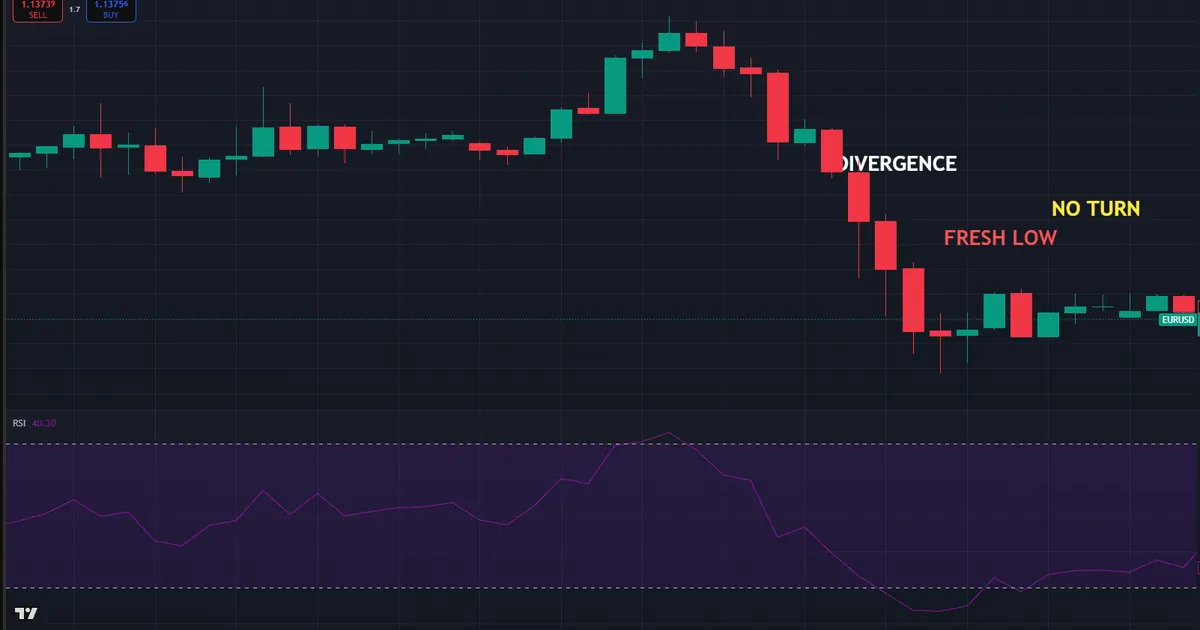
So what went wrong? The trend was too strong for a single counter-signal, and there was no support shelf to catch the bounce. Because the trader entered on the disagreement alone, the trap sprang with no level to lean on.
Here is the calmer way to handle it. First demand a structure break, not just the divergence. Then place the stop beyond the swing so a failure costs little. Because the risk stayed small, the failed read was a scratch rather than a wound.
News can also break the pattern in an instant. A surprise print sends price and momentum in the same direction, wiping any prior disagreement off the chart. So step aside around scheduled releases and let the calm return before you trust the read again.
Watch for exhaustion at round numbers too. Price often stalls near big figures, so a divergence there can look convincing yet still fail if the level does not hold. Because a false break through a round number traps both sides, wait for a clean candle close before you act on the signal. That single pause filters many of the fakes that punish eager traders near obvious levels.
How Reliable Is Divergence
Honesty matters more than hype here. Divergence is a context tool, not a crystal ball, and it shines brightest at the end of stretched moves. So its value rises when a trend has run far and the momentum is clearly cooling.
Reliability climbs when several factors line up. A divergence at a major support or resistance level beats one in open space. A divergence that agrees with the higher timeframe beats one that fights it. Because each layer of confluence filters noise, stacked signals simply hold up better.
Reliability drops in choppy, directionless markets. When price chops sideways, the oscillator whips back and forth and prints divergences that lead nowhere. So a ranging chart is the worst place to lean on the pattern, and patience serves you better than forcing a read.
Set Honest Expectations
Every method has losing trades, and divergence is no exception. Some setups fail, some stall, and some run for a clean profit. Because outcomes vary, the edge lives in repeating a sound process with tight risk, not in chasing any single perfect signal.
Keep a record so the pattern earns your trust over time. A short log of each divergence trade, its context, and its result shows you which conditions suit your style. Our trade journal gives you a simple place to track that, and the data beats a hunch every time.
Related Concepts to Study Next
Divergence connects to a web of momentum ideas, and two deserve your next reading hour. To turn these signals into a full plan, read our walkthrough on how to trade divergence, which covers entries and exits in depth. Meanwhile the continuation cousin sits in our RSI divergence guide, which drills into the RSI reads specifically.
For automated help, the oscillator indicators archive plots RSI, Stochastic, and MACD so the swings stay easy to compare. Tools speed the marking, yet the bullish-versus-bearish logic above still carries the trade.
FAQ
What is the main difference between bullish and bearish divergence?
Bullish divergence forms at a low, where price makes a lower low but the oscillator makes a higher low, hinting at an upside turn. Bearish divergence forms at a high, where price makes a higher high but the oscillator makes a lower high, hinting at a downside turn.
Which indicator works best for spotting divergence?
The RSI is the most popular choice because its swings are easy to read against price. The MACD histogram and the Stochastic also work well. Start with one tool, since stacking several at once tends to muddy the signal rather than sharpen it.
Does divergence always lead to a reversal?
No, and that is a key point to remember. Divergence flags fading momentum, not a certain turn. A strong trend can print several divergences before it finally reverses, so always wait for a trigger and a supporting level before you act.
What timeframe is best for divergence?
The one-hour and four-hour charts tend to give the cleanest reads, since their swings are clear and their pivots hold. Very fast charts, like the one-minute, produce too many micro-swings and far more false signals.
How do I confirm a divergence before trading it?
Wait for a trigger after the pattern appears. A break of market structure or an oscillator cross back through 30 or 70 both work. Add a nearby support or resistance level for context, and the signal becomes far more reliable.
Can I use divergence on its own?
You can spot it alone, but you should not trade it alone. Divergence reads best beside structure, a trend map, and firm risk control. Manage risk on every trade. Results are not guaranteed; past performance is not indicative of future results.
External references
- For background on this concept, see Divergence at Corporate Finance Institute.
- For broader market context, see Convergence at BabyPips.

About the author
Written by Dominic Walsh, a Forex trader and MT4/MT5 indicator, Expert Advisor and script developer. Every tool on forexmt4systems.com is tested on live charts before release and ships with ready-to-use compiled MT4 (.ex4) and MT5 (.ex5) files. Learn more about the trader and developer behind this site.
How we build, test and correct every tool: Editorial & Testing Policy. Trading carries risk; see the disclaimer.