
The ICT unicorn model is a high-confluence entry that stacks a breaker block on top of a fair value gap. When those two zones overlap, the shared area becomes a precise pocket to enter a reversal. So the setup trades one level that carries the weight of two separate concepts.
This guide shows you how to build the ICT unicorn model step by step, how to grade the overlap, and how to set the stop and target around it. By the end, you will be able to spot the confluence in real time and know exactly when the zone is clean enough to trade. You will also work through two examples in both directions and learn the single rule that voids the trade.
What Is the ICT Unicorn Model?
The ICT unicorn model is a confluence setup built from the teachings of Michael Huddleston, the Inner Circle Trader. It marries two of his tools. A breaker block marks a failed order block that flips polarity after structure breaks. A fair value gap marks a three-candle imbalance left by fast, one-sided delivery. When the breaker and the gap sit on the same price band, that overlap is the unicorn.
The name fits the idea. A clean overlap of both tools is uncommon, so traders treat it as a special, higher-quality signal than either zone alone. Rather than pick between a breaker entry and a gap entry, you wait for the rare moment they agree. That agreement narrows the entry to a tight band and tightens the stop with it. The chart below shows a bullish unicorn on GBPUSD with the breaker and the gap marked.
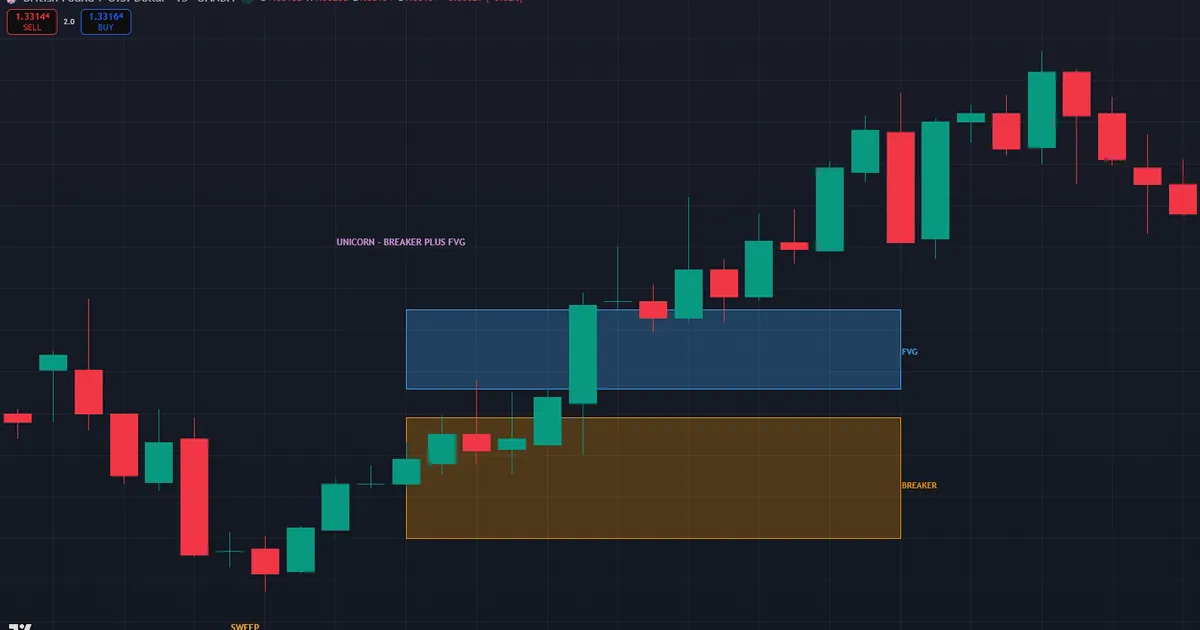
Trace the frame from left to right. On the GBPUSD fifteen-minute chart from June 24, 2026, price first set a swing high at 1.33758 and a swing low at 1.33700. Then a wick swept below the low to 1.33674, grabbing the sell-side liquidity resting there. Next, a burst of displacement drove up through the 1.33758 high, breaking structure and leaving a fair value gap between 1.33772 and 1.33810. The bullish breaker sat just beneath, from 1.33700 to 1.33758. So the two zones stacked on the same band between 1.33700 and 1.33810, and that pocket became the unicorn entry.
Why the Overlap Adds an Edge
Two independent reasons to enter beat one. A breaker alone can fail, and a gap alone can be run straight through. Yet when both mark the same band, price has to respect two forms of institutional footprint at once. So the overlap filters out many of the weak entries each tool produces on its own. This is why the unicorn zone is usually smaller and cleaner than a plain breaker or a plain gap.
How the Unicorn Forms Step by Step
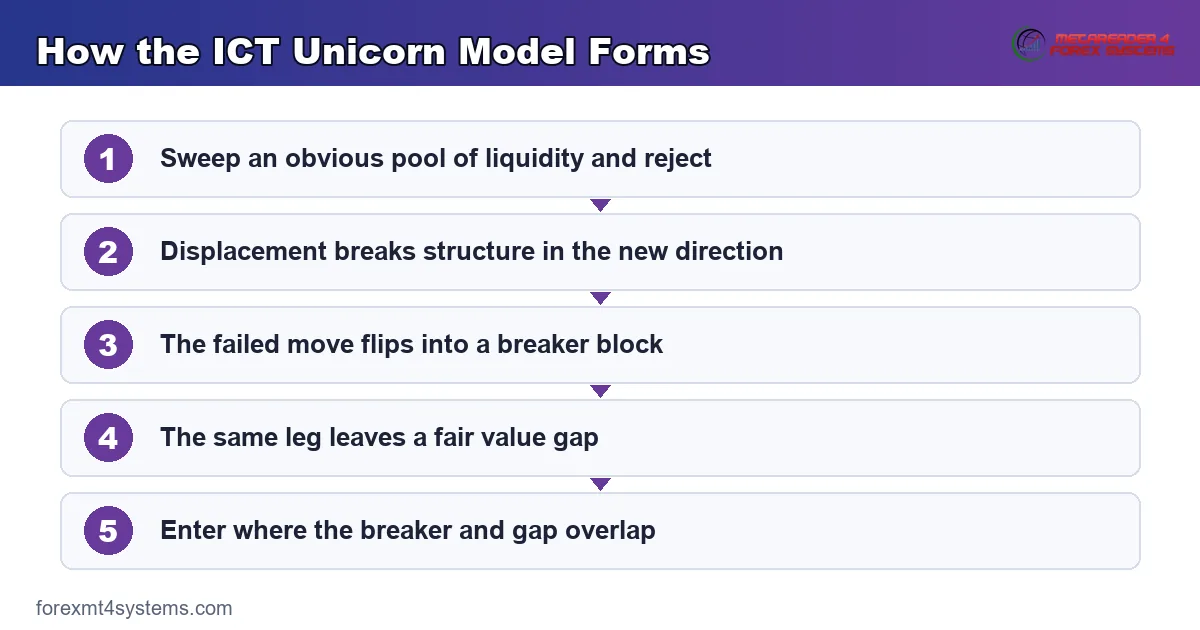
The setup builds in a fixed order, and each step depends on the one before it. Work through the numbered sequence below until it feels automatic.
- Liquidity sweep. Price raids an obvious high or low, grabbing the stops resting beyond it before rejecting.
- Displacement and structure break. A sharp, full-bodied move drives back through the last swing point, shifting market structure.
- Breaker block forms. The candles of the failed move flip polarity, so the old supply becomes support, or old demand becomes resistance.
- Fair value gap appears. The same displacement leg leaves a three-candle imbalance behind it.
- Overlap becomes the entry. Where the breaker and the gap share price, that narrow band is the unicorn pocket.
Only when all five align do you have a genuine unicorn. The branded graphic below turns this sequence into a single reference card you can keep beside your charts while the pattern is still new.
Grading the Breaker and the Gap
The quality of each ingredient decides the quality of the overlap. A breaker block earns respect when it formed at a clear swing that was swept, so our guide to the breaker block walks through spotting a valid one. The gap earns respect when the displacement that made it was fast and full-bodied. For the distinction between these zones and plain order blocks, our comparison of the fair value gap versus the order block lays out the precise differences.
Where the Unicorn Sits in the SMC Workflow
The unicorn is an execution tool, so it needs a directional frame around it. Start on the higher timeframes and work down. This top-down flow keeps you from trading a clean overlap straight into a strong opposing trend.
First, set bias from the daily and four-hour charts. A bullish daily draw on liquidity means you hunt bullish unicorns, so you only trade overlaps that form after a sweep of a low. Second, mark the pool the market is likely reaching toward, since that pool becomes your target. Then drop to the five-minute or fifteen-minute chart and wait for the sequence to appear inside an active session.
The context around the overlap matters as much as the overlap itself. A unicorn that forms right at a daily high or low carries far more weight than one floating in the middle of a range. So read where the setup sits before you grade its quality. The same tight overlap can be a gift near a major level and a trap in no-man’s-land. Truly, the best unicorns tend to appear at the edges of the higher-timeframe range, where the draw on liquidity is clear.
The structure break is the pivot of the whole setup, and our guide to the market structure shift details the validity checklist for that step. Session timing sharpens the read further. Most clean unicorns print during London from 02:00 to 05:00 or the New York morning from 08:30 to 11:00 New York time, when displacement is most likely to appear.
Sizing the Trade From the Tight Stop
The overlap gives you an unusually tight stop, which is one of the setup’s real advantages. So place the stop just beyond the swept extreme, not beyond the whole zone. A smaller stop lets you size the position sensibly while keeping the same account risk. Our position size calculator turns that stop distance into a precise lot figure in seconds, which keeps every unicorn trade inside the same risk budget.
Understanding the Breaker Half of the Overlap
The breaker block is the ingredient traders misread most, so slow down on it. A breaker is a failed order block. When an order block fails to hold and price breaks structure through it, that same zone flips polarity and starts to work in the opposite direction.
Picture the bullish case first. Price forms a swing low, then a small rally, then a deeper push that sweeps below the low. Those down-close candles at the old low would normally be a bullish order block. Yet price broke below them before reversing, so they failed. When displacement then drives back up through structure, that failed zone becomes a bullish breaker and offers support on the return. So the breaker marks where the failed sellers are trapped and forced to cover.
Why the Breaker and Gap Land Together
The overlap is not luck; it follows from the same move. The displacement leg that flips the order block into a breaker is the very leg that leaves the fair value gap. So both zones are children of one violent push through structure. That shared origin is why they so often sit on nearly the same band. When they do line up tightly, you get the unicorn, and when the leg is messy, the zones drift apart and the setup weakens.
Bearish Breakers Mirror the Logic
Flip every step for a short. Price forms a swing high, a small dip, then a push that sweeps above the high. Those up-close candles at the old high would be a bearish order block, yet price broke above them before reversing. When displacement drives back down through structure, that failed zone becomes a bearish breaker and offers resistance on the return. So the same trapped-trader logic applies, only in the opposite direction.
Worked Example: A Bullish Unicorn on GBPUSD
Return to the GBPUSD sequence and trade it in full, step by step. Price holds above a rising daily draw on liquidity, so the bias favors longs. The plan is to buy the overlap after a sweep of the swing low.
Price sweeps below the 1.33700 low to 1.33674, grabbing sell-side liquidity, then rejects sharply. Next, displacement drives up through the 1.33758 swing high, breaking structure to the upside. That leg leaves a fair value gap from 1.33772 to 1.33810, and the bullish breaker sits from 1.33700 to 1.33758. So the breaker and gap stack on the same band from 1.33700 to 1.33810, and the entry prints there near 1.33765. The stop rests below the 1.33674 sweep low, roughly 9 pips of risk.
The target comes from the opposing pool. Buy-side liquidity rests above the prior high at 1.33934, so that becomes the objective. Price retraces into the zone, rejects cleanly, and delivers up toward the pool through the New York morning. From entry to target the trade offered about 17 pips of reward against 9 of risk. So even a partial fill kept a healthy ratio, and the invalidation never moved off the sweep low.
Watch the first touch of the overlap for confirmation. Price wicked into the 1.33700 to 1.33810 band and rejected within two candles, which is exactly the reaction the setup wants. A slow, grinding tap would have warned that the daily draw might disagree. So the crisp rejection here was a green light, not a formality. Reading that first reaction well is a skill worth drilling on replayed charts before you risk live capital.
Download the complete indicator database
Put these concepts on your charts. One email unlocks the full library of 1,380+ indicators with compiled MT4 and MT5 files, plus my TradingView scripts. No paywall, no spam, unsubscribe any time.
Get free access to my indicator database
One email unlocks 1,380+ free MT4, MT5 and TradingView indicators — the complete library. No single-tool download; you get the whole database.
Worked Example 2: A Bearish Unicorn on EURUSD
Now flip the direction and walk a bearish case. EURUSD trades below a falling daily draw on liquidity, so the bias points down. The plan is to sell the overlap after a sweep of a high. The chart below marks the sweep, the breaker, and the gap.
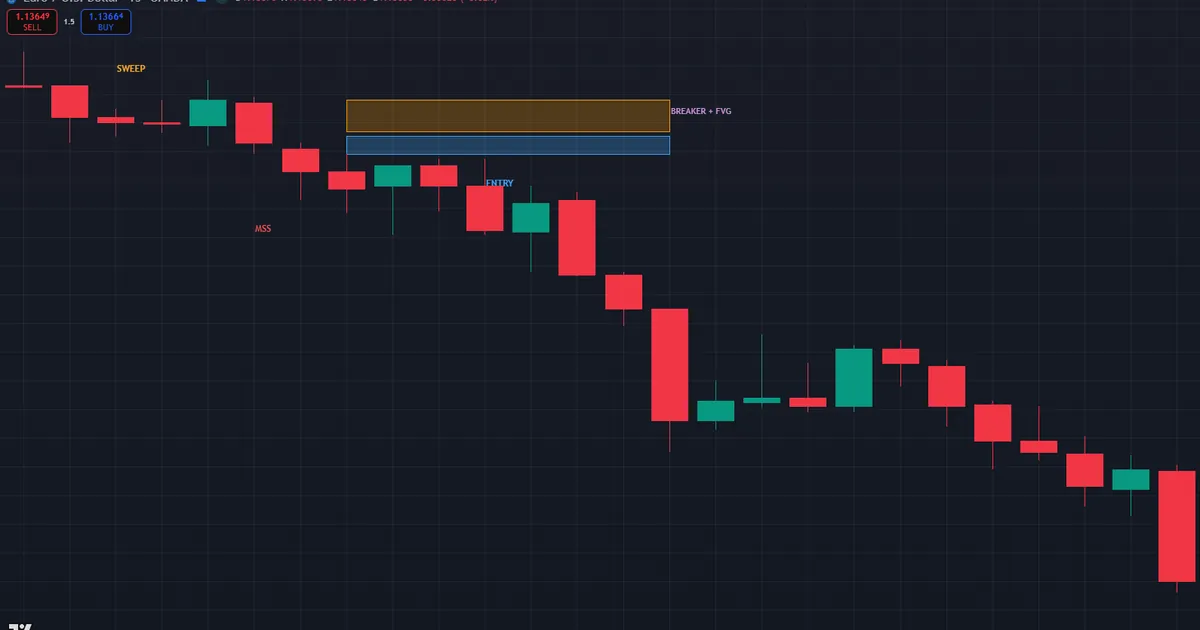
Price rallies into the London session and sweeps above the prior high at 1.14316 to 1.14330, grabbing buy-side liquidity. Then a sharp bearish leg drives down through the last swing low at 1.14284, breaking structure lower. That displacement leaves a fair value gap from 1.14291 to 1.14278, and the bearish breaker sits from 1.14316 to 1.14294. So the zones stack between 1.14316 and 1.14278, and the entry prints there near 1.14285. The stop rests above the 1.14330 sweep high, about 5 pips of risk.
The objective is the sell-side liquidity beneath the day’s low at 1.1368. So the trade holds toward that pool as the New York session expands lower. Price retraces into the zone, rejects, and delivers down cleanly to the pool. Only the direction changed from the bullish example; the five steps stayed identical. Notice again how the sweep funds the move and the overlap defines the entry.
The reward-to-risk math held up here too. From entry near 1.14285 to the pool at 1.1368, the trade offered about 60 pips of reward against 5 of risk. So the setup cleared the sensible floor of roughly two units of reward for each unit of risk. Management stayed personal from there, whether banking the full move at the pool or scaling out in pieces. Yet the plan never changed once the overlap was drawn.
Common Mistakes and How to Fix Them
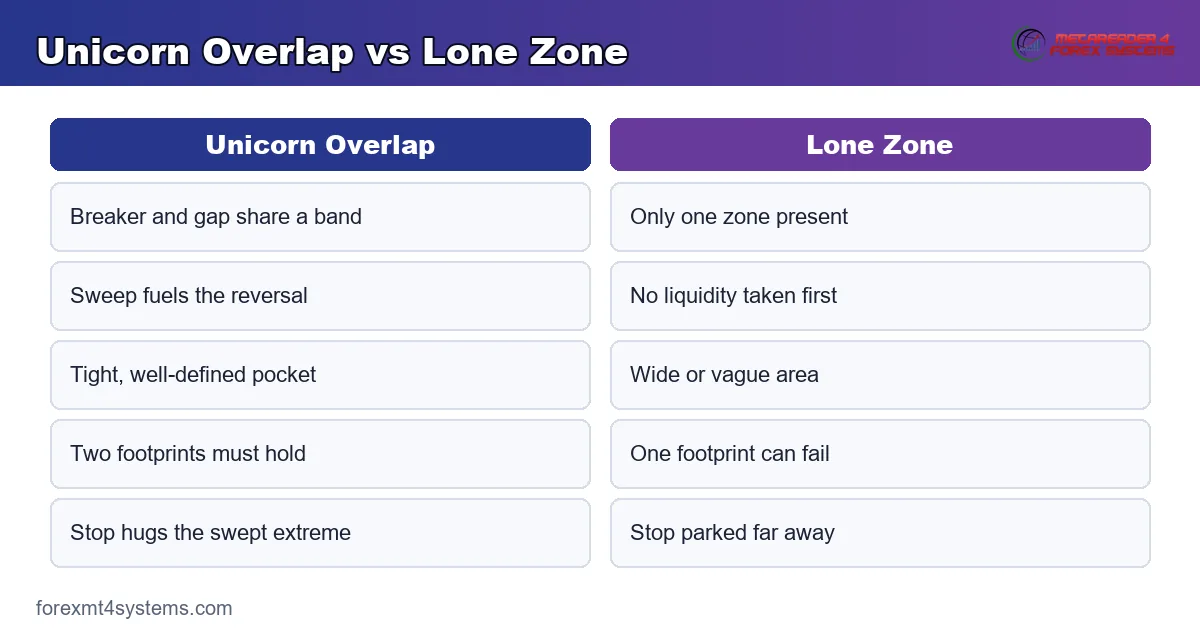
The setup is precise, yet the same errors recur. The graphic below collects the four traps we see most, and the fixes follow beneath it.
Trading a breaker without a gap
A breaker with no overlapping fair value gap is not a unicorn; it is just a breaker. So resist the urge to force the label onto a lone zone. The whole edge comes from the two tools agreeing on the same band, and a solo breaker simply does not qualify.
Ignoring the sweep requirement
Both a valid breaker and a strong displacement leg start with a liquidity raid. Instead of entering an overlap that formed with no prior sweep, wait for the raid that fuels the reversal. Overlaps born without a sweep fail far more often.
Placing the stop too wide
The tight overlap is the setup’s advantage, so a stop parked far beyond the zone throws that advantage away. Rather than pad the stop, set it just beyond the swept extreme. If that feels too tight, the setup itself is probably not clean enough to trade.
Fighting the higher timeframe
A five-minute bullish unicorn against a strong daily downtrend usually delivers only a shallow bounce. Always confirm that the overlap direction agrees with the daily draw on liquidity before you commit any risk.
Quick-Reference Checklist
Run this list before every entry. A few seconds here keeps you honest about whether the overlap is real. Treat any missing item as a reason to pass.
- Higher-timeframe bias marked on the daily and four-hour charts.
- A clear liquidity pool set as the target before entry.
- A sweep of an obvious high or low printed and rejected.
- Displacement broke structure and left a fair value gap.
- A valid breaker block formed at the swept swing.
- The breaker and the gap overlap on the same price band.
- Stop planned just beyond the swept extreme, target at the opposing pool.
Honest Limitations: When the Unicorn Fails
Study the failure case as hard as the success case. Here is a common one. EURUSD sweeps a high, shifts structure down, and prints a tidy overlap of breaker and gap. Every step ticks. Then price retraces into the overlap and slices straight through it. It closes back above the swept high near 1.14292 and runs toward 1.14356, leaving the short stranded. The chart below shows that failure, with the reclaimed high marked.
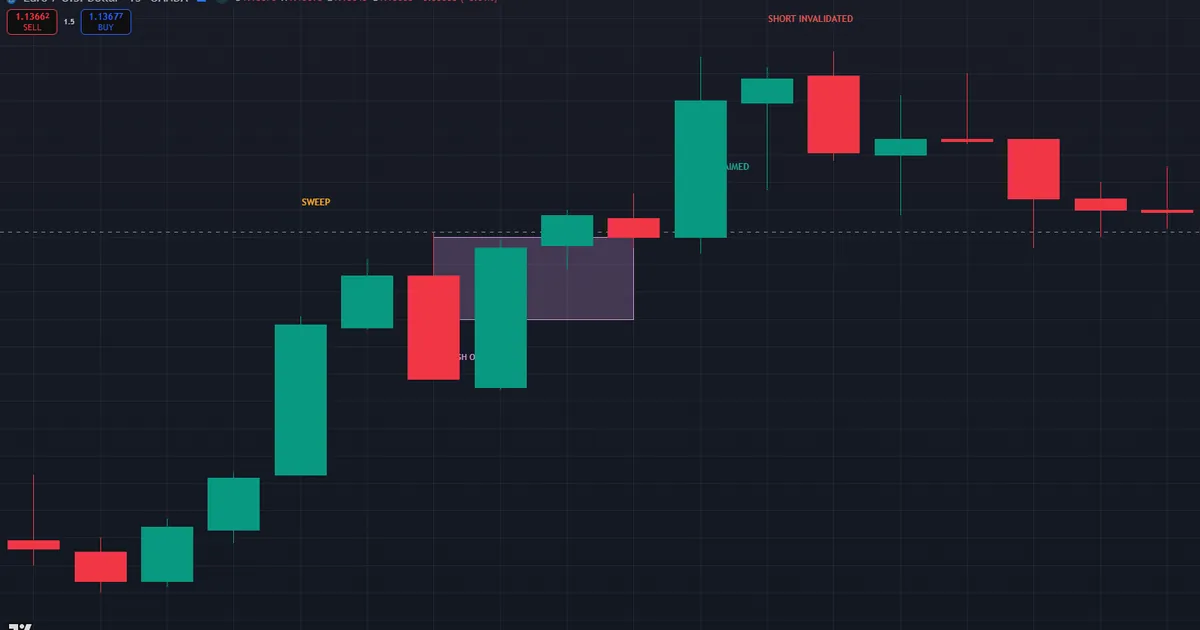
What went wrong? Usually the higher timeframe. In this case the daily draw still pointed up, so the intraday short fought the dominant flow. The market treated the whole bearish leg as a discount to buy. Hence the invalidation rule that limits the damage. Once a candle body closes back beyond the swept extreme, the unicorn is void. Exit at once, without widening the stop or hoping for a second push.
When the Zones Barely Overlap
Sometimes the overlap is the weak link. A breaker and a gap that share only a pip or two form a fragile pocket that price can slip past without a real reaction. So demand a meaningful overlap, not a token one. Truly, the tightest, cleanest unicorns show a clear shared band where both tools plainly agree, and those are the ones worth waiting for. So measure the overlap before you commit, and pass on any pocket too thin to trust.
Journaling Every Trade
Then log the trade while the details stay sharp. Note the pair, the session, the higher-timeframe state, and how wide the overlap ran. Also record whether the sweep was clean and how price reacted on first touch of the zone. Review a few dozen entries and a pattern appears. Failed unicorns cluster in ranging conditions, counter-trend contexts, and thin sessions. That written record turns each loss into tuition rather than pure cost.
No Fixed Success Rate Exists
Be blunt about this point. No reliable success percentage exists for the unicorn model, and anyone quoting one is guessing. Outcomes depend on your bias, your session filters, and your discipline around the sweep and overlap. Qualitatively, unicorns that follow a clean sweep and align with the daily draw hold up far better than counter-trend attempts. That direction of effect is the only honest claim worth making.
Related Concepts to Study Next
The unicorn shares its skeleton with a broader sequence, and one sibling deserves your immediate attention. The ICT 2022 model runs the same sweep, shift, and gap chain without requiring the breaker overlap, so our guide to the ICT 2022 model shows the simpler cousin of this setup. For the imbalance side, the complete guide to fair value gap trading deepens your read of the gap, while the order block trading guide covers the zones that become breakers. To automate the overlap detection, the dedicated ICT unicorn indicator plots the breaker and the gap for you, and the wider library of ICT indicators for MT4 and MT5 covers the sweep and shift around it. Master the breaker, the gap, and the overlap together, and the unicorn stops feeling rare and starts feeling readable.
FAQ
What is the ICT unicorn model in simple terms?
It is a confluence entry where a breaker block and a fair value gap overlap on the same price band. That shared pocket becomes a precise, high-quality entry for a reversal. The name reflects how uncommon a clean overlap of both tools is.
How is the unicorn different from the 2022 model?
Both start with a sweep, a structure shift, and a fair value gap. The unicorn adds one requirement: a breaker block must overlap the gap. So every unicorn is a 2022-style setup, but not every 2022 setup includes the breaker overlap.
Where do you enter the unicorn model?
You enter inside the band where the breaker block and the fair value gap overlap. That overlap is usually tighter than either zone alone, which allows a smaller stop. Place the stop just beyond the swept extreme that started the sequence.
What timeframe suits the unicorn model?
Most traders set bias on the daily and four-hour charts, then execute on the five-minute or fifteen-minute chart. Lower timeframes reveal the sweep, shift, breaker, and gap most clearly. Still, keep higher-timeframe context in view to avoid counter-trend traps.
What invalidates the ICT unicorn model?
A candle body closing back beyond the swept extreme cancels the setup. That reclaim signals the reversal failed and price is likely to continue the original way. Exit immediately rather than widening the stop or waiting for a rescue.
Is the unicorn model reliable enough to trade alone?
No single setup should stand on its own. Pair it with higher-timeframe bias, strict risk control, and honest journaling before relying on it. Always manage risk on every trade. Results are not guaranteed; past performance is not indicative of future results.
External references
- For background on this concept, see Confluence at Investopedia.
- For broader market context, see Confluence on Wikipedia.

About the author
Written by Dominic Walsh, a Forex trader and MT4/MT5 indicator, Expert Advisor and script developer. Every tool on forexmt4systems.com is tested on live charts before release and ships with ready-to-use compiled MT4 (.ex4) and MT5 (.ex5) files. Learn more about the trader and developer behind this site.
How we build, test and correct every tool: Editorial & Testing Policy. Trading carries risk; see the disclaimer.