
A dial pointing at extreme fear makes an excellent headline. It also says very little about the next hour in currencies.
The fear and greed index meaning is narrower than most coverage suggests. It works as a composite gauge of the American stock market, built from seven inputs, and it describes today rather than tomorrow.
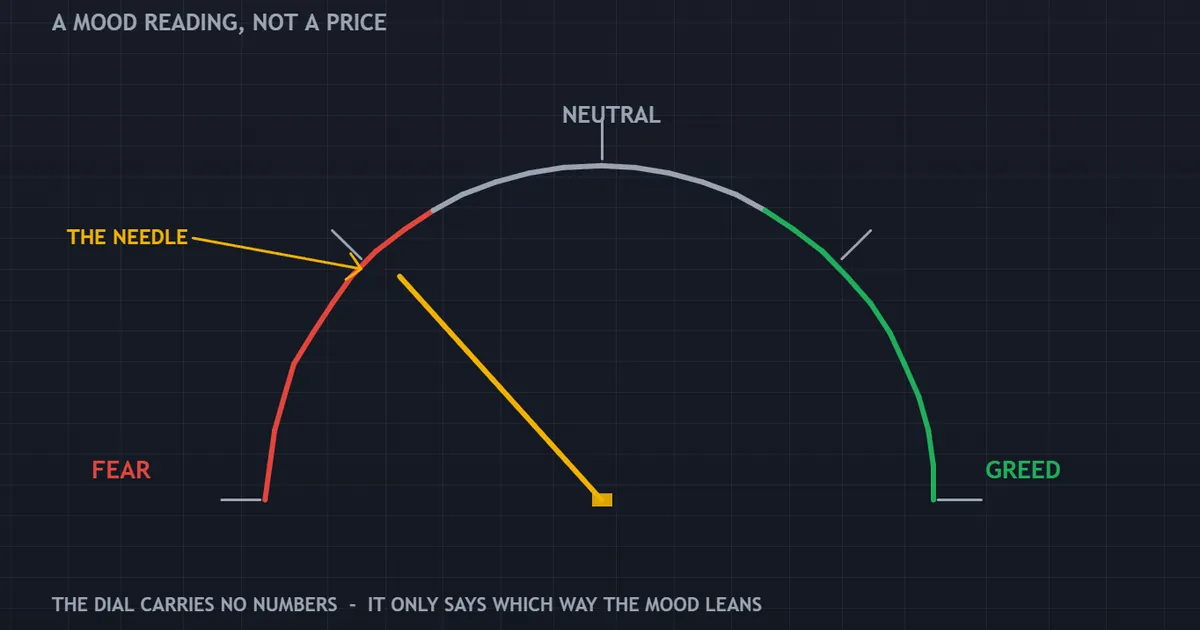
Fear and Greed Index Meaning in Plain Terms
The best known version comes from CNN Business. It runs on a scale from zero to one hundred, where zero marks extreme fear and one hundred marks extreme greed.
Fifty sits in the middle as a neutral reading. So the dial answers one question: how nervous does the American equity market look right now?
That question is worth asking. It is simply not the same question a currency trader needs answered.
A Summary, Not a Forecast
Every input feeding the gauge comes from current market data. Nothing in it looks forward, and nothing in it models what happens next.
So a low reading tells you the market has already fallen and volatility has already risen. That is history with a needle attached.
Why It Reads So Well
People find one number easier to hold than seven charts. A dial with two emotional labels turns a mess of data into a single impression.
That is the appeal, and also the danger. Compression throws away exactly the detail a trader needs.
Who Publishes What
Several outlets run their own versions with different inputs. So quoting a reading without naming the source leaves the number meaningless.
Always check which index somebody means. The equity version, the crypto version and various broker dashboards share a name and almost nothing else.
Where the Idea Came From
The dial grew out of an old market saying. Prices swing between two moods, and both moods push too far.
Two Moods, One Scale
Fear makes people sell what they hold. Greed makes them buy what they do not yet own.
So one scale can hold both. One end shows the rush to the door, and the other shows the rush to get in.
Why a Dial and Not a Chart
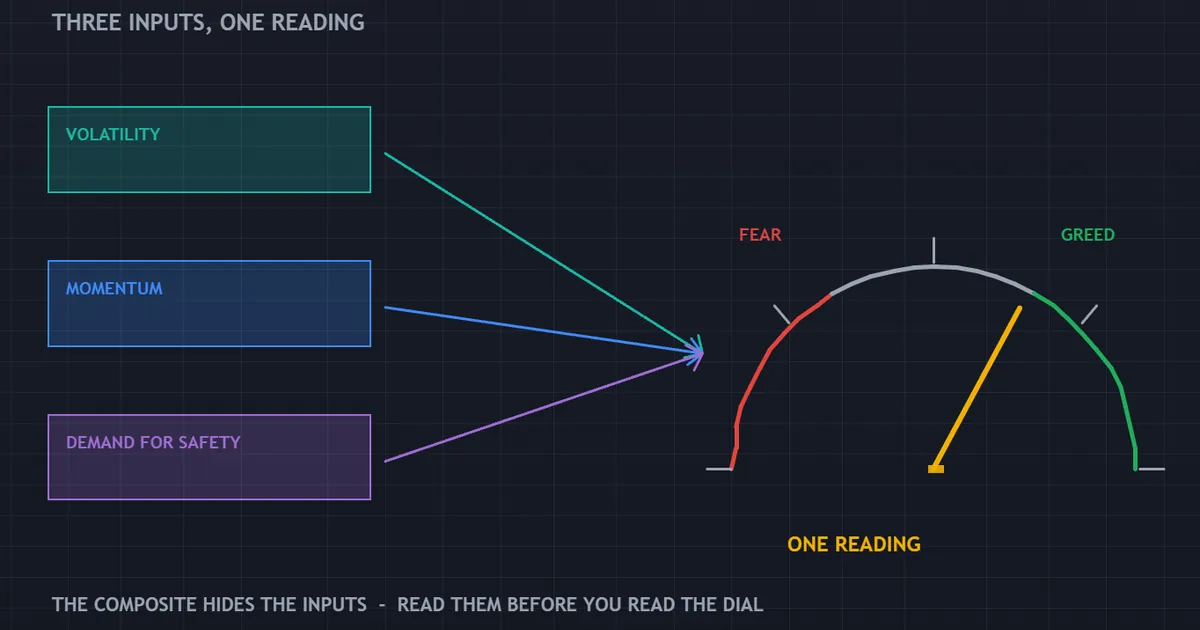
A dial hides the noise in the data. Readers see one needle, and the seven parts behind it stay out of sight.
That suits a news page well. It suits a trader badly, since a trader needs to know which part moved.
The Old Rule Behind It
Buy when others fear, sell when others cheer. The saying is neat, and it skips the hard part, which is timing.
Every crowd looks wrong at the top and at the low. In the middle, which is most of the time, the crowd is simply right.
What Goes Into the Composite
Seven measures feed the CNN gauge, each weighted equally. Knowing them removes most of the mystery.
- Market momentum. The S&P 500 compared with its own 125-day moving average.
- Stock price strength. The count of shares hitting 52-week highs against those hitting 52-week lows.
- Stock price breadth. Volume in rising shares against volume in falling shares, smoothed over time.
- Put and call demand. The ratio of put option volume to call option volume over the past five days.
- Market volatility. The VIX index against its own 50-day average.
- Safe haven demand. The gap between stock and treasury returns over the past twenty days.
- Junk bond demand. The yield spread between investment grade and high yield corporate debt.
Notice the shape of that list. Five of the seven inputs concern American shares directly, and the other two concern American bonds.
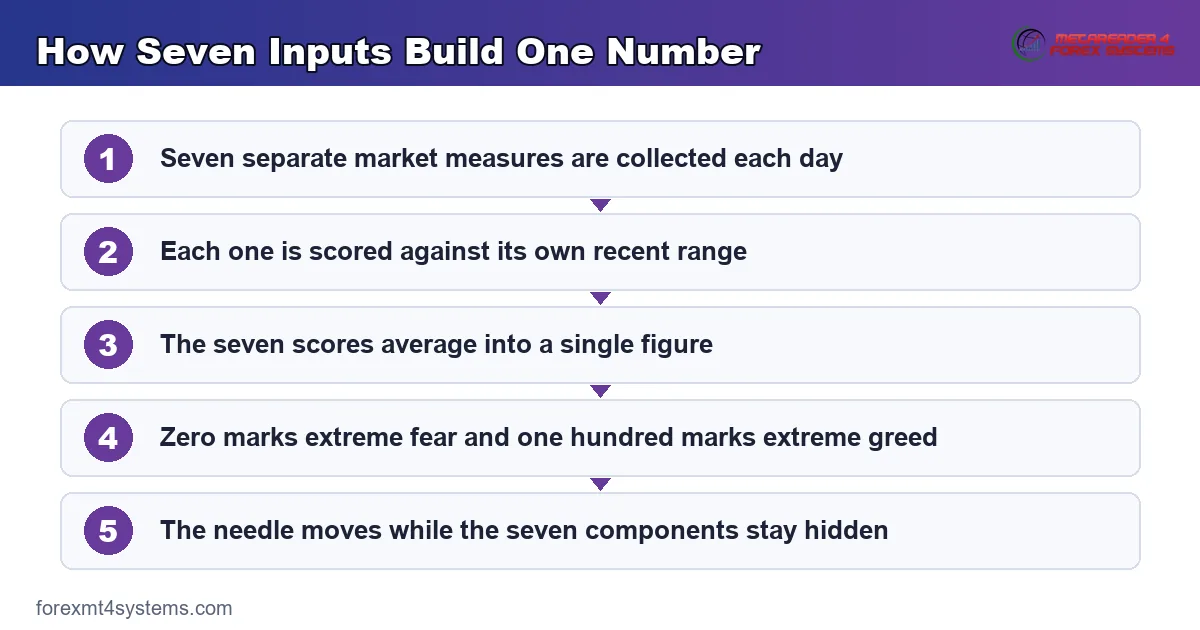
How the Inputs Combine
Each measure gets scored against its own recent range, then the seven scores average out. So one violent input can only move the dial so far.
That averaging smooths the series. It also means the headline number hides which component actually changed.
The Component Nobody Reads
Most traders quote the headline and skip the breakdown. Yet the breakdown carries the information, because volatility spiking is a different story from breadth weakening.
So open the components before you form a view. Ten seconds there beats an hour of commentary about the needle.
It Measures Equities, Not Currencies
This is the part most forex articles skate past. No input in the composite touches a currency pair.
The Link Is Indirect
Currencies still respond to equity stress, because capital moves between assets and regions. When shares fall hard, flows tend to favour the dollar, the yen and the franc.
Still, that link is a correlation which usually holds and sometimes does not. Rate differentials, policy meetings and local politics all override it regularly.
No Official Forex Version Exists
Nobody publishes an equivalent composite for the currency market. Broker dashboards that borrow the branding are usually client positioning under a new label.
Read the methodology note on any such gauge. If it counts client positions, then it measures a client book rather than fear.
What to Take From It Anyway
Treat the reading as background weather for global risk appetite. Our guide to safe haven currencies covers which pairs tend to respond and why.
Background weather is genuinely useful. It just never tells you when to click.
What Fear Looks Like in a Price Series
Gold offers the clearest picture of the same emotion in price form. A daily gold chart shows long stretches of drift broken by sharp vertical stretches.
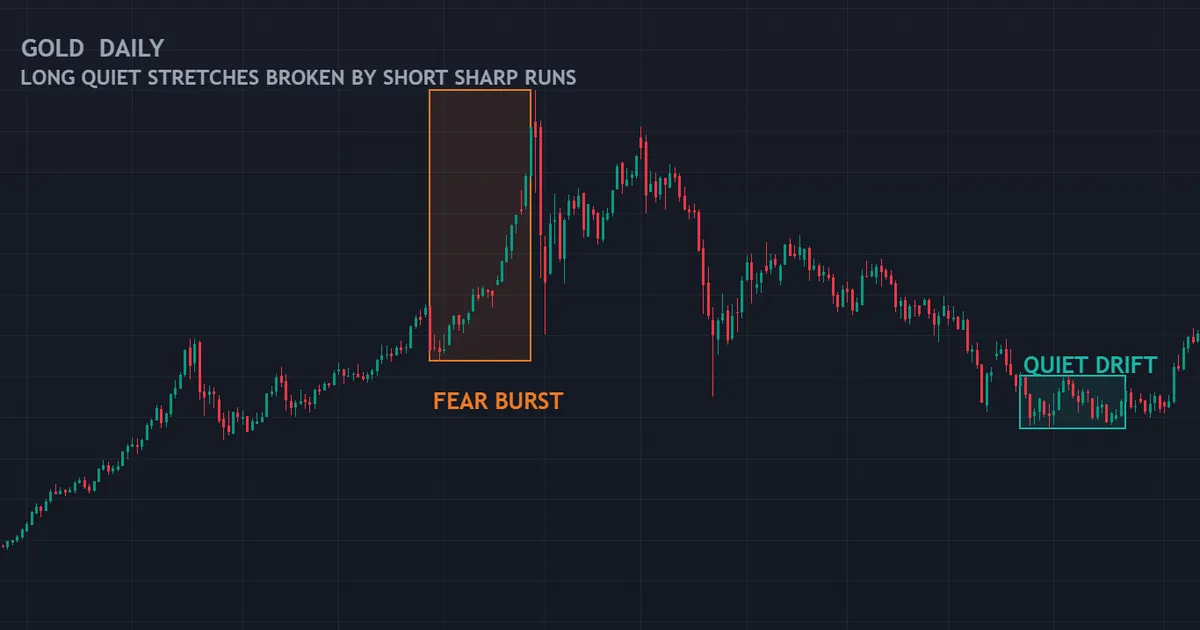
The Shape of a Fear Episode
Those vertical stretches arrive fast and rarely last long. Range expands, gaps appear at the open, and the market covers weeks of ground in days.
Then the move usually stalls and gives part of itself back. Fear is a burst, not a state, and the price series shows that plainly.
Look for the same shape in the pairs you trade. A haven cross that runs for three days and stops has told you the burst is over.
Why Gold Works as a Reference
Gold has no earnings, no coupon and no home country. So it reacts to fear more purely than most instruments, without an obvious anchor to argue about.
Currencies mix that reaction with rate expectations. The dollar can rise on fear and on strong growth alike, which makes it a noisier read.
Reading Bursts Rather Than Levels
Level tells you where the market has already gone. Rate of change tells you what state the market is in right now.
So watch how fast a haven moves rather than how far. A three-day sprint says more about risk appetite than a six-month trend.
How Traders Actually Use the Gauge
Three uses stand up to scrutiny. Everything else tends to be storytelling.
As a Regime Label
An extreme reading marks a stressed environment. In that environment, correlations tighten and normal ranges stop applying.
So you might cut position size or widen stops. That is a risk decision rather than a direction call.
As a Conflict Detector
Sometimes the gauge sits in greed while havens rally. That disagreement is worth investigating, because one of the two reads is early.
Conflicts appear more often than clean agreement. Our overview of market sentiment indicators works through how to weigh them against each other.
When two reads clash, trade smaller until one of them gives way. Waiting costs a few trades, and guessing costs more than that.
As a Journal Entry
Write the reading down beside your trades. After fifty entries you will know whether your results actually vary with the regime.
Our trade journal makes that record quick to keep. Personal evidence beats general claims every time.
Download the complete indicator database
Put these concepts on your charts. One email unlocks the full library of 1,380+ indicators with compiled MT4 and MT5 files, plus my TradingView scripts. No paywall, no spam, unsubscribe any time.
Get free access to my indicator database
One email unlocks 1,380+ free MT4, MT5 and TradingView indicators — the complete library. No single-tool download; you get the whole database.
Where the Index Misleads
Four failure modes account for most of the bad conclusions drawn from a dial.
Extremes Persist
Extreme fear can hold for weeks while price keeps falling. Buying because the needle looks low is a bet on other people’s patience.
The same applies at the greedy end. Markets spend long stretches in greed during healthy trends, and that is not a warning by itself.
The Lag Is Structural
Several inputs use averages over twenty, fifty or one hundred and twenty-five days. So the gauge cannot turn before the data it summarises.
Anyone waiting for the needle to confirm a change has already missed the change. The information sits in the components first.
It Says Nothing About Cause
Fear from a rate shock behaves very differently from fear about a single bank. One spreads across every currency, and the other stays local.
So the number cannot separate them. You still need the news flow, which is why our economic calendar sits beside any sentiment read.
Cause also decides how long the mood lasts. A single headline fades in a day, while a change in rate policy can hold the tone for months.
American Hours Dominate It
Every input comes from American markets during American hours. A currency trader working the Asian session reads a gauge that closed hours ago.
That timing mismatch matters more than people expect. Overnight moves in Asia routinely reprice risk before the dial updates.
Building a Currency-Side View Instead
You can assemble something more relevant from public data. It takes four lines and about ten minutes a day.
| Input | What it tells you | How to read it |
|---|---|---|
| Equity volatility index | How much protection costs right now | Sharp rises matter more than the level |
| Gold | Demand for an asset with no counterparty | Watch multi-day bursts, not slow trends |
| Yen and franc crosses | Whether funding currencies are being bought back | Strength here usually means de-risking |
| Credit spreads | How lenders price corporate risk | Widening spreads confirm genuine stress |
| Commodity currencies | Appetite for growth-linked exposure | Weakness alongside gold strength is the classic pair |
Score each line as calm, mixed or stressed. Three stressed lines out of five describes a regime, and one stressed line describes noise.
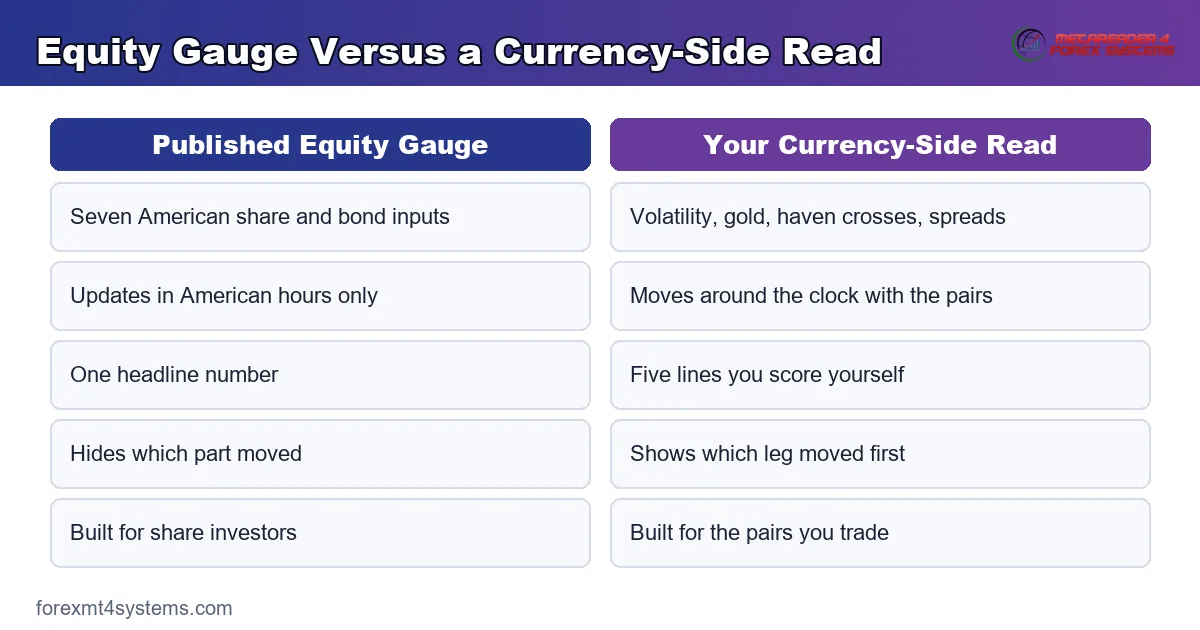
Why Two Legs Beat One
A single instrument can move for its own reasons. Two legs moving together, such as a haven rising while a growth currency falls, is a much stronger statement.
So always check the other side of the trade. Our note on the VIX in forex covers the volatility leg in detail.
When One Market Is Scared and Another Is Not
Stress does not spread evenly. Shares can fall hard while currency ranges stay normal all week.
Local Shocks
Trouble at one firm, or in one sector, hits shares first. Currency traders may barely notice it.
So a low reading can sit beside a dull week in the majors. Neither read is wrong, because the two cover different ground.
Shared Shocks
A rate shock or a growth scare travels through every market at once. Then shares, bonds, gold and the yen all move inside the same story.
Those are the days when the dial and the currency market agree. They are also the days when ranges double.
Telling Them Apart
Check whether bonds and gold moved with shares. If they did, the shock is broad, and your pairs sit inside it too.
If they did not, treat the reading as somebody else’s weather. Our guide to high impact news in forex covers the events that tend to travel furthest.
The Crypto Version Is a Different Animal
A separate crypto fear and greed index has become popular. It shares the name, the dial and none of the inputs.
What It Contains
Typical versions blend volatility, trading volume, social media activity, market dominance and search trends. Half of that is chatter rather than market data.
So it measures attention as much as fear. That distinction matters if you plan to compare it with anything else.
Why Traders Confuse Them
Both appear as a needle on a coloured arc. Charts get screenshotted, captions get lost, and readings from one market end up quoted about another.
Check the source before you use any figure. A crypto reading tells you nothing about the yen.
A Practical Weekly Routine
Structure keeps sentiment work from turning into commentary. Five steps, once a week, cover it.
- Note the headline reading and its direction. Rising fear and falling fear are different environments at the same level.
- Open the components. Record which two moved most, since those carry the story.
- Check your own five currency-side lines. Score each as calm, mixed or stressed and write the total down.
- Compare the two reads. Agreement means a clear regime, and disagreement means smaller size until it resolves.
- Set the risk, not the direction. Decide position size and stop width from the regime, then let your method pick the trades.
Step five is the one people skip. Sentiment work earns its place in risk decisions, not in entry decisions.
A Quick Test You Can Run
You do not need to take anyone’s word on this. A month of notes settles it.
Step One: Write the Number Down
Each morning, note the reading and which way it moved. Then add one word for the mood: calm, mixed or tense.
Keep the note short. A long note turns into a chore, and a chore stops after a week.
Step Two: Mark the Next Five Days
Beside each note, write what the pairs you trade did over the next five days. Up, down or flat is enough detail.
Do not grade the move as right or wrong. Just record it, then move on.
Step Three: Sort and Look
At the end of the month, sort the rows by reading. Then check whether the low ones and the high ones led to different weeks.
Most traders find a weak link at best. That result is still worth having, since it stops you leaning on a needle.
Step Four: Repeat It Next Quarter
One month is a small sample, and quiet months teach little. So run the same test again when the market next turns rough.
Two rough months tell you far more than a year of calm ones. Stress is where the claim about this dial lives or dies.
Common Mistakes
Five habits turn a reasonable gauge into a bad advisor.
Treating the Dial as a Trigger
Extreme fear is a description of conditions, not an instruction. Trading it directly means buying into whatever caused the fear.
Quoting It Without the Source
Equity, crypto and broker gauges disagree constantly. Naming the source keeps the conversation honest.
Ignoring Rate Policy
Currencies follow rate expectations more closely than mood. A hawkish central bank beats a nervous dial nearly every time.
Forgetting Position Size
Stressed regimes widen ranges, so the same stop distance now carries more risk. Adjust size before you adjust conviction, as our guide to risk management in forex explains.
Reading It Alone
One gauge is one opinion. Set it beside positioning, volatility and the calendar, then judge the picture rather than the needle.
Where It Fits in a Method
Sentiment sits underneath a strategy, not inside it. Our library of forex trading strategies shows where a regime read changes execution and where it changes nothing.
Headlines about record fear and record greed will keep arriving. In short, a dial summarises what already happened, and price still decides what happens next.
FAQ
Is there a fear and greed index for forex?
Not in the sense that people usually mean. The well known composite covers American shares and bonds, and no equivalent exists for currencies. Broker gauges carrying similar branding normally show client positioning instead, which measures a client book rather than market emotion. Build your own read from volatility, gold, haven crosses and credit spreads if you want a currency-side version.
What does a reading of extreme fear actually mean?
It means the seven inputs currently sit near the nervous end of their recent ranges. Shares have fallen, volatility has risen, and money has moved towards bonds. That describes conditions rather than predicting a bounce, and extreme readings can persist for weeks while price keeps sliding.
Can I trade currencies directly from the index?
Not sensibly. No input in the composite touches a currency pair, so any link runs through global risk appetite and arrives with a lag. Use it to set position size and expectations for range, then let your own method handle entries and exits.
How often does the index update?
The equity version updates through the American trading day and rests overnight. That timing suits an equity trader and fits a currency trader poorly, since the currency market keeps moving through the Asian and European sessions. Overnight repricing regularly happens before the dial reflects anything.
Is the crypto fear and greed index the same thing?
No. It shares the name and the dial, yet the inputs differ completely, mixing volatility and volume with social media activity and search interest. That makes it partly a measure of attention. Quoting a crypto reading in a currency discussion compares two unrelated things.
Should I fade extreme greed?
Only with the same care you would apply to fading any crowded position. Markets spend long stretches in greed during healthy trends, so an extreme reading alone is not a reason to sell. You still need a level, an invalidation point and a plan for being early.
Which single input matters most for currencies?
Volatility usually travels best across markets, because protection costs rise everywhere at once during genuine stress. Credit spreads run a close second, since they show how lenders price risk rather than how traders feel. Both beat the headline dial for anyone working in currencies.
Can I put the reading on a chart?
Some data feeds let you plot the series, though a plain daily note works just as well. What matters is that you keep the record yourself, in the same place as your trades. A number you can look back on beats a number you glance at once and forget.
Does the dial help with day trades?
Rarely. A gauge built from twenty-day and fifty-day averages moves far too slowly for a session-length trade. It may still tell you to trade smaller on a tense day, which is a useful thing to know before the first click.
How long should I track this before trusting it?
Give it a few months of weekly entries alongside your trades. Record the reading, the direction of travel and your own currency-side score, then review whether your results genuinely differ by regime. A handful of memorable episodes will mislead you in either direction. Results are not guaranteed; past performance is not indicative of future results.
External references
- For background on this concept, see The Put-Call Ratio at Investopedia.
- For broader market context, see The AAII Sentiment Survey in the BabyPips Forexpedia.

About the author
Written by Dominic Walsh, a Forex trader and MT4/MT5 indicator, Expert Advisor and script developer. Every tool on forexmt4systems.com is tested on live charts before release and ships with ready-to-use compiled MT4 (.ex4) and MT5 (.ex5) files. Learn more about the trader and developer behind this site.
How we build, test and correct every tool: Editorial & Testing Policy. Trading carries risk; see the disclaimer.