
Open any economic calendar and some rows carry a red icon or three filled bars. That marking is what traders mean by high impact news in forex, and it shapes how most people plan their week.
The label helps. It also misleads, because it ranks attention rather than tradability. This guide covers what earns the rating, what the rating misses, and how to sort releases by the thing that genuinely moves a currency.
What Is High Impact News in Forex?
High impact news means a scheduled release that calendar providers expect to move price sharply. Payrolls, inflation prints, central bank decisions and headline growth figures fill most of those rows.
Providers assign the rating themselves. No regulator sets it, and no two calendars agree completely, so treat the icon as one firm’s view about attention.

Above sits the four-hour bar covering the June payrolls release on USDJPY, stamped 13:00 on 5 June 2026. Its range ran to roughly three and a half times the recent average. The bar closed higher, then the next five handed back about 1.8 average ranges of that move.
Where the Rating Comes From
Each provider builds its own scale. Most of them blend a few simple inputs, and none of them publish a formula you could reproduce.
Country weight comes first. A release from the United States, the euro area, the United Kingdom or Japan starts higher than the same release from a small economy.
History matters next. When a series has moved markets before, the rating follows that record rather than any theory.
Finally the provider considers its own readers. A calendar aimed at retail traders flags the events those traders ask about most.
The Three Numbers on Every Row
Beside the icon sit three columns. Reading them in the right order does more for you than the rating ever will.
- Previous. What the last print delivered, sometimes with a revision attached. Revisions matter, because a big one changes the trend the market thought it knew.
- Forecast. The consensus of surveyed analysts. This is the number the market has already traded, so it sets the reference point for everything that follows.
- Actual. The print itself, published at the release time. On its own it means very little.
The gap between forecast and actual is the surprise, and the surprise is what moves money. A trader reading only the actual column has thrown away most of the signal.
Some rows carry no forecast at all. Those reactions tend to arrive slower and messier, because participants have to work out the reference point in real time.
Why the Label Is Only a Rough Guide
Notice what the rating leaves out. It says nothing about the spread, nothing about slippage and nothing about whether a small account can act on the move at all.
It also ignores what the market already expects. A red-rated print that matches the forecast can leave a pair almost perfectly still.
Compare two charts in this article for proof. The famous payrolls bar above covered around three and a half average ranges, while a reaction bar further down covered nearly six with no red row against it.
How a Release Earns the Top Rating
Five features push a row into the top tier. Not one of them promises a trade.
- A major economy. The currency has to matter. Data from a widely traded economy reaches far more portfolios than data from a small one.
- A fixed schedule. Traders can only prepare for something with a known time, so scheduled series outrank sudden announcements in the rating even when the surprise moves price more.
- A published consensus. Analysts forecast the number, which creates the gap between expectation and outcome that markets actually trade.
- A track record of movement. Providers look at what the last several prints did to price, then rate the next one accordingly.
- A link to interest rates. This is the feature that matters most. Anything feeding straight into the policy outlook earns the top rating, and usually deserves it.

Read that list again and something stands out. Four of the five describe the release itself, and only the last describes the mechanism that moves money.
Rank Releases by What Moves Rate Expectations
Here is a more useful ordering than the icons. Sort by how directly a release feeds the next policy decision.
The Tiers That Actually Matter
- Policy decisions and statements. The rate itself, the vote split, the guidance and the press conference. Nothing else changes the outlook this directly.
- Inflation prints. Headline and core consumer prices, which set the constraint every central bank works inside.
- Labour market data. Payrolls, unemployment and wage growth, since employment sits inside most central bank mandates.
- Activity surveys. Purchasing manager indices and confidence measures, useful mainly because they arrive early.
- Hard output data. Growth figures, retail sales and industrial production, which confirm a story rather than lead it.
- Everything else. Trade balances, housing starts and the long tail, which move price only when the market has nothing better to look at.
Notice how those tiers cut across the icons. A second-tier survey can outrank a red-rated output figure whenever the policy debate happens to hinge on growth momentum.
Our guide to what PMI means in forex covers that survey tier in detail.
The Rhythm of a Trading Month
Releases repeat on a predictable cycle. Learning that cycle beats scrolling the calendar every morning.
Roughly How the Month Runs
- Opening days. Manufacturing surveys land first, services surveys follow, and the American employment report arrives on the first Friday.
- Second week. Consumer price prints appear across several economies, and a few central banks hold scheduled meetings.
- Third week. Flash surveys for the euro area and the United Kingdom arrive, alongside retail sales and local employment updates.
- Closing days. Growth estimates, confidence measures and the American price gauge that policymakers watch most closely.
- All month. Central bank speeches, which appear on the calendar with a time but almost never with a forecast.
Learn the shape and your week plans itself. You will know which mornings need caution and which ones stay quiet.
Time zones deserve one warning. Calendars display release times in whatever zone you set, and your platform may run on a different one entirely.
Priced In: Why a Big Number Sometimes Does Nothing
This idea explains more reactions than any other, and most articles skip it. Price already contains the expected outcome before a release lands.
The Surprise Is the Trade
Markets do not trade the number. They trade the distance between the number and the forecast.
So a very strong print that matched the consensus changes nothing. Everybody acted on that expectation days earlier.
Positioning Can Flip the Sign
Sometimes a currency falls on good news. That happens when traders crowded into one side beforehand and then took profit on the confirmation.
Direction after a release is frequently counter-intuitive. Anyone selling a simple rule from print to direction has skipped this part of the story.
Two Ways a Release Surprises
Surprises come in two flavours, and they behave differently. Knowing which one you are watching helps a lot.
A level surprise means the number missed the forecast by a wide margin. Those reactions hit fast and often reverse just as fast.
A story surprise means the detail contradicted the headline. Those reactions build slowly across the hour, because analysts need time to read the breakdown.
How to Check What Is Priced
Look at the days before the event, not the minute after. A currency that drifted higher all week has already absorbed part of the expected outcome.
Read the consensus column too. Our free economic calendar lists the forecast and the previous print beside each release time.
A Reaction the Calendar Never Flagged
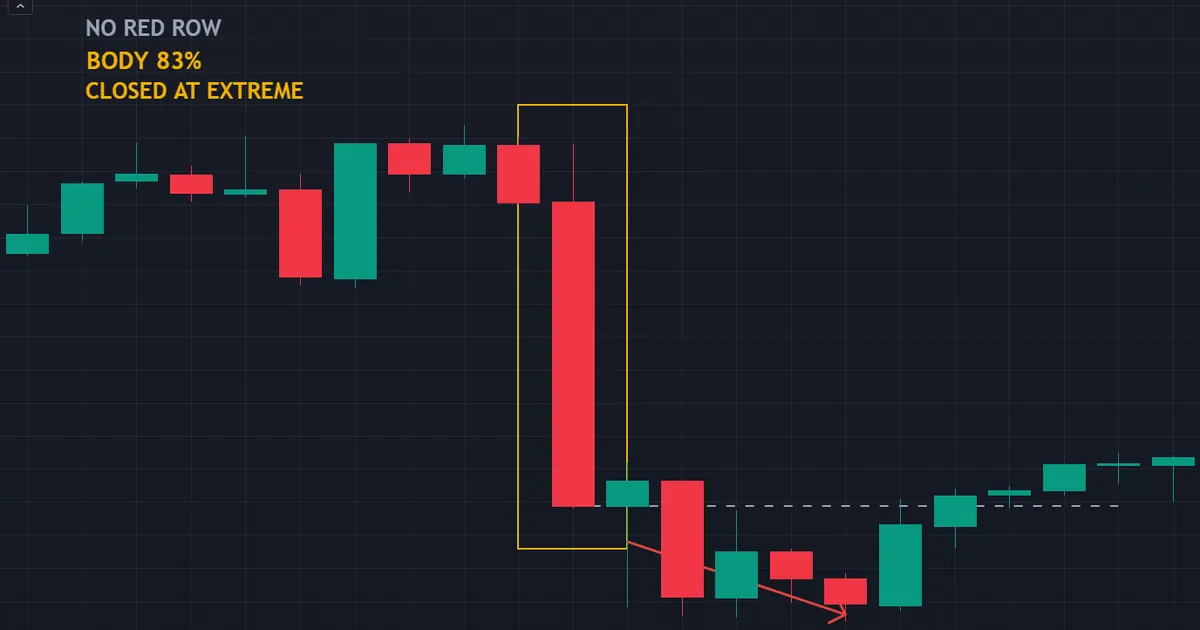
Below sits an hourly bar on USDCHF at 18:00 on 29 July 2026. No headline release carries that hour on most calendars, and the bar still dwarfed the payrolls example.
What the Bar Shows
Its range stretched to nearly six times the recent average. The body filled 83 percent of that range, and the close sat at the extreme.
That shape means one-sided trade. One side cleared the book, and nothing pushed back inside the hour.
Afterwards the market kept sliding, about one and a half more average ranges in the same direction. Plenty of movement, and no red icon warned anyone in advance.
What That Says About Ratings
Ratings describe expected attention. Movement comes from surprise, positioning and liquidity, and all three vary from week to week.
So use the calendar to decide when to be careful. Do not use it to decide when to trade.
Download the complete indicator database
Put these concepts on your charts. One email unlocks the full library of 1,380+ indicators with compiled MT4 and MT5 files, plus my TradingView scripts. No paywall, no spam, unsubscribe any time.
Get free access to my indicator database
One email unlocks 1,380+ free MT4, MT5 and TradingView indicators — the complete library. No single-tool download; you get the whole database.
Common Mistakes and the Fixes
Six habits turn an ordinary release into an expensive one. The panel below collects what helps instead.

Treating the Red Icon as a Signal
A rating flags attention, never direction. Use it to decide whether to hold an open position, not whether to start a new one.
Ignoring What Entry Costs
Spreads widen sharply around scheduled releases, and some brokers widen them minutes beforehand. Our note on why spreads widen explains the mechanics behind that.
Assuming a Stop Protects the Price You Chose
A stop order turns into a market order the moment price touches your level. In fast conditions the fill lands beyond it, and nothing promises otherwise.
Trading Every Red Row
Most red rows do very little. Pick the two or three each week that feed the live policy question, then leave the rest alone.
Forgetting the Rules You Trade Under
Several funded programmes ban positions through scheduled releases outright. Our summary of prop firm news trading rules covers what those restrictions usually say.
Judging the Reaction Too Early
The first tick tells you nothing. Let the bar close, then read the close rather than the extreme it printed on the way.
Quick Reference: Reading the Rating
Keep this table beside the calendar during the week. It separates what an icon promises from what it delivers.
| What the calendar shows | What it really means | What to do about it |
|---|---|---|
| Red or three-bar rating | The provider expects wide attention on this row | Plan your exposure, not your entry |
| A consensus forecast in the column | A surprise exists to trade against | Note the forecast before the release, not after |
| No forecast published | Reaction depends on the raw print alone | Expect a messier and slower move |
| Two red rows minutes apart | The second print lands inside the first reaction | Treat the pair of them as one event |
| A red row on a minor currency | Attention is local and liquidity stays thin | Widen the stop or stand aside completely |
| A revision to an earlier print | Old news, occasionally repriced | Watch it, and act only on a large revision |
When the Move Fades
Plenty of reaction bars never hold their extreme. Below, one closed well off its low, and the next five bars recovered about 1.7 average ranges back upward.

That describes a four-hour bar on USDJPY at 17:00 on 11 June 2026. Its range ran to roughly six and a half times the average, yet the body filled only 55 percent of it.
The Close Told the Story
Compare it with the USDCHF bar earlier. That one closed at its extreme with an 83 percent body, which is what a one-way hour looks like.
This one closed near the middle instead. Both sides traded inside the same bar, so the move met pushback while it was still forming.
A wide range with a small body describes a fight. The close carries the information, and the extreme is mostly noise.
Why First Moves Reverse So Often
Three ordinary forces do the work. None of them requires anything sinister.
Short-term money takes profit within minutes of the print. Stops beyond the prior range get swept, and that fuel runs out quickly.
Then the detail arrives. A strong headline with weak internals reads very differently once analysts publish the breakdown.
What That Means for Planning
Patience beats speed on these days. A trader working from the first closed bar knows more than one guessing inside it.
Our deep-dive on the forex news spike takes the whole sequence apart, stage by stage.
Events the Calendar Cannot Rate
Some of the biggest moves carry no icon at all. A calendar can only list what somebody scheduled.
Unscheduled Remarks
A policymaker answers a question at a conference, and the answer shifts the rate outlook. No forecast column exists for that, and the move often runs further than a rated release would.
Headlines and Geopolitics
Conflict, elections and sudden policy announcements all move currencies. Calendars cannot rate them, because nobody knows the timing in advance.
Flow, Not News
Month-end rebalancing, option expiries and large corporate orders push price without any story attached. Those moves confuse traders hunting for a cause.
The USDCHF example earlier fits this group perfectly. A bar covering nearly six average ranges arrived without a red row anywhere near it.
What to Take From That
Treat the calendar as a partial map. It shows the scheduled risk, and it stays silent about the rest.
So keep your risk per trade steady regardless of the day. Sizing that survives an unlisted surprise survives a listed one comfortably.
Is News Trading Worth the Trouble?
Plenty of courses sell it as simple. The mechanics say otherwise, so weigh the costs before you build a plan around it.
The Costs Arrive First
Spread widening hits at the moment of entry. Slippage hits at the moment of exit. Both land before any move helps you.
Neither cost shows up on a historical chart. Backtests of release-day rules therefore flatter the results, sometimes badly.
Your Broker Model Decides a Lot
Instant execution accounts answer a fast market with requotes. Market execution accounts fill you instead, at whatever price exists.
Neither model is broken. They simply fail in different ways, and you should know which one sits behind your platform.
A Calmer Alternative
Many traders use releases as a filter rather than a trigger. They flatten exposure beforehand and return once the range settles.
That approach still uses the calendar every day. It just stops treating a red icon as an invitation.
Building a Release-Day Routine
Knowing the theory changes nothing on its own. A short routine turns it into behaviour you repeat.
The Evening Before
Scan tomorrow for red rows on the currencies you hold. Note the time, the forecast and the previous print for each one.
Then decide your exposure in advance. Choosing while a position sits open and a clock ticks rarely produces your best thinking.
Thirty Minutes Before
Check the spread on your platform. Some brokers begin widening well ahead of the print, which tells you plenty about the conditions coming.
Mark the range of the last few hours as well. That gives you a reference for judging whatever the release bar prints.
Afterwards
Write down the forecast, the actual, the spread you saw and the fill you received. Those four fields turn every release into a data point.
Ten entries teach more than any article can. Your broker and your pairs behave in their own way, and only your own record shows it.
Related Guides and Tools
Release days sit inside a wider routine. Four companions make that routine easier to run.
Learn the two releases that matter most first. Our guides to NFP in trading and central bank rate decisions cover the top tier properly.
Measure the normal range before judging an abnormal one. Our forex volatility calculator gives you that baseline in a few clicks.
Then watch range expansion on the chart itself. Our volatility indicators archive collects tools built for exactly that job.
FAQ
What counts as high impact news in forex?
Central bank rate decisions, inflation prints, employment reports and headline growth figures from major economies. Calendar providers mark those rows red or give them three bars. The label reflects expected attention, and providers set it themselves, so two calendars can disagree about the same release.
Which release moves forex the most?
Policy decisions, as a rule, because they change the rate outlook directly rather than through inference. Inflation prints come next, since they set the constraint the central bank works inside. Employment data follows. That ordering shifts with the debate of the moment, though, so the release that matters most this quarter may sit second next quarter.
Can I trade high impact releases with a small account?
You can, and the arithmetic works against you more than it does for a large one. Wider spreads take a bigger share of a small target, and a minimum lot size can force more risk than you planned. Many small accounts do better waiting for the first bar to close and trading the level it leaves behind.
Why did the currency fall on a strong number?
Usually because the strength was already priced. When traders crowd into one side ahead of a release, a confirming print gives them a chance to take profit, and the resulting flow runs against the headline. Cross-currency effects add to that, since a dollar story can move a pair more than the local data does.
Should I close positions before a red-rated release?
That depends on your stop distance, your size and the rules you trade under. Ranges expand, so a stop suited to a quiet afternoon can sit well inside the noise. Reducing size beforehand is a common middle path. Check your funded programme rules too, because several ban open positions through scheduled events.
Do all calendars rate the same release the same way?
No, and the differences are worth knowing. Providers weight country, history and audience differently, so one calendar shows three bars where another shows two. Some also list regional releases that others drop entirely. Pick one calendar, learn its habits, and stop comparing icons across sites.
Does the red icon mean the move will be large?
No. It means the provider expects attention, which is a different thing. The four-hour payrolls bar in this article covered around three and a half average ranges, while an unflagged reaction bar covered nearly six. Rate a release by how much it can shift policy expectations, then judge the outcome after the bar closes rather than during it. Results are not guaranteed; past performance is not indicative of future results.
External references
- For background on this concept, see Consensus Estimate at Investopedia.
- For broader market context, see Speeches and Testimony at the Federal Reserve.
- The scheduled rate-decision dates that put those rows on a calendar in advance are published as Monetary Policy Committee dates for 2026 and 2027 at the Bank of England.

About the author
Written by Dominic Walsh, a Forex trader and MT4/MT5 indicator, Expert Advisor and script developer. Every tool on forexmt4systems.com is tested on live charts before release and ships with ready-to-use compiled MT4 (.ex4) and MT5 (.ex5) files. Learn more about the trader and developer behind this site.
How we build, test and correct every tool: Editorial & Testing Policy. Trading carries risk; see the disclaimer.