
Three white soldiers describes a run of three strong bullish bars in a row. Each one opens inside the previous body and closes near its own high, which paints a tidy staircase up the chart.
The shape looks decisive, and that is exactly why it deserves care. This guide covers the exact geometry, the places where the run means something, the bearish mirror, and the moment when the same three bars mark exhaustion instead of a beginning.
What Three White Soldiers Actually Show
The pattern reports a simple fact. Buyers controlled three consecutive sessions, and sellers never took back much ground between them.
Read that as a description, not a forecast. The bars record what already happened; they say nothing on their own about the next session.
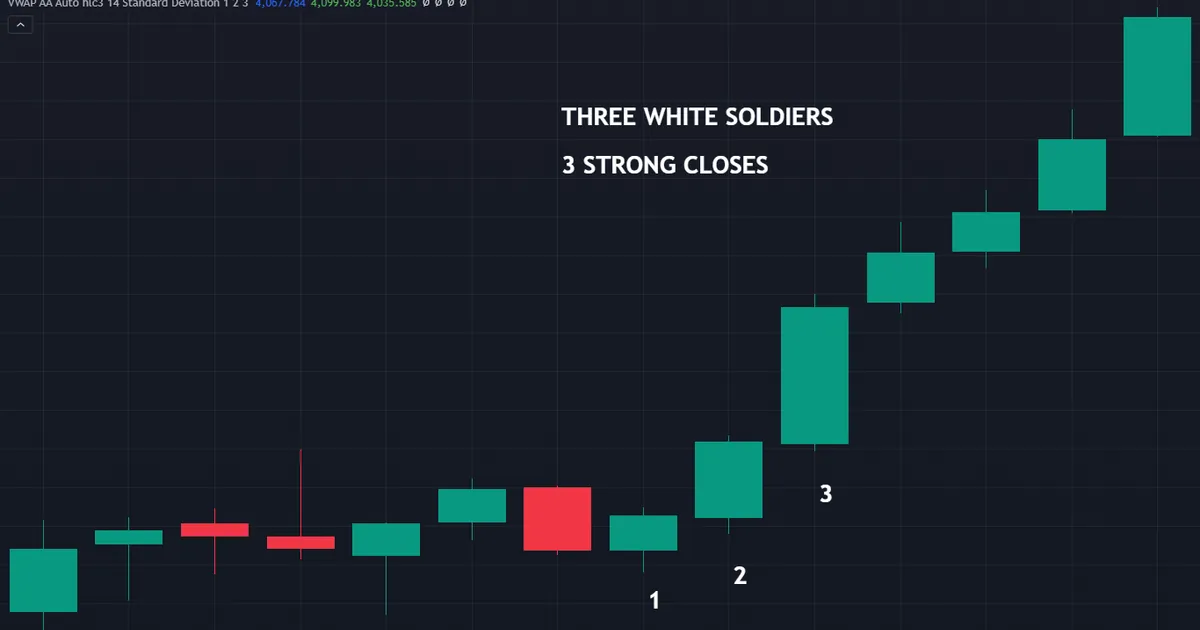
Still, the description carries information. Three closes near their highs suggest steady demand rather than one panicked burst.
Japanese candlestick charting reached Western traders through Steve Nison in the early 1990s, and the technique traces back to Japanese rice markets. The soldier imagery comes from that older vocabulary, where a marching column stood for orderly advance.
Why Traders Watch the Closes
Each close near the high tells you buyers held their gains into the bell. A close in the middle of the range would say the opposite.
So the closes carry more weight than the highs. A bar can spike and give it all back, and the close is what records the outcome.
Three such closes in a row change the tone of a chart. Sellers who defended lower prices stepped aside three times running.
What the Pattern Does Not Tell You
No candlestick formation predicts anything by itself. Academic tests of pattern trading have generally found little consistent edge once costs enter the sum, and results shift with the market and the definition used.
Treat the run as a change in tone, then. Whether that tone lasts depends on the trend, the level it started from, and what follows.
Our even-handed look at whether candlestick patterns work sets out the evidence in full. Read it before you build any rule around a shape.
The Exact Geometry, Bar by Bar
Definitions vary between books, so pin yours down and apply it consistently. The version below matches the classic description most closely.
- Three bullish bodies. Every bar closes above its own open, and each body runs long relative to the recent average.
- Each open sits inside the previous body. The second bar opens somewhere between the first bar’s open and close, and the third does the same against the second.
- Each close sits above the last. Closes step progressively higher, so the run makes fresh near-term highs.
- Closes land near the highs. Upper wicks stay short, which shows buyers holding the gains into each close.
- The run follows a decline or a base. Context matters, because the same shape mid-rally reads very differently.
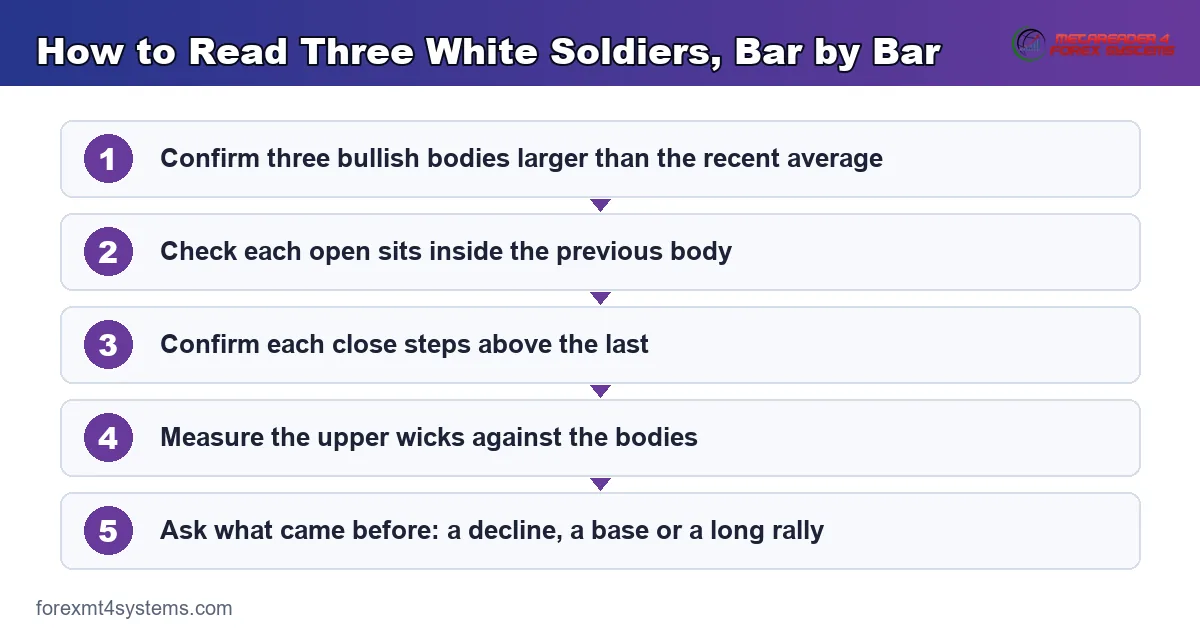
Notice how much of that definition concerns the opens and closes. Wick length only enters at step four, yet it changes the reading more than any other detail.
Why the Open Must Sit Inside the Body
An open inside the previous body shows sellers testing the advance and failing. Buyers absorbed that test and pushed the price up again.
An open above the previous close tells a different story. Price gapped, so nobody tested the level, and the advance looks more like a chase than a takeover.
Spot forex trades around the clock, so true gaps appear mainly at the weekend open. On a continuous chart the second bar usually opens right at the previous close, which most traders accept as inside the body.
How Long Is Long Enough
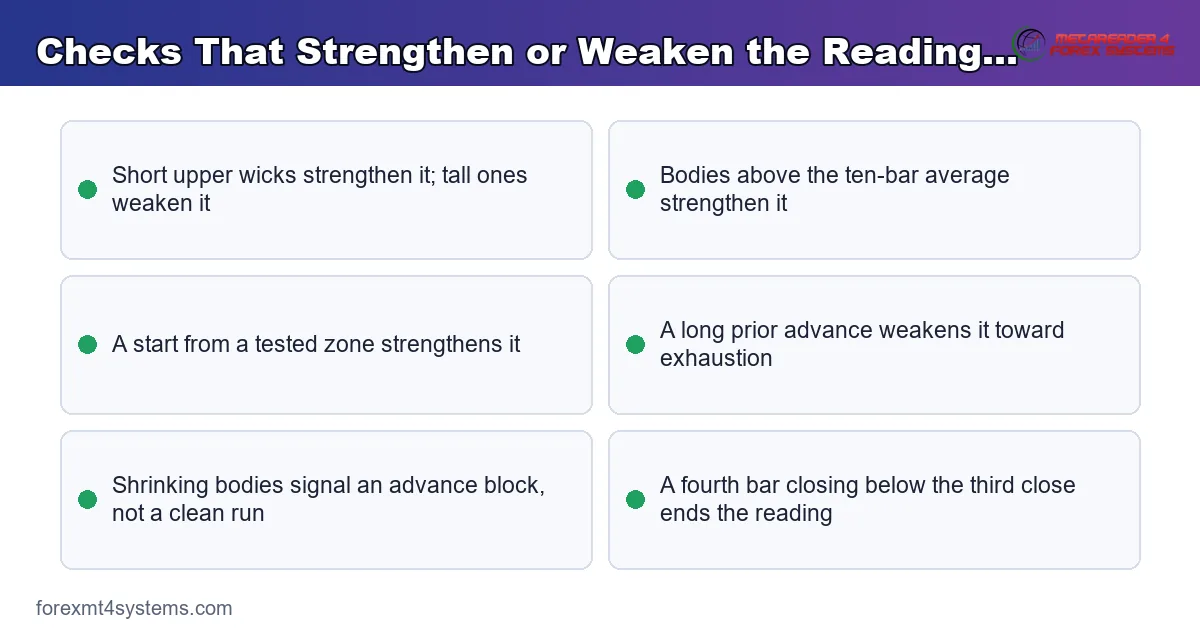
Compare each body with the recent range rather than an absolute figure. A body larger than the average of the last ten bars usually qualifies.
Some traders apply an average true range filter instead. Our guide to ATR shows how to turn recent range into a working threshold.
Either method beats eyeballing it. Bodies that merely look big on a zoomed chart often measure smaller than the week’s average.
Where the Definitions Disagree
Some writers demand that each open sit above the previous open. Others accept any open inside the body, which is the looser and more common reading.
A few require the third close to make a new multi-week high. That version fires rarely, though the examples it does produce look unusually clean.
Pick one version and stay with it. Switching definitions mid-review makes your own results impossible to compare from month to month.
Bodies With No Wicks at All
A bar with almost no wick at either end goes by the name marubozu. Three of them in a row make an especially clean version of this run.
Such bars rarely appear in perfect form. Our note on the marubozu candlestick covers the tolerance traders apply in practice.
Where the Three-Bar Run Carries Meaning
Location decides how much the shape is worth. The same three bars mean one thing after a long decline and something else halfway up a rally.
Ask what came before. A run that begins from a base, a tested support zone or the low of a pullback has a reason behind it.
After a Decline or From a Base
Sellers had control, then three sessions took it away. That handover carries information because it reverses the prior balance.
Look for the run starting at a level traders already watched. Our guide to candlestick patterns at support and resistance explains why the same bars read so differently in open space.
Volume would help here, though spot forex reports only tick volume from your broker. Treat it as a rough proxy for activity, never as traded size.
Inside an Established Uptrend
Mid-trend, the run reads as continuation rather than a turn. Buyers simply kept doing what they had already been doing.
That version still has uses. Traders who trail a position often treat it as a reason to hold rather than a reason to add.
A moving average helps you tell the two cases apart quickly. Our note on moving averages covers the simplest way to label the prevailing direction.
Which Timeframe You Read It On
The same rules apply on every chart, yet the meaning scales with the timeframe. Three daily bars cover three full sessions of trading, while three one-minute bars cover three minutes.
Lower timeframes therefore throw up far more of these runs. Most resolve into nothing, simply because a short burst of buying rarely changes the balance for long.
Intraday traders usually keep the shape as a trigger and take direction from a higher chart. That split leaves the noise on one screen and the decision on another.
After an Extended Run
Here the caution bites hardest. Three big bullish bars late in a long advance often mark the last surge rather than a fresh start.
Buyers who waited pile in near the top, and the move exhausts its own fuel. Traditional candlestick writing warns about exactly this case.
So measure how far price has already travelled. A run arriving after a month of gains deserves far more scepticism than one arriving off a base.
A Worked Example on the Daily Chart
Picture a major pair that has ground higher for a week on the daily chart. Each small dip gets bought, and sellers never manage a real down day.
Then a bullish bar closes near its high, followed by two more that each open inside the previous body. Closes step higher every day.

Read the sequence in order. Every open sits inside the body before it, and every close lands near the top of its own range.
What to Check Before Acting
Measure the bodies against the recent average first. Three ordinary bars dressed up by a zoomed chart prove nothing.
Check the upper wicks next. Short wicks support the reading, while long ones say sellers met the advance every day.
Finally look at where the third close sits. A close pressed right against overhead resistance leaves very little room for the trade.
Entry, Stop and Target
Many traders wait for a pullback rather than buying the third close. Chasing the third bar means paying for a move that has already run.
A stop under the first soldier’s low sits below the whole structure. That placement respects the pattern instead of hugging the last bar.
Size the position from that stop distance, not the other way round. Our free position size calculator turns the distance into a lot size in a few seconds.
Managing the Trade Afterwards
Plan the exit before the entry fills. A first target at the next overhead zone gives you a measurable outcome rather than a hope.
Trailing behind each new swing low suits the runs that keep going. Traders who prefer certainty scale out at the first target and leave a smaller position running.
Either way, watch the fourth and fifth bars closely. A close back under the third bar’s midpoint says the buying faded, and many traders cut there rather than waiting for the stop.
Download the complete indicator database
Put these concepts on your charts. One email unlocks the full library of 1,380+ indicators with compiled MT4 and MT5 files, plus my TradingView scripts. No paywall, no spam, unsubscribe any time.
Get free access to my indicator database
One email unlocks 1,380+ free MT4, MT5 and TradingView indicators — the complete library. No single-tool download; you get the whole database.
Three Black Crows: The Bearish Mirror
Flip every rule and you get three black crows. Three bearish bars follow a rally, each opening inside the previous body and closing near its low.
The logic mirrors exactly. Sellers controlled three sessions, and buyers failed to reclaim much ground between them.
Reading the Crows
Long lower wicks weaken the bearish version, just as long upper wicks weaken the bullish one. A wick shows the other side fighting back.
Location still governs the reading. Three bearish bars starting from a resistance zone say more than three bars printed mid-range.
Our round-up of bearish candlestick patterns places the crows beside the other downside shapes. Reading them as a family beats memorising each one alone.
Trading the Mirror in Practice
Everything you apply to the bullish run transfers directly. Measure the bodies, check the opens, then look at the lower wicks instead of the upper ones.
Stops sit above the first crow’s high for the same structural reason. Targets sit at the next zone below, which keeps the arithmetic identical.
One asymmetry deserves a mention. Declines often move faster than advances, so bearish runs tend to travel further in less time.
Two Cousins Worth Knowing
Traditional candlestick writing names two weaker variants of the bullish run. Both keep the three bullish bodies while changing the rhythm.
The advance block shows each successive body shrinking, with upper wicks growing. Buyers are still winning, yet by less each day.
The stalled pattern goes further: the third bar turns small and opens near the second close. Traders read both as a loss of drive rather than a clean run.
Telling the Run Apart From Its Lookalikes
Several three-bar shapes look alike at a glance. The table below sorts them by the one detail that separates each from the rest.
| Shape | Defining detail | What it describes |
|---|---|---|
| Three white soldiers | Three long bullish bodies, opens inside the previous body, closes near the highs | Buyers held control across three full sessions |
| Advance block | Same three bullish bodies, yet each smaller with a longer upper wick | Buying continues while the drive fades |
| Stalled pattern | Third body turns small and opens near the second close | The advance runs out of participants |
| Rising three methods | A long bullish bar, three small pullback bars, then another long bullish bar | A pause inside an existing move rather than a turn |
| Any three green bars | No size, open or close rules applied at all | Nothing in particular |
Only the top row earns the classic name. The others share the colour and very little else, so keep the geometry rules in front of you.
Why the Distinction Matters
Loose naming spreads quickly through trading forums. A shape called by the wrong name inherits expectations it never earned.
So write your definition down, then test it against your own charts. The exercise takes an evening and settles the question for good.
Common Mistakes and How to Fix Them
Six errors account for most of the trouble with this shape. Each has a straightforward fix.
Counting Any Three Green Bars
Three small bodies with long wicks look nothing like this pattern. Apply the size and close rules before you name the shape at all.
Ignoring How Far Price Has Already Travelled
Late in an extended advance the run often marks exhaustion. Measure the distance from the last swing low before you treat it as an opening move.
Overlooking Long Upper Wicks
Tall upper wicks mean sellers pushed back every session. Check the wick-to-body ratio on all three bars, and downgrade the reading when they grow.
Chasing the Third Close
Buying the third bar puts your entry at the top of the run and your stop a long way below. Wait for a pullback, or size down sharply.
Trading It in Open Space
Without a zone underneath, the run has no story behind it. Mark your levels first, then let the pattern act as timing rather than reason.
Skipping the Higher Timeframe
A neat run on the fifteen-minute chart can sit inside a daily downtrend. Check the larger picture before you decide what the three bars mean.
Judging the Third Bar Before It Closes
A soldier can turn into a doji in the final minutes of a session. Wait for the close, because an unfinished bar reports nothing final about who won.
Quick Reference Checklist
Run this list before you act on any three-bar bullish run. Seven questions cover the whole reading.
- Do all three bars close above their opens with long bodies?
- Does each open sit inside the previous body rather than above it?
- Do the closes step higher, one after the other?
- Are the upper wicks short compared with the bodies?
- Did the run start from a decline, a base or a marked zone?
- How far has price already travelled from the last swing low?
- Does the higher timeframe trend agree with the run?
A no anywhere on that list does not kill the idea outright. It simply tells you to trade smaller, or to wait for the pullback instead.
When the Pattern Fails
Failures happen often, and they usually look the same. Price makes the tidy staircase, then stalls and gives the whole run back.

Study the failure rather than avoiding it. Above, the next session opens higher, reverses, and closes back inside the second soldier. So the shape reported real buying, yet the follow-through never arrived.
Several different causes produce that same picture. Each one leaves a clue you can check beforehand.
The Run Ended at Resistance
Three strong bars can carry price straight into an overhead zone. Sellers waiting there absorb the advance, and the fourth bar closes red.
The Bars Were Too Big
An unusually wide run leaves price stretched from any moving average. Mean reversion then pulls it back, which traps late buyers near the top.
News Drove the Move
Three sessions of headline-driven buying can reverse the moment the story changes. Check what caused the advance before you treat it as structural.
The Third Bar Carried a Long Upper Wick
That wick warned you inside the pattern itself. Sellers met the third push, and the run lost its cleanest feature at the worst moment.
The Bars Were Only Noise
Small bodies on a quiet chart pass a careless eye test easily. Measuring each body against the ten-bar average filters most of them out before they cost anything.
Nothing Confirmed It
A fourth bar closing below the third close undoes the tidy reading. Many traders treat that close as the point where the idea expires.
Building the Run Into a Process
A shape on its own does not make a method. Slotting it into a routine turns it into something you can repeat and review honestly.
Give It One Job
Let the run answer a single question: when to act, once you have already decided where. Location and trend do the selecting, while the three bars handle the timing.
That division keeps your rules clean. A pattern asked to select trades as well as time them soon starts appearing everywhere you look.
Log Every Occurrence, Traded or Not
Record each run you spot along with its context and its outcome. Twenty entries tell you more about your own market than any general claim about the pattern.
Note the failures with particular care. Reviewing them sharpens your definition far faster than reviewing the winners ever will.
Revisit the Definition Every Few Months
Your first rule set will run too loose. Tighten the body threshold or the wick ratio once your journal shows which detail keeps letting weak examples through.
Related Concepts to Study Next
This run makes most sense beside the wider candlestick vocabulary. Two starting points fill in the gaps.
Begin with our orientation guide to candlestick patterns for the anatomy and the pattern families. Then browse our candlestick indicators, which flag these shapes on the chart as each bar closes.
For the trend question, our trend indicators library covers the tools that label direction on the higher timeframe. Pairing the two answers most of the questions the checklist raises.
FAQ
What are three white soldiers?
The name describes three consecutive bullish candles, each opening inside the previous body and closing near its own high, with closes stepping progressively higher. Traders watch for the shape after a decline or from a base, where it shows buyers taking control across three sessions in a row.
Is the pattern bullish or bearish?
The shape itself reads bullish, since buyers closed three sessions near their highs. Location decides how much that reading is worth. After a long advance the same three bars often mark exhaustion instead, so measure how far price has already travelled.
What weakens the reading?
Long upper wicks weaken it most, because they show sellers pushing back into every close. Shrinking bodies weaken it too, and traders call that variation the advance block. An opening gap above the previous close also counts against the classic definition.
What is the bearish version called?
Three black crows. The rules mirror exactly: three bearish bodies, each opening inside the previous body, each closing near its low, appearing after a rally. Long lower wicks weaken the bearish reading in the same way that upper wicks weaken the bullish one.
Where should the stop go?
Most traders place it below the low of the first bar in the run, so the stop sits beneath the whole structure rather than hugging the last candle. Then size the position from that distance instead of forcing the stop closer to fit a preferred lot size.
Can I trade the pattern on its own?
You can, but the shape works far better as timing than as a reason. Mark the level or the trend first, then let the three bars decide when to act. Every entry still needs a stop, a plan and a size you can repeat. Results are not guaranteed; past performance is not indicative of future results.
External references
- For background on this concept, see Three White Soldiers at Investopedia.
- For broader market context, see Three White Soldiers at BabyPips Forexpedia.

About the author
Written by Dominic Walsh, a Forex trader and MT4/MT5 indicator, Expert Advisor and script developer. Every tool on forexmt4systems.com is tested on live charts before release and ships with ready-to-use compiled MT4 (.ex4) and MT5 (.ex5) files. Learn more about the trader and developer behind this site.
How we build, test and correct every tool: Editorial & Testing Policy. Trading carries risk; see the disclaimer.