
Bearish candlestick patterns describe one thing: a session where sellers took the upper hand. They record what just happened on the chart, and they never promise what happens next.
This guide groups the bearish set into single-bar, two-bar and three-bar families. Each entry gets a short, exact definition plus a link to its own deep-dive page, so you can scan the family first and drill into any shape after.
What Bearish Candlestick Patterns Have in Common
Every bearish shape tells one basic story. Buyers pushed price higher, sellers met them, and the close finished nearer the low than the high.
Read the close first. A close near the bottom of the bar’s range hands that session to sellers, whatever the wicks did along the way.
Then read the location. A rejection wick in mid-range means little, while the same wick at a level buyers defended twice already carries far more weight.
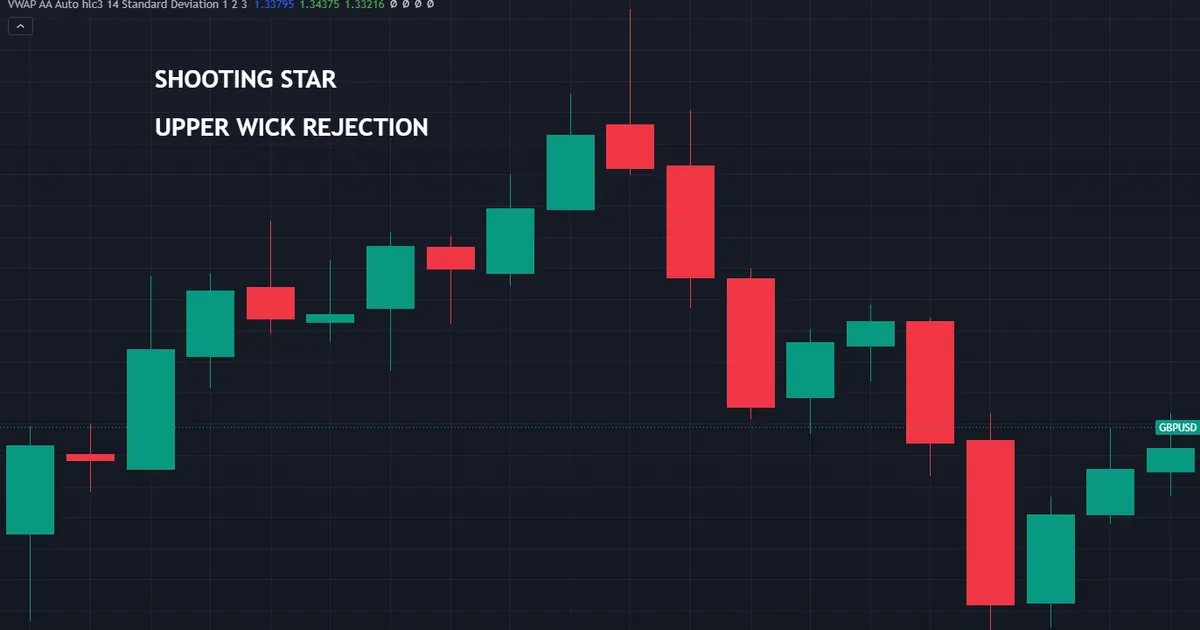
So treat every shape here as evidence rather than as a trigger. Each one tells you who won the last session, and the market decides the rest.
The Anatomy Vocabulary You Need
Four prices build a candle: open, high, low and close. The body spans open to close, while the wicks run from the body out to the high and the low.
A bearish body closes below its open. Charts usually paint it red or black, though the color adds nothing the four numbers do not already say.
Body length against total range matters most. A long body with tiny wicks means one side ran the session, and a small body with long wicks means neither side held its ground.
Why Location Beats Shape
The same candle at two spots on a chart carries two different messages. At a swing high that already turned price away, a rejection bar adds to a story the chart told you earlier.
In open space it adds almost nothing. Price moves, wicks form, and most of them mark nothing more than a pause in the flow.
So mark your levels before you hunt for shapes. Our guide to support and resistance covers the levels worth watching, and our page on candlestick patterns at support and resistance shows the same bar in both settings.
Where These Shapes Came From
Candlestick charting grew out of Japanese rice trading, and the technique carries the name of Munehisa Homma more often than any other. Much of that legend rests on thin evidence, so take the story lightly.
Steve Nison introduced the method to Western traders in the early 1990s. His books gave the shapes their English names, and those names stuck even where definitions drifted between authors.
That drift matters today. Two charting packages can flag different bars as the same pattern, so read any scanner’s rules before you trust its labels.
How to Read a Bearish Bar in Order
A repeatable reading order stops you seeing shapes everywhere. Run these five checks before any bearish pattern earns a place in your plan.
- Mark the level first. Note the swing high, band edge or session high that price has just reached.
- Check the prior move. Bearish reversal shapes need a rally behind them, or they describe nothing at all.
- Measure body against range. Work out how much of the bar the body covers, and where it sits inside that range.
- Compare the close. Hold this close against the previous bar’s body, and against the level itself.
- Wait for the next bar. Let the following session confirm or deny the story before you act on it.
Step five costs you a little entry price and saves you many poor trades. Because a pattern only describes the past, the next bar carries the first genuinely new information.
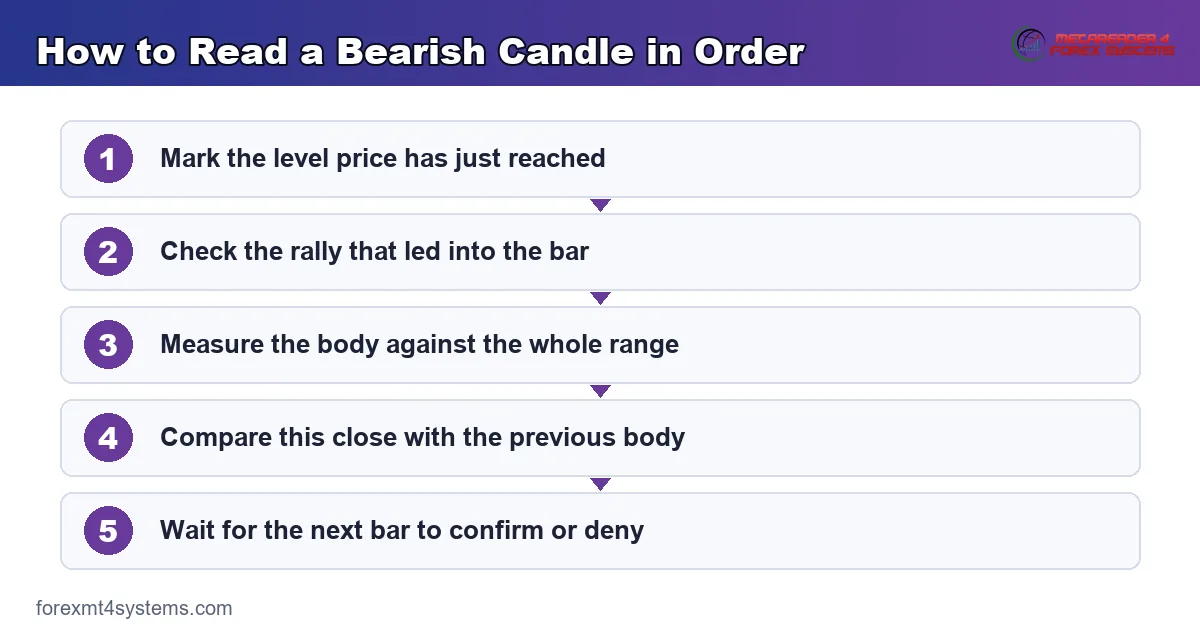
Keep the order fixed. Traders who start with the shape find patterns everywhere, while traders who start with the level find far fewer and care about each one.
How Strict Should Your Definition Be
Strict rules cut your list of candidates hard. Loose rules hand you dozens of near-misses, and near-misses rarely carry the same message as the real thing.
Pick a tolerance and write it down. A common approach demands an upper wick at least twice the body, plus a lower wick under a quarter of the range.
Then apply that tolerance the same way every day. Consistency lets you review your own trades later and learn something from the record.
The Single-Bar Bearish Set
One candle can carry a clear message when it lands in the right spot. Four shapes make up the single-bar group, and each one hinges on where the body sits.
Shooting Star
A shooting star holds a small body at the bottom of its range, a long upper wick of roughly twice the body or more, and little or no lower wick. It follows an advance.
That upper wick records a push higher that sellers erased inside one session. Our shooting star candlestick pattern guide covers the exact geometry and the lookalikes.
Watch out for its twin. An inverted hammer carries the identical shape after a decline, so only the move into the bar separates the two names.
Hanging Man
A hanging man carries a small body at the top of its range and a long lower wick, again roughly twice the body. Geometry alone cannot separate it from a hammer.
Location does all the work. The shape counts as a hanging man only after an advance, which our hanging man candlestick page sets out in full.
Gravestone Doji
A gravestone doji opens and closes at almost the same price, right at the low of its range, leaving a long upper wick above. The body shrinks to a line.
Buyers took price up and gave every pip back. Indecision drives that shape, so read it as a note about fading momentum rather than as a call for a turn.
Spot forex rarely delivers a perfect doji. Because the market trades around the clock, the open and close land a pip or two apart far more often than they match exactly.
Bearish Marubozu
A bearish marubozu shows essentially no wicks. It opens at or near the high, closes at or near the low, and hands the whole session to sellers.
Perfect examples stay rare, so most traders allow a small tolerance. Our marubozu candlestick guide sets out that working definition and what a near-perfect bar implies.
The Two-Bar Bearish Set
Two-bar shapes compare one session with the last. Each one asks a simple question: how much of the previous bar did sellers claw back?
Bearish Engulfing
A bearish engulfing pattern needs a bullish bar, then a bearish bar whose body fully covers it. Traditional definitions use bodies rather than wicks, so state which version you apply.
The second session opened higher, then closed under the whole of that earlier body. Our pin bar vs engulfing comparison shows how a two-bar takeover differs from a single rejection bar.
Relative size carries the meaning. A huge bearish bar swallowing a tiny bullish one says far less than a bearish bar that swallows a strong, wide body.
Dark Cloud Cover
Dark cloud cover starts with a strong bullish bar. The next bar opens above it, then closes back below the midpoint of that bullish body.
Depth matters here. A close barely under the midpoint says less than one landing near the previous open, and our piercing line and dark cloud cover guide covers both mirrors.
Bearish Harami
A bearish harami inverts the engulfing idea. A small second body sits entirely inside the previous large bullish body, which the Japanese word for “pregnant” describes rather neatly.
Contraction, not takeover, defines it. Sellers did not seize the session; buyers simply stopped pressing, as our harami candlestick pattern page explains.
The Three-Bar Bearish Set
Three-bar shapes trade sensitivity for context. They take longer to form, and they show a turn unfolding rather than a single snap decision.
Evening Star
An evening star runs across three sessions. A large bullish bar comes first, then a small-bodied indecision bar, then a strong bearish bar closing well into that first body.
How deep the third close lands decides the quality of the shape. Our morning star vs evening star comparison sets it beside its bullish mirror.
Classic texts want the middle bar to gap away from both neighbours. Spot forex gaps only at the weekend, so most forex traders drop that clause and simply demand a small middle body.
Three Black Crows
Three black crows describes three consecutive strong bearish bars. Each one opens inside the previous body and closes near its own low.
Long upper wicks weaken the reading. After an extended slide the shape can mark exhaustion rather than a start, and our three white soldiers guide covers the bullish mirror with the same cautions.
A Worked Example: One Bar Covers Another
Theory settles fastest against a real sequence. Picture a major pair edging up through a quiet overnight session on the hourly chart.
A small bullish bar closes at the top of that drift. The next bar opens on that exact close, then sellers take the whole hour, and it finishes below where the bullish bar began.
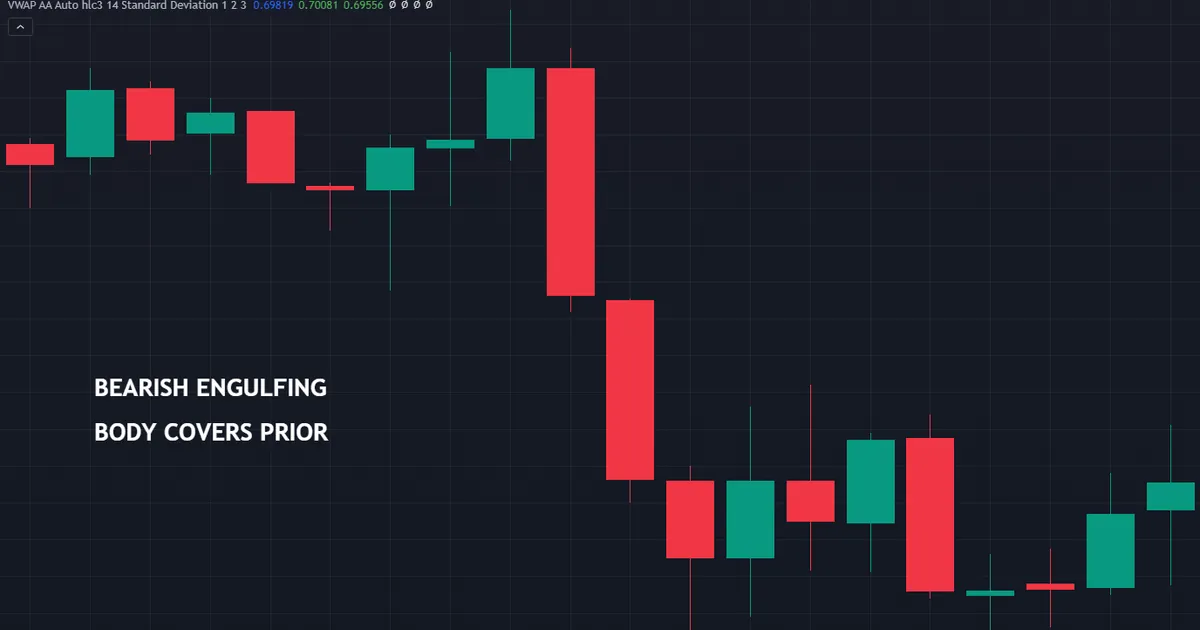
Nothing about that bar forces a turn. It simply records that an hour of buying got undone inside the hour that followed.
What the Next Bar Adds
The following bar carries the real weight. A close below the engulfing bar’s low says sellers kept pressing, while a close back above its high says the opposite.
So plan both branches in advance. One branch gives you a short setup with a stop above the engulfing bar, and the other tells you to stand aside.
Size the branch you take before you click. Our free risk reward calculator turns a stop above that bar and a target at the prior swing into a ratio you can accept or reject.
Reading the Same Sequence on Two Timeframes
Climb to the four-hour chart and those two hourly bars vanish inside a single candle. The tidy takeover disappears, and only a modest upper wick survives.
That difference helps your stop. A tight structure on the lower timeframe gives you a shorter distance to safety than the higher-timeframe wick allows.
Move up again to the daily and the whole episode shrinks to a few pips. Neither view lies; each simply answers a different question about the same price.
What Would Cancel the Read
Write the cancel condition before the trade, not after. An hourly close back above the engulfing bar’s high cancels this one cleanly, and nothing about the original bar changes that.
Traders who skip this step negotiate with themselves later. A written line removes the argument, because price either crosses it or does not.
Download the complete indicator database
Put these concepts on your charts. One email unlocks the full library of 1,380+ indicators with compiled MT4 and MT5 files, plus my TradingView scripts. No paywall, no spam, unsubscribe any time.
Get free access to my indicator database
One email unlocks 1,380+ free MT4, MT5 and TradingView indicators — the complete library. No single-tool download; you get the whole database.
Common Mistakes With Bearish Patterns
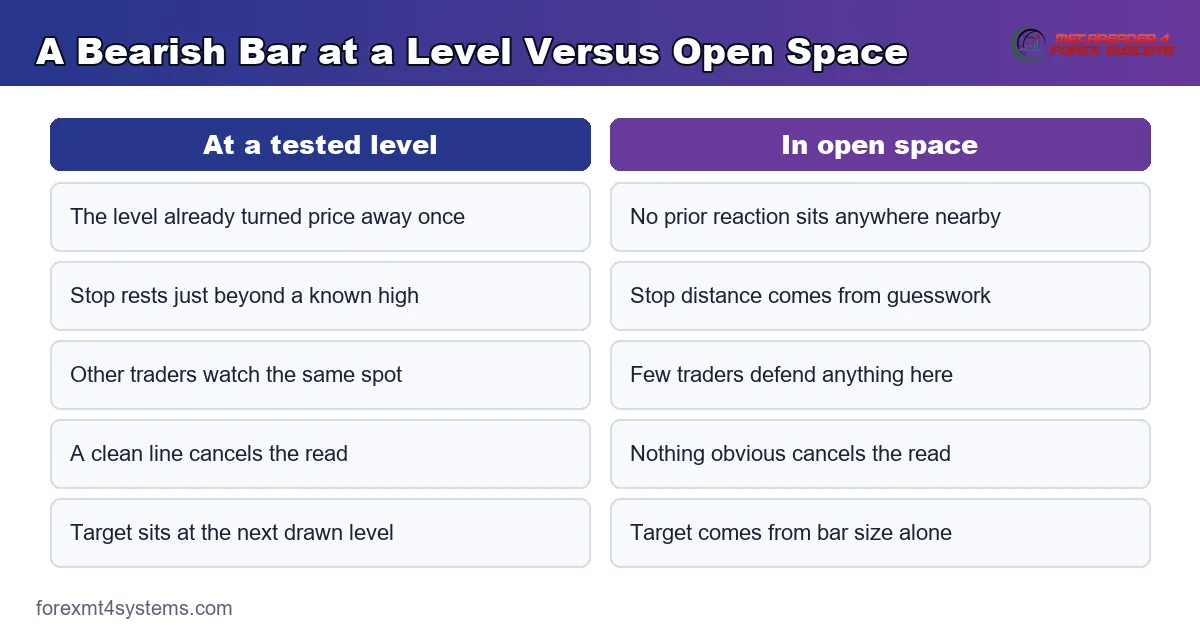
Traders misread this family in a handful of predictable ways. The comparison panel below sets the same shape at a level against the same shape in open space.
Trading the Shape Without the Level
A shooting star in the middle of a range describes a wick and nothing more. Mark your levels first, then look for shapes only where those levels sit.
Acting Before the Bar Closes
An intraday bar can look perfect an hour before the close and finish as something else entirely. Wait for the close, or you end up trading a shape that never existed.
Ignoring the Prior Trend
Reversal shapes need something to reverse. A hanging man without a rally behind it is simply a bar with a lower wick, so check the move into the pattern every time.
Treating Colour as the Signal
A red bar after a rally does not make a pattern. Body position, wick length and the close against the previous bar carry the information, and the colour only summarises the last of those.
Stacking Timeframes Carelessly
A bearish shape on the fifteen-minute chart inside a strong daily uptrend fights the larger flow. Check the higher timeframe first, then decide whether the shape works with it or against it.
Forcing Every Bar Into a Name
Most candles fit no pattern at all, and that is fine. Naming everything creates trades where none exist, so let the unnamed bars pass without comment.
Stops and Sizing Around a Bearish Bar
A shape gives you geometry, and geometry gives you a stop. That link turns a pattern from a talking point into something you can actually plan around.
Where the Stop Belongs
Most traders place the stop just beyond the pattern’s extreme. For a shooting star that means a little above the upper wick, and for an engulfing bar a little above the engulfing candle’s high.
Add a small buffer for the spread. A stop resting exactly on the wick tick invites an exit on noise alone, which costs you the trade without telling you anything.
Then check the distance. A very tall bar produces a wide stop, and a wide stop shrinks your position for the same risk in cash terms.
Letting the Stop Set the Size
Fix your risk per trade first, then let the stop distance decide the lot size. Never reverse that order, because a fixed lot with a variable stop makes your risk wander from trade to trade.
Long-wicked bars therefore lead to smaller positions. That result feels wrong to many traders, yet it keeps every trade equal in the only unit that matters.
Choosing a Target That Already Exists
Aim at a level the chart drew for you. The prior swing low, a session low or an old breakout point all give you a target other traders can see.
Compare that distance with your stop before you enter. When the ratio looks poor, skip the trade rather than shifting the stop closer to fix the arithmetic.
Bearish Pattern Quick Reference
Keep this table beside your chart while the family becomes familiar. Each row states the geometry, not an outcome.
| Pattern | Bars | Defining geometry |
|---|---|---|
| Shooting star | 1 | Small body low in range, long upper wick, after an advance |
| Hanging man | 1 | Small body high in range, long lower wick, after an advance |
| Gravestone doji | 1 | Open and close together at the low, long upper wick |
| Bearish marubozu | 1 | Bearish body with almost no wicks at either end |
| Bearish engulfing | 2 | Bearish body fully covers the previous bullish body |
| Dark cloud cover | 2 | Opens above, closes below the previous body’s midpoint |
| Bearish harami | 2 | Small body sits inside the previous large bullish body |
| Evening star | 3 | Big bullish bar, small bar, bearish bar into the first body |
| Three black crows | 3 | Three strong bearish bars, each closing near its low |
Notice what the table never lists: a probability. Geometry describes the past, and no row here says a word about the next session.
When Bearish Patterns Fail
Failures teach faster than textbook examples. Below, a tidy three-bar top completes on an hourly chart, and buyers reclaim the whole shape within a few hours.
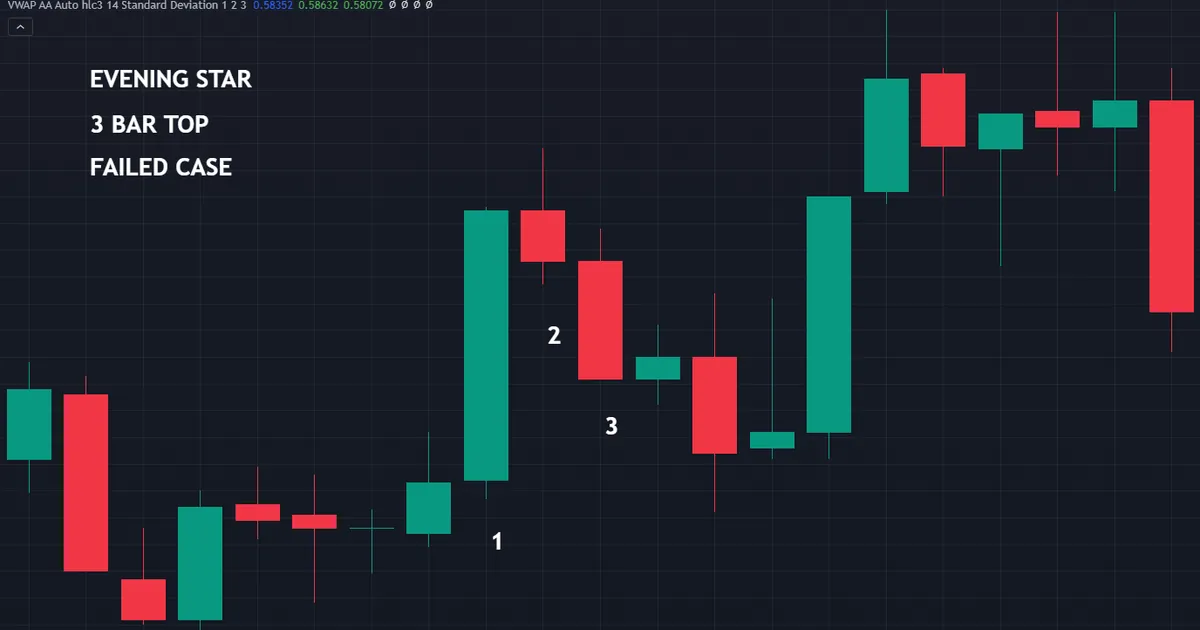
Several routes lead to that same picture. Each one leaves a clue you can check beforehand.
The Level Gives Way
Sometimes the level itself breaks. Buyers absorb the rejection, take price through the old high, and the wick that looked so decisive becomes part of the base for a fresh leg up.
News Overrides the Chart
A data release or a central bank line can wipe out any candle story in seconds. Check the calendar before you plan around a shape near a scheduled event.
The Timeframe Was Too Small
Patterns on very short charts form constantly, and most of them describe noise. Move up a timeframe or two, and the same reading order produces far fewer signals with far more context.
Only Half the Definition Matched
Traders often relax a definition until any bar qualifies. A shooting star with a stubby wick, or an engulfing bar that covers only part of the body, no longer describes what the name claims.
The Move Had Already Happened
Late patterns appear after most of the move finished. By then your stop sits far away and the room to the next level has shrunk, which ruins the arithmetic even when the shape reads well.
The Pattern Simply Did Not Matter
Research into candlestick shapes has produced mixed results, and any consistent edge tends to fade once costs enter the sum. Our page on whether candlestick patterns work reviews that evidence honestly.
Related Concepts to Study Next
The bearish family makes most sense beside the wider candlestick toolkit. Start with the orientation guide, then pick the individual shapes you meet most often.
Our overview of candlestick patterns explained covers the families end to end, including the bullish mirrors of everything above. Browse our candlestick indicators archive when you want a tool that marks these shapes automatically.
Then pair the shapes with levels. A named bar at a level you drew yesterday tells a story; the same bar in open space rarely tells you anything worth risking money on.
Keep a record of every bearish setup you take. A journal with the pattern name, the level, the timeframe and the outcome turns nine names into a personal reference far more useful than any list.
FAQ
What are bearish candlestick patterns?
They are candle shapes that record sellers taking control of a session or a short run of sessions. The body closes below the open, and the close usually finishes nearer the low than the high. They describe what happened, not what comes next.
Which bearish pattern should a beginner learn first?
Start with the bearish engulfing bar and the shooting star. Both use simple geometry you can check in seconds, and both appear often enough on daily charts to give you plenty of practice at spotting them.
Do bearish patterns work better on some timeframes?
Longer timeframes produce fewer shapes with more context behind each one. Very short charts produce many shapes, and most of them describe ordinary noise rather than a shift in control. Daily and four-hour charts suit this family well, mainly because each bar covers a whole session of real activity.
How do I confirm a bearish pattern?
Wait for the following bar. A close below the pattern’s low keeps the story alive, while a close back above its high says buyers rejected the idea. Confirmation costs entry price and removes a lot of guesswork.
What is the difference between a hanging man and a shooting star?
Both follow an advance, but the wick sits on opposite ends. A hanging man has a long lower wick with the body near the top, while a shooting star has a long upper wick with the body near the bottom.
Can I trade bearish patterns on their own?
Most traders find they need more than the shape. Combine the pattern with a level that already mattered, a prior trend and a plan for the next bar, then size the trade so a poor outcome costs little. Results are not guaranteed; past performance is not indicative of future results.
External references
- For background on this concept, see Dark Cloud Cover at Investopedia.
- For broader market context, see Evening Star Pattern at Corporate Finance Institute.

About the author
Written by Dominic Walsh, a Forex trader and MT4/MT5 indicator, Expert Advisor and script developer. Every tool on forexmt4systems.com is tested on live charts before release and ships with ready-to-use compiled MT4 (.ex4) and MT5 (.ex5) files. Learn more about the trader and developer behind this site.
How we build, test and correct every tool: Editorial & Testing Policy. Trading carries risk; see the disclaimer.