
RTM trading, short for Read The Market, is a supply-and-demand method built around bases, engulfing moves, and pattern entries like the Quasimodo. It teaches you to read where price left unfilled orders and to trade the return to those zones. So this guide walks you through the core RTM trading ideas, how they connect to smart money concepts, and how to enter with control.
By the end you will spot an RTM base, grade its quality, and plan an entry with a tight stop and a clear target. We keep the rules practical and the examples realistic, so you can test the approach on your own charts before you risk a cent.
What Is RTM Trading?
RTM trading is a pure supply-and-demand approach to the market. The name Read The Market captures the goal: read where big orders entered, and expect price to react when it returns there. So instead of indicators, RTM leans on raw price structure, zones, and the footprints that strong moves leave behind.
The method grew from the supply-and-demand community, and traders refined it into a named toolkit of bases, engulfs, and patterns. It shares DNA with smart money concepts and with the delivery ideas of Michael Huddleston, the Inner Circle Trader (ICT). Yet RTM keeps its own vocabulary, so the two overlap without being identical.
Read the chart below to see the core idea. Price rallies away from a tight base, leaving a demand zone behind. Later it returns to that base, reacts, and pushes higher again. We mark the base and the reaction so the pattern stands out. Once you have seen a few of these, the zones start jumping off the chart.
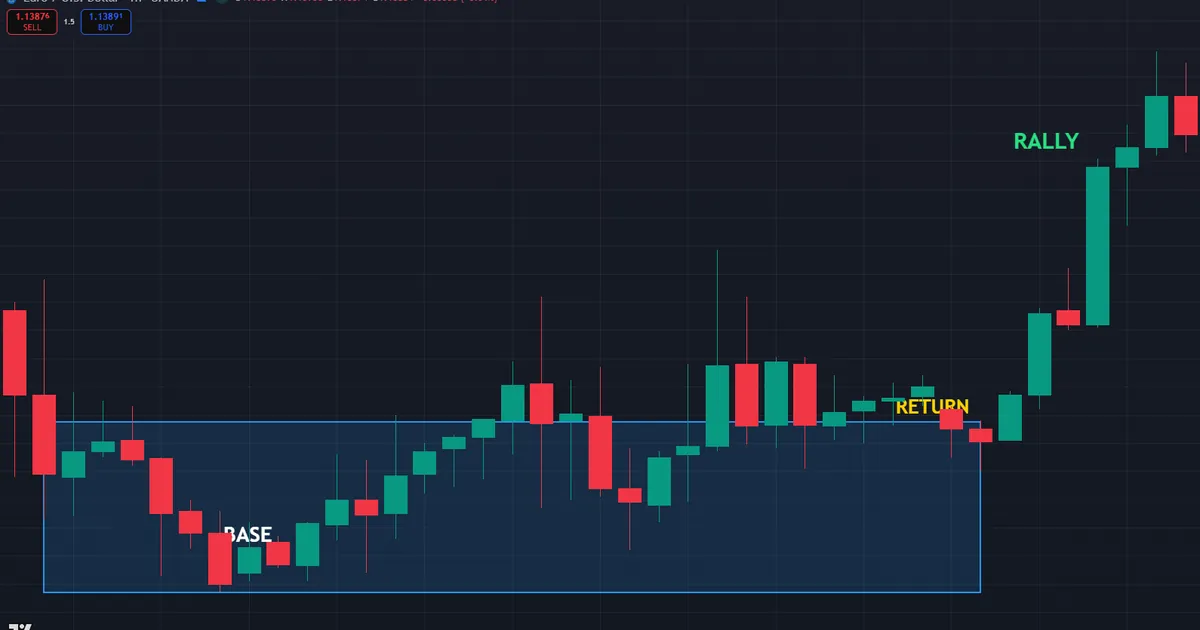
Notice what a base really is. It is a small cluster of candles where price paused before a strong move. That pause hides unfilled orders, and the strong move proves those orders had force. So the base becomes a zone worth watching on the return.
RTM also names the shape of each move around a base. A rally into a base and out again forms a continuation, while a rally into a base and a drop out forms a reversal. So the labels rally-base-rally and drop-base-drop describe trend zones, and rally-base-drop describes a turn. Learning these names keeps your reading consistent from one chart to the next and speeds up how fast you spot the right zone to trade.
RTM and Smart Money Concepts
RTM and smart money concepts describe similar behavior with different words. Both track liquidity, both trade zones, and both wait for price to return to an origin. Our comparison of an order block versus a supply and demand zone shows how close the two really are.
The main difference is emphasis. Smart money concepts frame zones through order flow and stop hunts, while RTM frames them through base quality and refined entries. So a trader fluent in both can pick the sharper tool for each setup. Reading a zone as a discount buy or a premium sell, covered in our note on premium and discount, applies cleanly in either language.
You do not need to choose one camp. Many traders use RTM to draw precise zones and smart money concepts to judge the liquidity behind them. So the base tells you where price left orders, and the stop-hunt read tells you why price should return. Combining the two often produces a tighter entry than either method alone.
The Core RTM Building Blocks
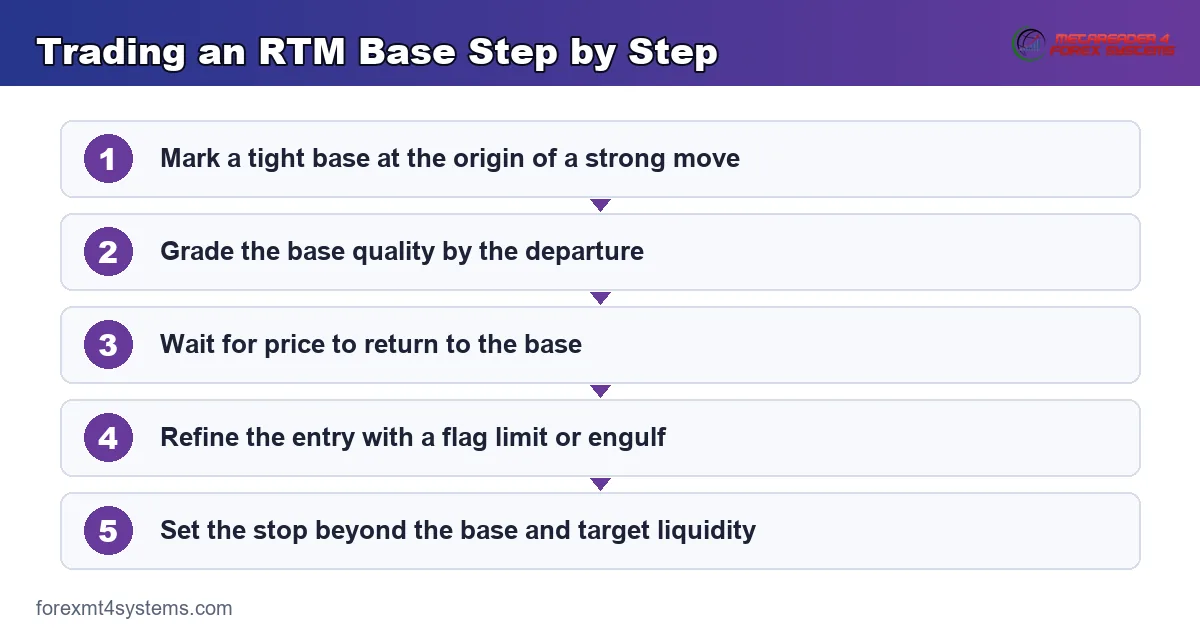
RTM rests on a handful of repeatable structures. Learn the four below and most setups become easy to read.
- The base. A tight cluster of candles before a strong move, marking where orders entered and price left an imbalance.
- The engulf. A candle that fully engulfs prior candles, signalling a sharp shift in control at a zone.
- The Quasimodo. A reversal pattern with a failed high or low, trapping traders before price reverses hard.
- The flag limit. A refined entry where a small base forms after a break, offering a tight zone to join the move.
The branded graphic below stacks these blocks so you can memorize them. Notice how each one marks a spot where orders shifted control. So they all answer the same question: where did the strong hands act?
Reading a Base and Its Quality
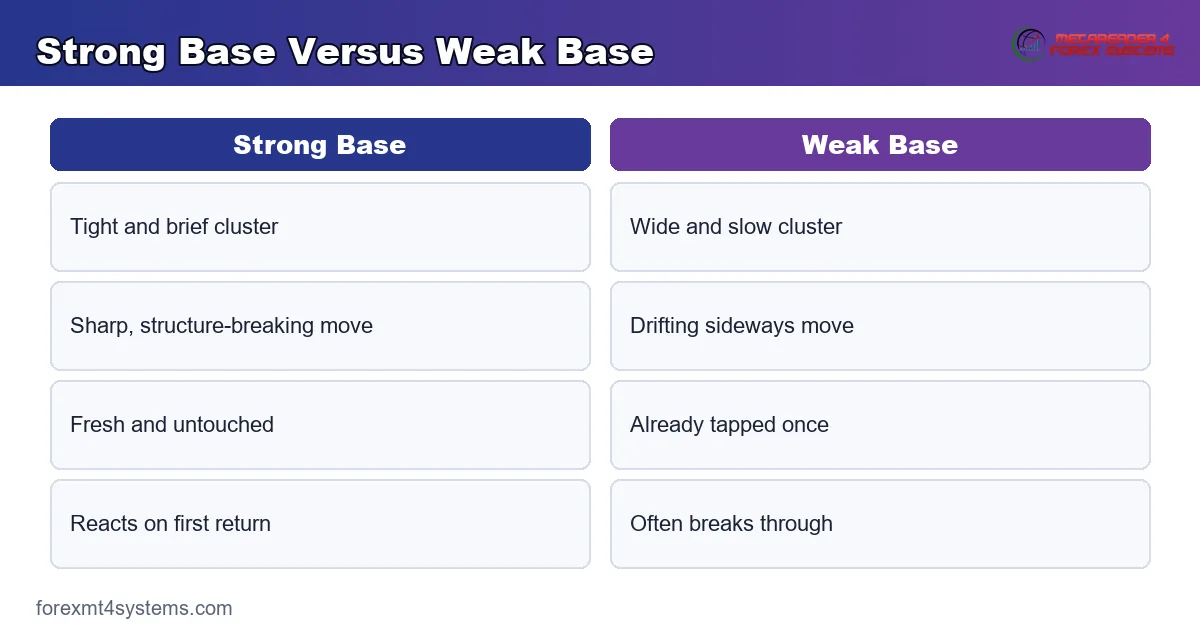
Not every base is equal, so grading matters. A strong base is tight, brief, and followed by a powerful move that breaks structure. A weak base is wide, slow, and drifts sideways. So favor fresh bases with a sharp departure, since they mark the clearest imbalance and tend to react on the first return.
Three questions grade a base fast. First, how tight was the pause before the move? Second, how sharp was the departure that followed? Third, has price already returned to the zone once? So a tight base, a violent exit, and an untouched return give you the highest-quality setup. Any weakness in those answers lowers the grade and your conviction.
Reading the Engulf
The engulf marks a sudden shift in control. One candle swallows the range of the prior candles and closes strongly against them. So an engulf inside a zone tells you buyers or sellers just overwhelmed the other side. Traders use it both as a base origin and as a refined trigger on the return, which makes it one of the most flexible RTM blocks a trader can use on the whole chart.
Reading the Quasimodo Pattern
The Quasimodo, or QM, is one of the sharpest RTM reversals. It prints a false break of a prior high or low, traps the crowd, and then reverses through the structure. Our full guide to the Quasimodo pattern breaks down the exact shape and entry. So learn it well, because it appears at many major turns.
The QM works because it feeds on trapped traders. The false break lures breakout buyers or sellers into the market, and their stops then fuel the reversal. So a Quasimodo that forms right at a fresh base doubles the edge, since a trapped crowd sits directly above an unfilled order zone. That combination often produces the cleanest RTM entries on the chart.
Where RTM Fits Your Top-Down Workflow
RTM gives you the zone; your bias gives you the direction. So the two must work together. Start with higher-timeframe structure, then mark the fresh bases, and finally refine the entry on a lower chart.
First, set direction from the daily and four-hour charts. A rising market biases you toward buying fresh demand bases rather than selling supply. Second, mark the origin of the last strong move, since that base is your point of interest. The full order block trading guide shows how to frame those origins, and the logic transfers directly to RTM bases.
Third, drop to a lower timeframe as price returns to the base. A flag limit or an engulf inside the zone refines the entry and tightens the stop. So the trade stacks three edges: correct bias, a fresh base, and a refined trigger on the return. The wider library of smart money indicators for MT4 and MT5 can flag zones while the method still feels new.
Refining the Entry With a Flag Limit
The flag limit, or FL, sharpens a wide base into a precise entry. After price breaks out and pulls back, a small base often forms at the edge of the move. So instead of buying the whole thick zone, you buy the tight flag limit at its edge. That refinement cuts the stop distance and lifts the reward-to-risk ratio.
The trade-off is fill risk. A tighter flag limit sometimes sits so precise that price reacts just before it, leaving you behind. So balance precision against certainty, and accept the occasional missed trade as the cost of a smaller stop. Over many setups, the tighter entries usually pay for the ones they skip.
Sizing the Position for the Zone
A tight RTM zone lets you risk less per trade. Because the stop sits just beyond the base, a small price distance covers the whole idea. So calculate the lot size from that distance rather than a fixed guess. A free position size calculator turns the stop distance and your risk percent into an exact lot, which keeps every RTM trade inside your plan.
Worked Example: An RTM Demand Buy on EURUSD
Now make the idea concrete with a long setup. EURUSD trends up on the four-hour chart, so bias points up. The plan is to buy a fresh demand base that produced a strong rally and structure break. The chart below shows the base, the return, and the entry.
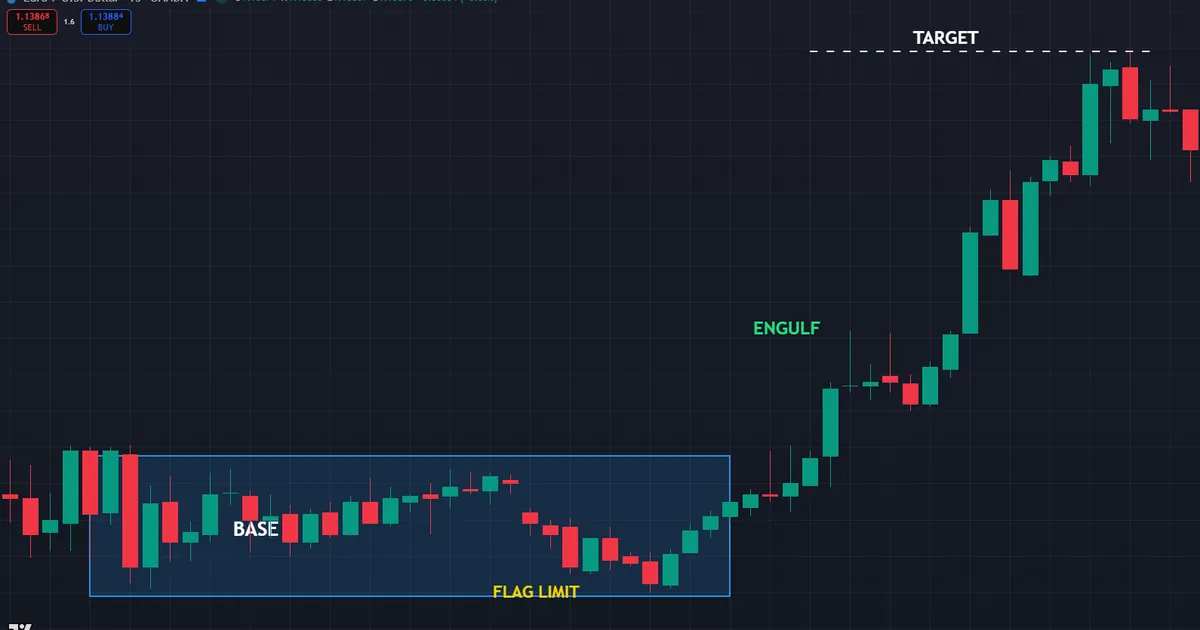
Earlier in the session, price paused in a tight base, near the 1.1400 to 1.1410 area, then rallied hard and broke the prior high. That sharp departure marks a quality demand zone. So you draw the base and wait for price to return rather than chasing the rally.
Later, price pulls back into the base and forms a small flag limit at its upper edge, near 1.1406. An engulfing candle then fires inside the zone. So a long enters on that engulf, with a stop just below the base, roughly 12 pips of risk. Next, price rallies toward the liquidity resting above the recent high, near the 1.14358 area. Notice the sequence never changes: strong move, fresh base, refined return.
Manage the trade with the zone in mind. Once price leaves the base and prints a new high, lift the stop toward breakeven and bank part of the position. So a return to the zone can no longer turn the winner into a loser. The remaining size then aims for the next liquidity pool if momentum holds through the session.
A Bearish RTM in Brief
Flip every rule for a short and the logic holds. GBPUSD trends down, so bias points down. Price bases briefly, drops hard, and breaks a prior low, leaving a fresh supply zone above. Then price rallies back into that base, prints a Quasimodo high, and rejects. So a short enters on the reversal, with a stop above the base, and price delivers back toward the recent low. The mirror setup works exactly like the long, only upside down.
The same grading applies to the short. A tight supply base with a violent drop and an untouched return gives the strongest sell. So check the departure and the freshness before you commit, exactly as you would for a demand buy. Consistency across both directions keeps the method simple and repeatable under live market pressure, which matters most when a fast move tempts you to abandon your own rules.
Download the complete indicator database
Put these concepts on your charts. One email unlocks the full library of 1,380+ indicators with compiled MT4 and MT5 files, plus my TradingView scripts. No paywall, no spam, unsubscribe any time.
Get free access to my indicator database
One email unlocks 1,380+ free MT4, MT5 and TradingView indicators — the complete library. No single-tool download; you get the whole database.
Common RTM Mistakes and How to Fix Them
The method reads cleanly, yet the same errors repeat. The graphic below collects four traps we see most, and the fixes follow beneath it. Each fix costs nothing but discipline.
Trading Every Base You See
Not every base deserves a trade. Weak, wide bases with a slow departure often fail on the return. So grade each zone first, and take only the tight bases that produced a sharp, structure-breaking move. Selectivity beats activity here.
Ignoring Higher-Timeframe Bias
A demand base means little if the higher timeframe points down. So check the trend above before you buy any zone. When the bigger picture disagrees, the base often breaks and price keeps falling straight through it.
Entering the Whole Thick Zone
A wide base tempts a lazy entry at its far edge. That entry hands you a huge stop and poor reward. Rather than buy the whole zone, wait for a flag limit or an engulf to refine the trigger. The refinement is where RTM earns its edge.
Reusing a Spent Zone
A base weakens each time price taps it. So the first return offers the cleanest reaction, and later touches grow unreliable. Once price has mitigated a zone, drop it from your plan and hunt a fresh base instead of hoping the old one holds again.
Pre-Trade RTM Checklist
Run this list before you act on any zone. A few seconds here filters most impulsive entries. Treat any unchecked box as a reason to wait for a cleaner setup.
- Higher-timeframe bias marked on the daily and four-hour charts.
- A fresh base identified at the origin of a strong, structure-breaking move.
- Base quality graded as tight and sharp, not wide and slow.
- A flag limit or engulf present inside the zone on the return.
- Stop planned just beyond the base, target at the next liquidity pool.
- Lot size calculated from the stop distance and your risk percent.
- The zone untouched, since the first return reacts best.
Honest Limitations: When RTM Fails
Study the failure case as hard as the winner. Here is a common one. Price leaves a clean demand base, returns to it, and prints a promising engulf. Everything looks textbook. Then price stalls, rolls over, and slices straight through the base without a real bounce. The chart below shows that break.
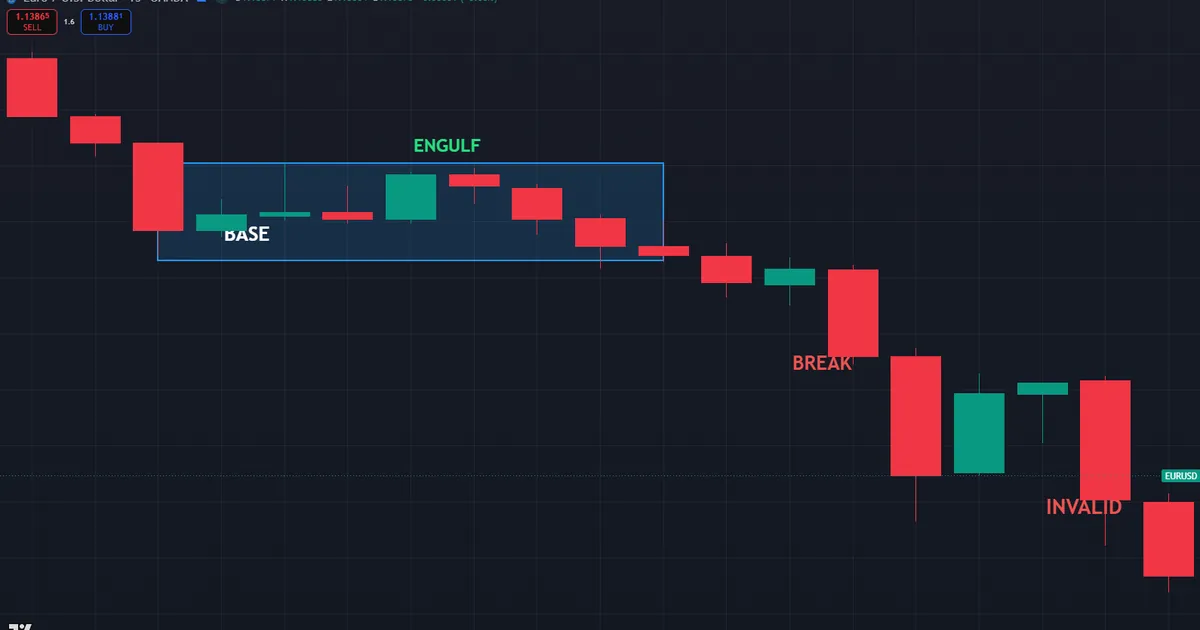
What went wrong? Usually the context. The higher timeframe still pointed down, so the base sat against the dominant trend. Hence the invalidation rule that limits the damage. Once price closes beyond the base, the idea is dead. Exit at once, and never widen the stop to hope for a return.
Zones Break in Strong Trends
Strong trends run through zones. A powerful move treats a counter-trend base as a speed bump, not a wall, and drives right through it. So respect the trend and favor bases that face the same way price is already heading. A base with the trend behind it holds far more often than one against it.
News Can Void a Base
News is a second common trap. A rate decision or an inflation print can blow through any zone and never return. So a base carries less weight around major scheduled news. Check the calendar before you lean on a zone, and lower your trust when a big release looms nearby.
Thin holiday sessions carry the same warning. Low participation distorts the usual rhythm and produces reactions that fade fast. So treat both news candles and quiet holidays as lower-quality conditions for RTM. Demand extra confirmation, or simply stand aside until normal delivery resumes across the major sessions.
No Fixed Success Rate Exists
Be blunt here. No reliable success percentage exists for RTM, and anyone quoting one is guessing. Outcomes hinge on your base grading, your bias, and your discipline. Qualitatively, fresh bases traded with the higher-timeframe trend hold up far better than counter-trend zones. That direction of effect is the only honest claim worth making.
Reading RTM Across Timeframes
RTM scales up and down the chart, and each timeframe frames a different trade. On the daily, a base can anchor a swing that runs for days. On the fifteen-minute, a base can trigger a scalp that lasts an hour. So the grading rules stay identical while the horizon shifts with the chart you choose.
Use the layers together rather than in isolation. A daily base sets the bias, a one-hour base narrows the zone, and a fifteen-minute engulf triggers the entry. When the bases nest cleanly, the trade carries real weight. When a lower base fights the higher trend, trust the bigger picture and wait for a zone that agrees with it.
Related SMC Concepts to Study Next
A sensible study order helps here. First, practice marking bases on replayed charts until the quality grade feels automatic. Then add bias and refined entries, and only then trade RTM live with small size. So build the habit slowly, one base at a time, rather than forcing every pause into a zone.
RTM sits inside a web of sibling ideas worth your next reading hour. The zones you grade here overlap tightly with order blocks, so the two vocabularies enrich each other. A tidy roundup of common SMC mistakes will also sharpen your zone discipline, since many RTM errors mirror the ones smart money traders make. Master the base, the refinement, and the bias together, and most charts start reading like a map of orders instead of noise.
One habit accelerates the whole process. Keep a folder of screenshots that pair a base that reacted with a base that broke, each from the same pair. Over a few weeks your eye learns the small differences in tightness and departure that separate the two. So the grade becomes instinct, and you stop hesitating when a clean zone finally appears in real time.
FAQ
What is RTM trading in simple terms?
RTM, or Read The Market, is a supply-and-demand method that trades the return to zones where strong orders entered. It uses bases, engulfs, and patterns like the Quasimodo. So it reads raw price structure rather than indicators.
What is a base in RTM?
A base is a tight cluster of candles that formed just before a strong move. It marks where orders entered and price left an imbalance. So traders watch for a reaction when price returns to that base.
How is RTM different from smart money concepts?
Both trade zones and liquidity, so they overlap heavily. RTM emphasizes base quality and refined entries like the flag limit. Smart money concepts emphasize order flow and stop hunts. The two languages describe similar behavior.
What is a flag limit?
A flag limit is a refined entry inside a wider zone. After a breakout and pullback, a small base forms at the edge of the move. So you enter that tight flag limit rather than the whole thick zone, which cuts the stop.
Which timeframe works best for RTM?
RTM works across timeframes, though many traders mark bases on the four-hour and refine entries on the fifteen-minute. Anchor the zone to higher-timeframe bias first. Then the lower-timeframe entry carries more weight.
Can I rely on RTM by itself?
No single method should stand alone. Pair the zones with higher-timeframe bias, base grading, and strict risk control. Always manage risk on every trade. Results are not guaranteed; past performance is not indicative of future results.
External references
- For background on this concept, see Supply and Demand at BabyPips Forexpedia.
- For broader market context, see Price Discovery at Investopedia.

About the author
Written by Dominic Walsh, a Forex trader and MT4/MT5 indicator, Expert Advisor and script developer. Every tool on forexmt4systems.com is tested on live charts before release and ships with ready-to-use compiled MT4 (.ex4) and MT5 (.ex5) files. Learn more about the trader and developer behind this site.
How we build, test and correct every tool: Editorial & Testing Policy. Trading carries risk; see the disclaimer.