
The quasimodo pattern (QM) is a reversal structure that pairs a liquidity sweep with a break of market structure, and it hands you a precise entry price: the left shoulder. Traders also call it the over and under pattern. So after this guide, you will be able to map its five points, set the entry at the quasimodo level (QML), and separate it from a classic head and shoulders.
First, we define the anatomy piece by piece. Then we cover the QML entry rules, a bearish EURUSD example with exact prices, and the bullish mirror. Also inside: the head-and-shoulders comparison and the conditions that break the pattern.
What Is the Quasimodo Pattern?
Picture an uptrend running out of fuel. Price posts a high, pulls back, and then pushes to a higher high that sweeps the buy stops resting above the first peak. Instead of continuing, it collapses through the prior pullback low, printing a lower low. Next, price rallies one more time — yet only back to the level of the first peak, forming a lower high. That first peak is the left shoulder, and its price is the quasimodo level.
Its name comes from the shape. One shoulder sits higher than the other, so the figure looks hunched — hence “Quasimodo,” after the bell-ringer of Notre-Dame. Plainly put, the structure encodes two events at once: a grab of liquidity beyond the old extreme, then a failure of the trend’s structure sequence. Also note that the pattern needs a prior trend; without one, the labels have nothing to reverse. Meanwhile, bullish versions mirror everything at a market bottom.
A Bullish Quasimodo on GBPUSD
The chart below shows the bullish version on the GBPUSD 1-hour chart, with all five points and the QML marked.
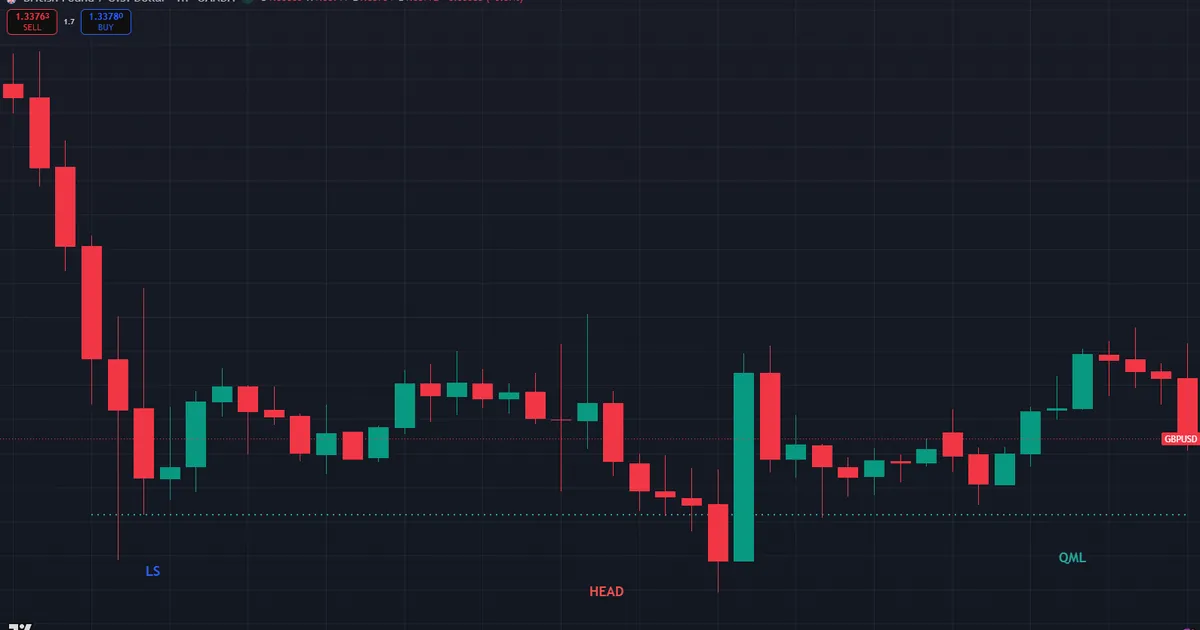
Follow the labels on that chart. A downtrend printed a left-shoulder low at 1.33660, and sell stops gathered beneath it. The head then swept them with a push down to 1.33546 — about 11 pips under the shoulder — before buyers took control. Price broke the pullback high, confirming the shift, and later sank back to 1.33655, within half a pip of the QML. The bounce from that retest is the entry this pattern exists to deliver.
The Five Points of the QM, Step by Step
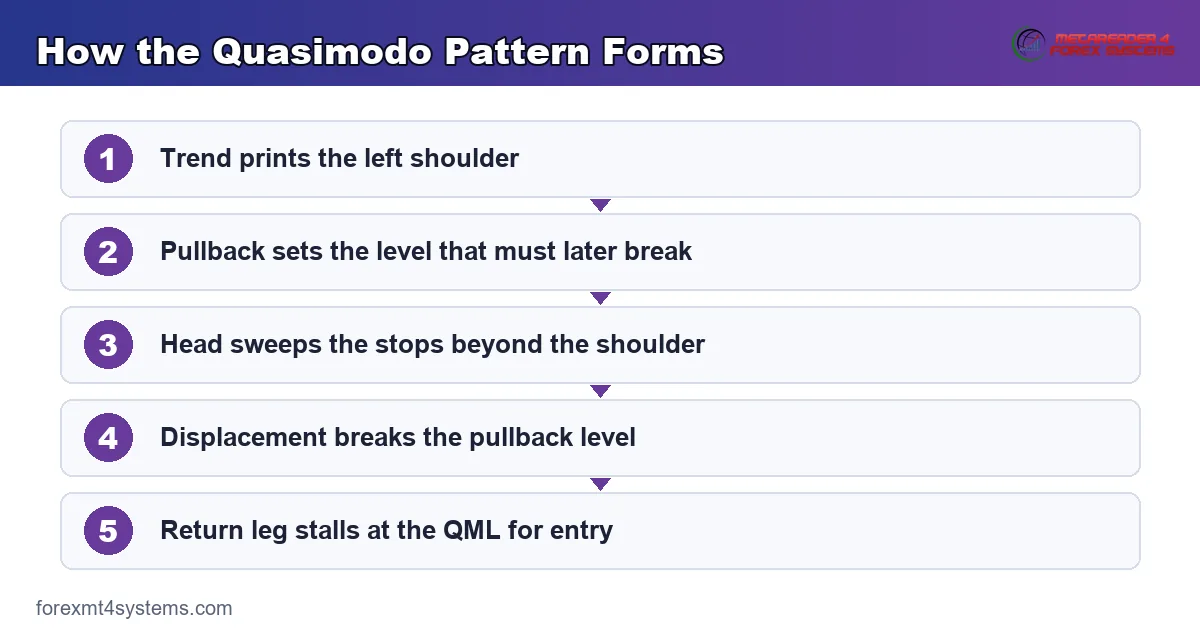
Every bearish quasimodo contains the same sequence. So label the points on your chart in this order. Marked-up screenshots of past charts make excellent practice material here.
- Left shoulder. A swing high in an established uptrend. Buy stops accumulate above it.
- Pullback low. The higher low that follows. Also the structure that must later break for the pattern to exist.
- Head. A higher high that trades above the left shoulder — the liquidity sweep. Strong rejection here is the first warning.
- Lower low. Price displaces down through the pullback low. Now the uptrend’s structure is broken.
- Return to the QML. Price rallies back into the left-shoulder level and stalls, printing a lower high. This is the entry zone.
Point four deserves emphasis. Without a decisive break of the pullback low, there is no market structure shift, and without that shift the head is just a new trend high. So confirm the break with a full candle close, not a wick. Also check the quality of the down move: displacement with large-bodied candles and a fresh imbalance carries more conviction than a slow drift.
Why the Pattern Exists: Whose Orders Build It
Each point maps to a crowd decision, and the bearish version reads like this. Above the left shoulder rest buy stops — the exits of shorts and the entries of breakout traders. The head is where those orders fill against selling interest, which is why rejection there tends to be sharp. Then the break of the pullback low traps everyone who bought the high.
The return to the QML completes the story. Trapped longs from the head now sit underwater, and the rally toward their entries offers an exit near break-even; their selling caps the move at the old shoulder. Meanwhile, fresh shorts add limit orders at the same price. Two flows, one level — hence the lower high that defines point five. Understand this mechanic and the pattern stops feeling like shapes on a chart; it becomes a map of who is stuck where.
How to Trade the Quasimodo Level (QML)
The QML entry is what makes the pattern practical. Instead of chasing the breakdown, you sell a pullback into a level where trapped longs from the head sit underwater.
- Wait for all five points to print. No anticipating point five — the return leg must actually reach the left-shoulder level.
- Place a sell limit at the QML, or wait for lower-timeframe rejection there if you prefer confirmation.
- Set the stop loss above the head. Indeed, that extreme is the invalidation; a close beyond it means the sweep failed to matter.
- Target the lower low first, then the next pool of sell-side liquidity below it.
- Size the position from the stop distance with a position size calculator, keeping risk to a fixed fraction of the account.
Aggressive traders sometimes split the entry: half at the QML, half deeper toward the head. Still, the stop stays in one place — above the head — because that is where the idea dies.
Reading the Return Leg
Not every rally into the QML deserves a sell. A healthy return leg looks corrective: overlapping candles, shrinking bodies, and pauses along the way — tired buying, not fresh demand. By contrast, a return built from wide-bodied impulsive candles warns that buyers found real interest below, and the level may not hold. Watch the approach speed too. Price that crawls into the QML over many bars gives sellers time to layer orders; price that spikes into it often spikes through it. Grade the leg before the fill, and skip the setups where the approach looks like an attack.
Worked Example 1: EURUSD Bearish Quasimodo
Say EURUSD trends up on the 1-hour chart and prints a left shoulder at 1.0930. Price pulls back to 1.0895, then rallies to 1.0952 — a head that sweeps the buy stops above 1.0930. Rejection follows fast. Then a displacement candle closes through 1.0895 and runs to a lower low at 1.0868.
Now the return leg. Price climbs back to 1.0929, a few pips under the left-shoulder level, and stalls. A sell limit at 1.0930 fills, with the stop at 1.0957 — five pips above the head — for 27 pips of risk. First target is the lower low at 1.0868, worth 62 pips, roughly 2.3R. Second target is the sell-side pool near 1.0820, where an older session low rests.
Timing improved the odds here as well. Indeed, the sweep printed during the London kill zone (2:00-5:00 New York time), and the QML retest arrived in the New York morning — the windows where engineered runs concentrate.
Manage the trade in stages once it moves. A partial exit at the lower low banks the structural target, the stop moves to entry, and the remainder works toward the deeper pool. If the return leg stalls just short of 1.0930 and rolls over early, the limit order simply never fills — accept the miss. Chasing the market down after a missed QML fill converts a defined-risk pattern into an emotional market order with no reference behind it.
Worked Example 2: The Bullish Mirror, Step by Step
Now build a long from scratch. Say EURUSD trends down on the 1-hour chart and prints a left-shoulder low at 1.13950. A bounce stalls at the pullback high of 1.14150, and the head then sweeps down to 1.13820 — 13 pips below the shoulder. Displacement follows: a wide candle closes above 1.14150, breaking structure, and the move extends to 1.14230.
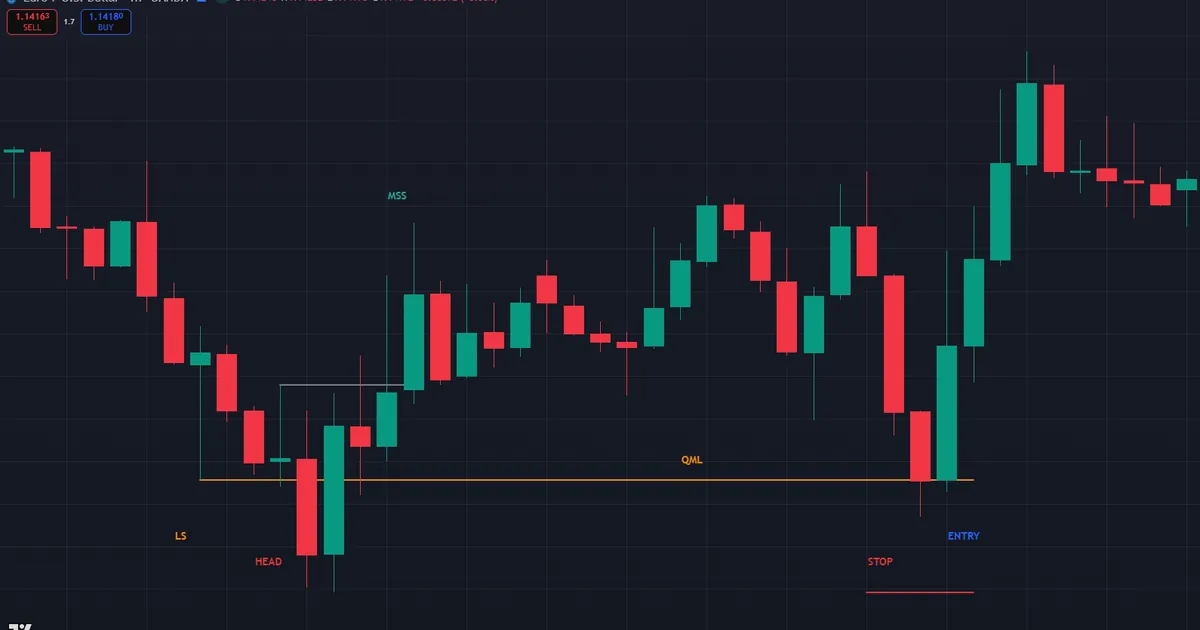
The return leg drifts back toward the QML. A buy limit at 1.13950 fills on the tap, with the stop at 1.13795 — below the head — for about 15 pips of risk. First target is the recent high at 1.14230, worth 28 pips, roughly 1.8R. Second target is the buy-side pool near 1.14350, where older highs cluster, stretching the trade toward 2.5R.
Work the sequence in the same order every time: shoulder, sweep, shift, retest. Skipping straight to the retest without the confirmed shift is the fastest way to buy a falling market. Compare this long with the GBPUSD chart at the top of the guide and the anatomy matches point for point, only the prices differ.
One nuance separates good bullish QMs from forced ones: the sweep should look like a rejection, not a resting place. On the GBPUSD hero chart, price spent minimal time below 1.33660 before snapping back — the head at 1.33546 printed and reversed within a few candles. When price instead settles beneath the old low and builds bars there, the market is accepting lower prices, and no shoulder retest will save the long.
Quasimodo vs Head and Shoulders
The two patterns share a silhouette, yet they trade very differently. Truly, four differences matter in practice.
First, consider symmetry. A textbook head and shoulders has two shoulders at similar heights; the quasimodo demands that the right-side rally stop at the left shoulder after a lower low — the over-and-under geometry. Second, the entry differs. Head-and-shoulders traders sell the neckline break, which arrives late and often retests against them; QM traders sell the retrace into the QML, higher up, with a tighter stop. Third, the reference level: the QM has no neckline requirement at all, since its key price is the left shoulder. Hence the QM’s earlier entry and smaller initial risk. Fourth, the reading itself. Head and shoulders fades momentum, while the quasimodo explicitly frames the head as a stop hunt above the old high.
Neither pattern outranks the other universally. Instead, think of the QM as the smart-money reading of the same crowd behavior, tuned for an earlier entry. A practical consequence follows from the geometry: because the QM entry sits higher than the neckline entry, the same target produces a larger multiple of the initial risk. The price of that improvement is a stricter set of preconditions — the sweep and the lower low must both print before the level means anything.
Download the complete indicator database
Put these concepts on your charts. One email unlocks the full library of 1,380+ indicators with compiled MT4 and MT5 files, plus my TradingView scripts. No paywall, no spam, unsubscribe any time.
Get free access to my indicator database
One email unlocks 1,380+ free MT4, MT5 and TradingView indicators — the complete library. No single-tool download; you get the whole database.
Where the QM Fits the SMC Workflow
Within smart money concepts (SMC), the quasimodo is a packaged sequence: sweep, shift, retrace. The head is the raid — the full guide to liquidity sweep trading covers that leg in depth. Next, the drop through the pullback low is the structural turn, and the label you give it matters; see BOS vs CHoCH for the terminology distinction. Then the QML retest is simply the retracement leg that every reversal sequence produces.
Context decides which QMs deserve attention. A bearish QM printing at a higher-timeframe premium level, after a run on equal highs, aligns with the broader flow. Also, smart money indicators can flag sweeps and structure breaks automatically, which makes scanning pairs for the five-point sequence far quicker. Timing helps too, because QMs completed during the London or New York sessions tend to be cleaner than those formed in the overnight lull. So build a watchlist routine around those windows.
Timeframe Pairing for the Entry
Map the five points on the 1-hour or 4-hour chart, then refine the retest on the 5- or 15-minute chart. The lower timeframe often prints its own miniature shift right at the QML, which lets the stop tuck behind a small swing instead of the full head. That refinement can double the reward-to-risk arithmetic without changing the idea. Still, keep the invalidation thesis on the pattern timeframe; the trade dies at the head, wherever the refined stop sits.
The GBPUSD chart at the top of this guide illustrates the pairing well. The five points and the QML at 1.33660 all live on the 1-hour chart, yet the retest tap at 1.33655 lasted only a candle or two. A trader watching the 5-minute chart at that moment saw the rejection form in real time — a small shift and a push away from the level — while the 1-hour trader needed the patience to trust a resting limit order. Both approaches work; pick one and stay consistent.
Common Mistakes with the Quasimodo Pattern
Six errors show up in most losing QM journals. Each has a direct correction.
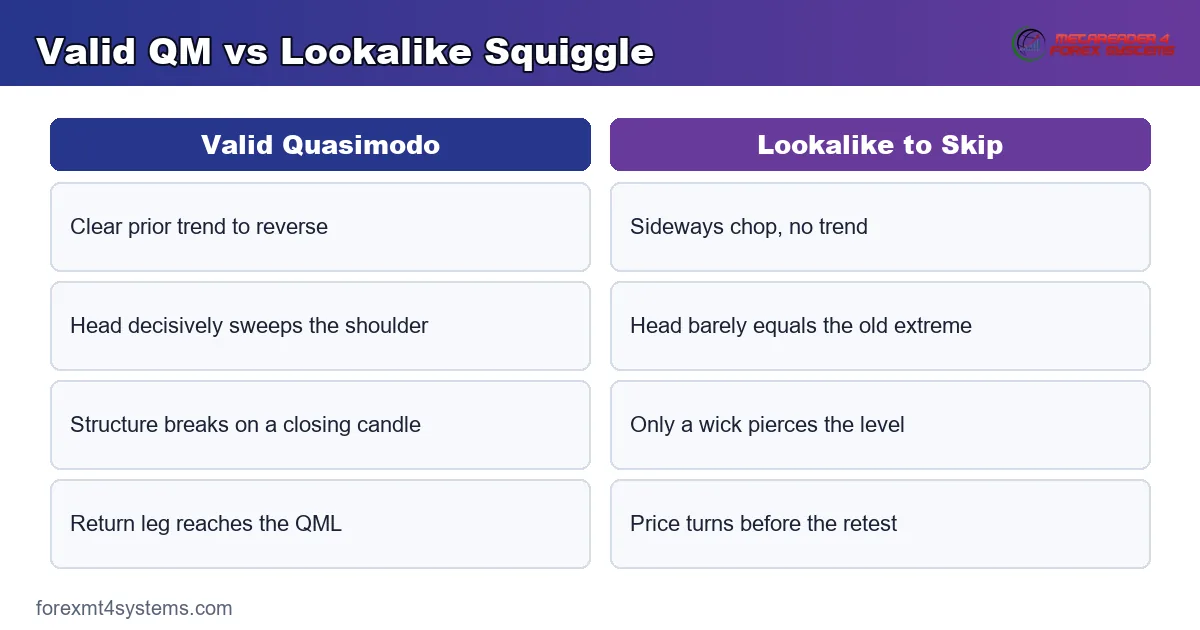
- No prior trend. Range squiggles produce QM shapes that mean nothing. Correction: require a clear trend for the pattern to reverse.
- Anticipating point five. Entering before the return leg reaches the QML trades a guess, not a level. Correction: let price actually reach the shoulder.
- Wick-based structure calls. A wick through the pullback low is not a break. Correction: demand a full candle close with displacement.
- Stops at the QML itself. The level often gets pierced by a few pips before turning. Correction: keep the invalidation beyond the head.
- Ignoring higher-timeframe location. A bearish QM in deep discount fights the bigger flow. Correction: sell premium, buy discount.
- Chasing missed retests. When the return leg never reaches the QML, the setup simply passed. Correction: log it and wait for the next one.
QML Entry Checklist
Confirm every line before the order rests.
- Prior trend visible on the pattern timeframe.
- Head clearly sweeps beyond the left shoulder.
- Structure break confirmed by a candle close, with displacement.
- Return leg actually trades into the QML.
- Higher-timeframe location agrees — premium for shorts, discount for longs.
- Session window active, London or New York preferred.
- Stop placed beyond the head and position size computed.
Score setups against the list rather than treating it as pass-fail theater. Seven yes answers describe the A-grade QM that earns full planned risk. Five or six describe a B-grade setup worth reduced size, and anything below that is practice material, not a trade. The habit also builds a useful archive: after a few weeks, your journal shows exactly which missing line costs the most, and that is where the next month of screen time should go.
Where the Quasimodo Pattern Fails
The QML is not a force field. Sometimes the return leg blows straight through the left shoulder and tags the head — buyers were genuinely in control, and the sweep was absorption. Hence the stop above the head; that price is where the short thesis dies.
Other failure modes are subtler. Ranging markets print QM-shaped squiggles constantly, and most mean nothing because no trend preceded them. Also, shallow return legs are a problem: price sometimes reverses from the lower high without ever touching the QML, leaving limit orders unfilled. News can overwhelm the structure entirely. Spread-heavy pairs can even wick past the level and nick tight stops early. Thus the checklist: prior trend, clean sweep, decisive structural break, and a higher-timeframe reason for the reversal. Without those, the pattern is just five labeled dots.
Be equally honest about statistics. No universal reliability figure exists for the QM, and any source quoting one across all pairs and sessions is selling certainty the market never offers. What you can measure is your own sample: how the pattern behaves on your pair, in your session, with your filters applied. Thirty logged setups tell you more than any percentage found online.
A Failure Walkthrough in Numbers
Here is the losing version, priced out. A bearish QM prints a left shoulder at 1.14650, a head at 1.14780, and a lower low at 1.14400. The return leg reaches the QML, and the sell fills at 1.14650 with the stop at 1.14805. Yet the candles into the level look wrong: overlapping bodies, shallow dips, no supply stepping in. Price grinds through the shoulder, closes at 1.14760, and then runs the stop above the head.
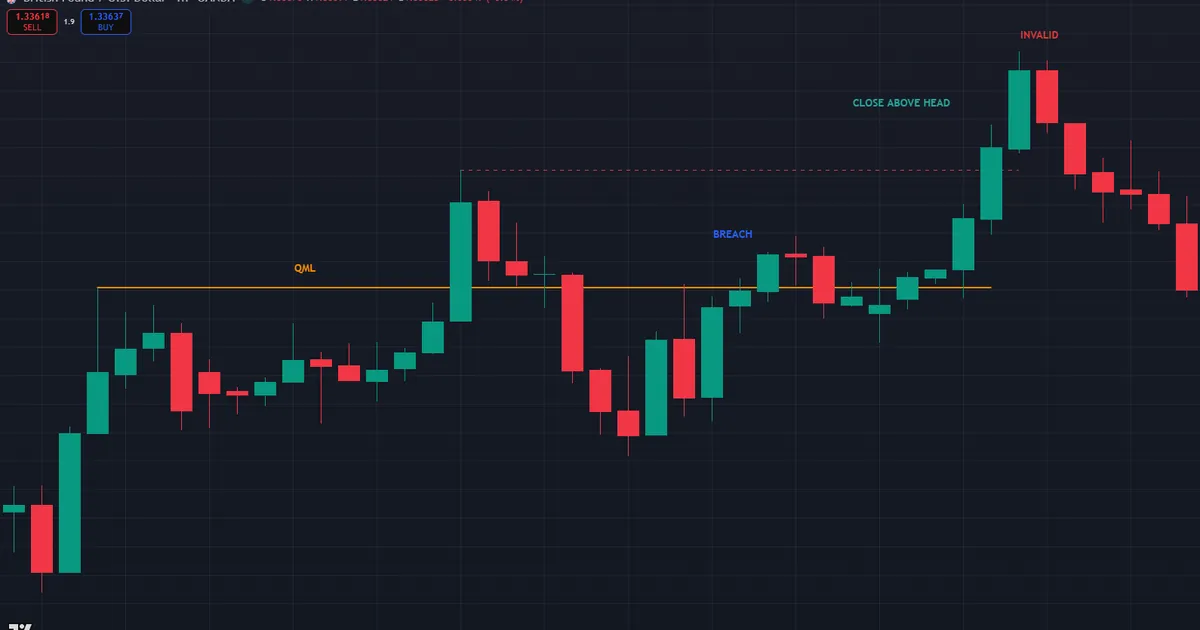
Reading the failure afterward, two tells stood out. The structural break that created the lower low lacked displacement, and the whole pattern sat in the discount half of the weekly range — a short sold into support. The stop above the head kept the loss near one planned unit. Log both tells in the journal; they filter the next dozen setups better than any new indicator would.
Related Concepts
Two nearby ideas complete the QM toolkit. The premium and discount framework decides where a QM is worth trading — shorts belong in the upper half of the dealing range, longs in the lower. Meanwhile, displacement in trading defines the conviction test that point four must pass. Both slot straight into the checklist above, and both explain failures the pattern alone cannot. Study them alongside your last ten QM trades — winners and losers — and note how often location or displacement quality decided the outcome before the entry ever filled. That review usually rewrites a trade plan faster than any new setup would.
FAQ
What is the quasimodo level (QML)?
The QML is the price of the left shoulder — the swing high formed before the head in a bearish pattern. So entries rest there: the return leg into that level offers a lower high with a defined stop above the head.
Is the quasimodo pattern the same as head and shoulders?
No. The QM requires the head to sweep the left shoulder and demands a lower low before entry, and it enters at the left-shoulder retest rather than a neckline break. Plainly, the shapes rhyme while the entry logic and stop placement differ.
What does “over and under” mean in QML trading?
It describes the geometry: price goes over the old high (the sweep) and then under the old low (the structure break). Indeed, that over-and-under sequence separates a QM from an ordinary double top.
Which timeframes work for quasimodo patterns?
The structure appears on all timeframes. Still, most traders map the pattern on the 1-hour or 4-hour chart and refine the QML entry on 5- or 15-minute charts, since higher-timeframe sweeps carry more meaning. Below five minutes, spreads start to distort the geometry.
Where does the stop go on a bullish quasimodo?
Beyond the head — the lowest point of the pattern. On the GBPUSD chart above, the head printed at 1.33546, so a long from the 1.33660 QML carries its invalidation a few pips below 1.33546. A close beyond the head means the sweep failed and the downtrend is back in charge.
How reliable is the quasimodo pattern?
Reliability depends entirely on context: prior trend, quality of the sweep, and strength of the structural break. So treat every QM as a risk-defined idea rather than a certainty. Results are not guaranteed; past performance is not indicative of future results.
External references
- For background on this concept, see Head and Shoulders Pattern at Investopedia.
- For broader market context, see Head and Shoulders Chart Pattern on Wikipedia.

About the author
Written by Dominic Walsh, a Forex trader and MT4/MT5 indicator, Expert Advisor and script developer. Every tool on forexmt4systems.com is tested on live charts before release and ships with ready-to-use compiled MT4 (.ex4) and MT5 (.ex5) files. Learn more about the trader and developer behind this site.
How we build, test and correct every tool: Editorial & Testing Policy. Trading carries risk; see the disclaimer.