
Learning how to use Fibonacci retracement turns a messy pullback into a set of clean, tradable levels. The tool takes one strong swing and projects the zones where price often pauses before the trend resumes.
This guide shows how to use Fibonacci retracement from the first click to the final stop. So by the end, you will draw the tool swing to swing, read the 61.8 and 50 levels, and stack confluence that lifts a level from a guess to a plan.
How to Use Fibonacci Retracement Step by Step
Fibonacci retracement is a set of horizontal lines drawn across one price swing. Each line sits at a ratio taken from the Fibonacci number sequence, so the tool marks where a pullback might stall.
The default levels are 23.6, 38.2, 50, 61.8, and 78.6 percent. The 61.8 line is the famous one, since it comes from the golden ratio that runs through the sequence. Traders watch it closely as a prime reversal zone.
Start with the tool itself. On TradingView, pick the Fibonacci Retracement drawing tool, then click one swing point and drag to the other. In an uptrend, drag from the swing low up to the swing high. In a downtrend, drag from the swing high down to the low.
Look at a live setup. The chart shows gold on the daily timeframe in a clear uptrend, with the tool dragged from the swing low near 3,942 up to a swing high near 4,203. So the level grid now hangs across the recent pullback.

Now read the grid from top to bottom. Price rallied hard, then began to ease back into the levels. Because the trend still points up, each Fibonacci line becomes a possible support shelf where buyers might step back in. So the tool gives you a map, not a signal on its own.
The Levels and What They Mean
Each ratio tells a small story about the strength of the move. So learn the meaning once, then read any grid at a glance.
- The 23.6 level. A very shallow pullback that often appears in strong, fast trends where buyers barely let go.
- The 38.2 level. A modest dip, common when momentum stays firm and the crowd wants back in early.
- The 50 level. Not a true Fibonacci ratio, yet traders watch it as a natural halfway point of the swing.
- The 61.8 level. The golden ratio and the classic reversal zone, where many trend traders look to enter.
- The 78.6 level. A deep pullback and a last line of defence before the whole swing comes into doubt.
So the shallow levels favour strong trends, while the deep levels warn that momentum is fading. The concept graphic below sorts the levels and shows the 61.8 golden pocket at the heart of the grid.
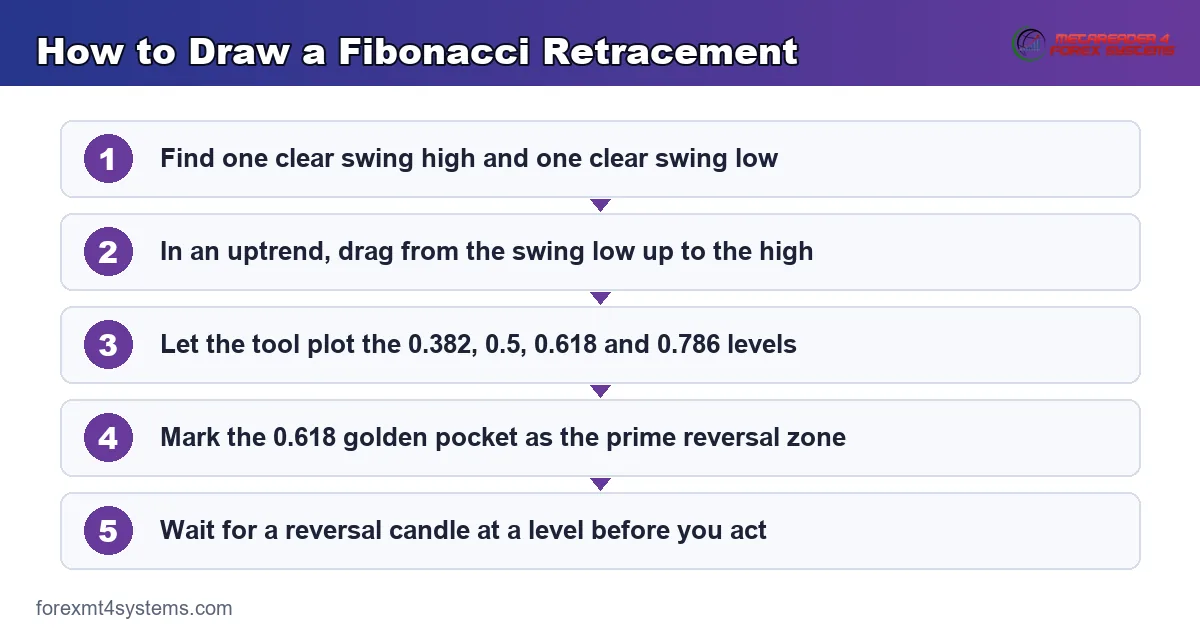
One idea ties the grid together. The zone from 61.8 to about 65 percent earns the nickname golden pocket. Because price so often turns there in a healthy trend, many traders treat it as the sweet spot for a pullback entry.
Why the 61.8 Level Matters Most
The 61.8 ratio is not random. Divide any Fibonacci number by the one after it, and the answer settles near 0.618. So the golden ratio shows up across nature and markets alike, which is why chartists give it such weight.
Still, a level is only a level. Price does not have to respect it, and no ratio forces a reversal. So treat the 61.8 line as a high-interest area to watch, then wait for the chart itself to confirm before you act.
Drawing the Tool Correctly
Most Fibonacci errors start at the drawing stage. So slow down and pick your swing points with care.
Choose obvious highs and lows, not tiny wiggles. A good swing stands out on the chart and shows a clear turn. Because the whole grid hangs off those two points, sloppy anchors give useless levels.
Match the direction of the trend as well. In an uptrend you drag low to high, so the levels project support beneath price. In a downtrend you drag high to low, so the levels project resistance above price. So the tool always measures a pullback against the move that came before it.
Keep the swing on a timeframe you trade. A daily swing suits a swing trader, while a five-minute swing suits a scalper. Because each timeframe carves its own swings, mixing them scatters the levels and muddies the read.
Fibonacci Clusters and Golden Zones
One swing gives a grid, yet two swings give a cluster. Draw the tool across a large swing and again across a smaller one inside it. Where a level from each grid lands on the same price, that overlap forms a Fibonacci cluster.
A cluster carries extra weight for a simple reason. Two independent measures point at one zone, so more traders watch it. Because the levels agree, a cluster often reacts more sharply than a single line. So mark these overlaps and treat them as priority zones on the chart.
Still, keep the read honest. A cluster raises the odds of a reaction, yet it never removes the need for confirmation. So wait for the same reversal signal at a cluster that you would demand at any lone level, then act with the extra confidence the overlap earns.
Settings, Timeframes, and Pairing
The default level set works for most charts, and I would keep it. You can add the 78.6 line if you like deep pullbacks, yet the core four carry most trades.
Higher timeframes give stronger levels. A 61.8 line drawn from a weekly swing holds more weight than one from a five-minute swing. So the bigger the swing, the more traders watch its retracement, and the more the level tends to matter.
Pair Fibonacci with a trend read, since the tool assumes a trend exists. A moving average names the direction first, and our guide to SMA vs EMA covers that choice. Then a structure read helps, so our guide to support and resistance shows how prior zones stack with the grid.
Using Fibonacci to Set Targets
Retracement levels do more than mark entries. They also map sensible exits, so you can plan a trade from start to finish with one tool.
Use the prior swing as the first target. When price bounces from a 61.8 level, the old swing high often acts as the natural goal. So a pullback entry aims back at the point where the last leg ran out of steam.
Go further with extensions when a trend is strong. The 127.2 and 161.8 extension levels project targets beyond the old high, since a fresh trend often carries past the last one. Because those lines sit outside the grid, they give a stretch goal for a runner. So the same ratios that time an entry can also frame the exit.
Keep the reward honest against the risk. Measure the distance from entry to stop, then compare it to the distance from entry to target. Because a shallow entry near 38.2 leaves a wide stop, its reward often looks thin. So a deeper entry near 61.8 usually offers a cleaner reward for the same target.
Reading the Depth of a Pullback
The depth of a retracement carries a message about strength. A trend that only dips to 38.2 shows eager buyers who refuse to wait. A trend that sags to 78.6 shows a move that is barely holding on.
So watch how far price travels into the grid. A run of shallow pullbacks points to a durable trend worth trading in its direction. Meanwhile a string of deep pullbacks warns that the move may be near its end. Read the depth as a live gauge, not a fixed rule. So let a shallow pullback invite a confident entry, and let a deep one prompt a smaller size and a closer watch.
Confluence Turns a Level Into a Trade
A lone Fibonacci line is a weak reason to trade. Confluence fixes that. When a level lines up with another clue, the case gets much stronger.
Look for a prior swing that sits on the same price as a Fibonacci line. A 61.8 level that lands on old support is far more interesting than one floating in empty space. So overlap between the grid and real structure lifts a level from maybe to likely.
Stack more clues on top. A round number, a moving average, or a trendline that meets the same zone all add weight. Because several tools point at one price, a reversal there becomes more believable. So confluence is the filter that keeps you out of thin setups.
Momentum adds a final layer. An oscillator turning up as price tags a 61.8 support hints that sellers are tiring. So a rising reading at the level supports the case, while a still-falling one urges patience. Never lean on one clue alone when several are within reach.
Weigh the clues rather than counting them. Two strong signals, such as a level on prior support with a clean reversal candle, beat five weak ones. Because quality matters more than quantity, a tidy setup with real structure earns more trust than a crowded chart. So judge the confluence, then size the trade to match your confidence.
Worked Example: A Gold Pullback
Picture gold trending up on the four-hour chart after that strong daily rally. Price eases back from the high near 4,203 and drifts into the level grid. The 61.8 line sits around 4,062, right on a shelf of old support.
Now wait for the chart to speak. A bullish reversal candle prints at the 61.8 zone, with a long lower wick that shows buyers defending the level. So the confluence of the golden pocket and prior support gives a reason to act. The chart below marks the entry candle and the stop.

Then set the risk. The entry sits just above the reversal candle, and the stop tucks below the 78.6 line near 4,034. Because the 78.6 break would kill the setup, that spot is the honest place for a stop. Our free Fibonacci calculator plots the same levels in seconds if you want to check them by hand.
The follow-through rewarded the plan. Price held the golden pocket, turned up, and pushed back toward the old high as the trend resumed. So the deep stop absorbed the noise while the shallow risk gave a strong reward. That balance is the whole appeal of a Fibonacci entry.
Managing the Gold Trade to Target
Contrast a rushed version to see the gain. A trader who bought the first touch of 50, with no candle and no support behind it, would have sat through a deeper dip to 61.8. Because that early entry ignored confluence, the drawdown felt far worse. So the patient plan did not just find a better price; it also made the trade easier to hold.
Trail the stop as the move matures. Once price clears the old midpoint, lift the stop to breakeven so the trade can no longer hurt. Because the trend has proven itself, that shift locks in safety without choking the runner. So a small move of the stop turns a good entry into a low-stress hold.
Walk the numbers once more. Entry near 4,062, stop near 4,034, and a first target back at 4,203 gives a reward several times the risk. Because the ratios framed every level, the whole plan fell out of one clean draw. So a single tool timed the entry, set the stop, and named the target in one pass.
Download the complete indicator database
Put these concepts on your charts. One email unlocks the full library of 1,380+ indicators with compiled MT4 and MT5 files, plus my TradingView scripts. No paywall, no spam, unsubscribe any time.
Get free access to my indicator database
One email unlocks 1,380+ free MT4, MT5 and TradingView indicators — the complete library. No single-tool download; you get the whole database.
Common Mistakes and How to Fix Them
The tool looks simple, yet the same errors repeat on every chart. Most trace back to forcing the grid onto a market that does not fit, and the fixes follow beneath the graphic.

Drawing From the Wrong Swings
Anchoring on tiny wiggles gives a grid nobody watches. Random swings produce random levels. So pick the two clearest turning points on your timeframe, then let the tool hang from those honest anchors.
Trading a Level With No Confirmation
A price touch alone is not a signal. Buyers or sellers still have to show up. Instead, wait for a reversal candle, a break of a small trendline, or a shift in an oscillator before you commit.
Forcing Fibonacci Onto a Range
The tool assumes a trend, so a sideways market breaks it. In chop, price wanders through every level without meaning. So skip Fibonacci when no clear swing exists, and reach for range tools instead.
Ignoring the Bigger Picture
A 61.8 level means little if the higher timeframe points the other way. Traders who watch one chart miss the tide behind the wave. So check the larger trend first, then trade retracements that agree with it.
Placing Stops Too Tight
A stop just past the exact 61.8 line gets tagged by normal noise. Fibonacci zones are areas, not razor lines. So give the stop room beyond the next level, often below 78.6, so ordinary wiggles cannot end the trade early.
Pre-Trade Fibonacci Checklist
Run this short list before every Fibonacci entry. A few seconds here saves a rushed trade later. So keep it in view and let a missing check talk you out of a weak setup.
- A clear trend confirmed on the higher timeframe.
- Two obvious swing points chosen as anchors.
- The tool dragged in the trend direction, low to high or high to low.
- A Fibonacci level that overlaps prior support or resistance.
- A confirmation candle or signal at the level before entry.
- A stop placed beyond the next level, not on the line.
- A reward that clearly beats the risk on the trade.
When Fibonacci Retracement Fails
Study the failure as hard as the winner. Here is a common one. A trader draws a clean grid on EURUSD and buys the 61.8 level around 1.145, sure the pullback is done. Every prior dip had held there.
Then the level gives way. Price slices through 61.8, cuts through 78.6, and keeps falling past the old swing low. The chart below shows the break, with price shredding every line on the grid.

So what went wrong? A retracement is only a pause inside a trend. When price breaks the full swing, the trend itself has likely turned, and the grid no longer applies. Hence the stop below 78.6, which closed the trade before the deeper drop did real harm. A level is a place to watch, never a promise price must obey.
Notice the tell that came first. Price stalled at 61.8, yet no reversal candle ever formed, so the confirmation step never fired. Because the trader jumped in on the touch alone, the entry sat exposed when the level broke. So the missing signal, not the level, was the real flaw in the plan.
Deep Retracements Warn of Weakness
Notice the message in a deep pullback. When price reaches 78.6 again and again, the trend is losing its grip. So a shallow 38.2 pullback shows strength, while a repeated 78.6 test shows a move running out of fuel. Read the depth of the retracement as a health check on the trend.
Confluence Cannot Save a Broken Trend
Be honest about the limits of confluence. Even a level backed by support and a round number can fail when the tide turns. Because no tool sees the future, stacked clues only tilt the odds. So size each trade so a single failed level stays a small, survivable loss.
Related Concepts to Study Next
Fibonacci retracement connects to a web of sibling ideas, and a few deserve your next reading hour. The tool leans on the definition of the ratios themselves, so a look at what Fibonacci retracement is grounds the why behind the levels. The grid also works best beside real zones, which is where support and resistance earns its place in the pairing section above.
For a wider view, the Fibonacci indicators archive plots these levels and their cousins automatically, while a volatility read can help you size the stop. Our guide to Bollinger Bands frames the same pullbacks as stretch and snap around a mean. Tools speed the work, yet the logic above still carries the trade, so master the swing-to-swing draw first and let any indicator simply plot the grid you already know how to read.
FAQ
How do you use Fibonacci retracement for beginners?
Pick the Fibonacci Retracement tool, then drag it across one clear swing. In an uptrend, drag from the swing low to the high. Watch the 61.8 and 50 levels for a pause, and wait for a reversal candle before you enter.
Which Fibonacci level is the most important?
The 61.8 level draws the most attention, since it comes from the golden ratio. The 50 level runs a close second as a natural midpoint. Many trend traders focus on the golden pocket between those two lines.
Do you draw Fibonacci from high to low or low to high?
Follow the trend. In an uptrend, drag from the swing low up to the swing high so the levels project support below. In a downtrend, drag from the swing high down to the low so the levels project resistance above.
Where do you place a stop with Fibonacci retracement?
Place the stop beyond the next level, not on the line you traded. If you enter at 61.8, a stop below 78.6 gives the setup room. A break past that deep level usually means the retracement has failed.
Does Fibonacci retracement actually work?
The levels mark zones where many traders watch, so price often reacts there. Still, the tool points at areas of interest, not certainties. It works best with confluence and a confirming signal, never as a standalone trigger.
Can I use Fibonacci retracement on any timeframe?
Yes, the tool works on any chart, from one minute to weekly. Higher-timeframe swings give stronger levels because more traders watch them. Keep the swing and the trade on the same timeframe. Results are not guaranteed; past performance is not indicative of future results.
External references
- For background on this concept, see Fibonacci Retracements at Corporate Finance Institute.
- For broader market context, see Fibonacci Number on Wikipedia.

About the author
Written by Dominic Walsh, a Forex trader and MT4/MT5 indicator, Expert Advisor and script developer. Every tool on forexmt4systems.com is tested on live charts before release and ships with ready-to-use compiled MT4 (.ex4) and MT5 (.ex5) files. Learn more about the trader and developer behind this site.
How we build, test and correct every tool: Editorial & Testing Policy. Trading carries risk; see the disclaimer.