
Two charts can tell the same story in different clothes, and that is the heart of currency correlation in forex. When you buy one pair and sell another that moves in lockstep, you may think you hold two trades when you really hold one risk twice over.
This guide gets currency correlation in forex explained in plain terms. So by the end, you will read a correlation value with confidence, spot pairs that double your exposure, and use the relationships to size and hedge a book of trades sensibly.
Currency Correlation in Forex Explained
Currency correlation measures how two pairs move relative to each other over a set window. The reading runs from plus one to minus one, and the number tells you whether the pairs travel together, apart, or with no link at all.
Start with the two extremes. A reading near plus one means the pairs move in the same direction almost every bar, so they rise and fall together. When it sits near minus one, they travel in opposite directions, so one climbs as the other slips. A value near zero means no reliable link exists between them.
The reason for these links is shared currencies. EURUSD and GBPUSD both hold the dollar as the quote currency, so a broad dollar move pushes both the same way, which builds a positive correlation. EURUSD and USDCHF sit on opposite sides of the dollar, so a dollar move splits them apart, which builds a strong negative one.
Look at a concrete case. The chart runs a Correlation Coefficient indicator for EURUSD against USDCHF, and the sub-pane reads near minus 0.90. That deep reading is the signature of a strong negative correlation, where one pair climbs as the other slips.
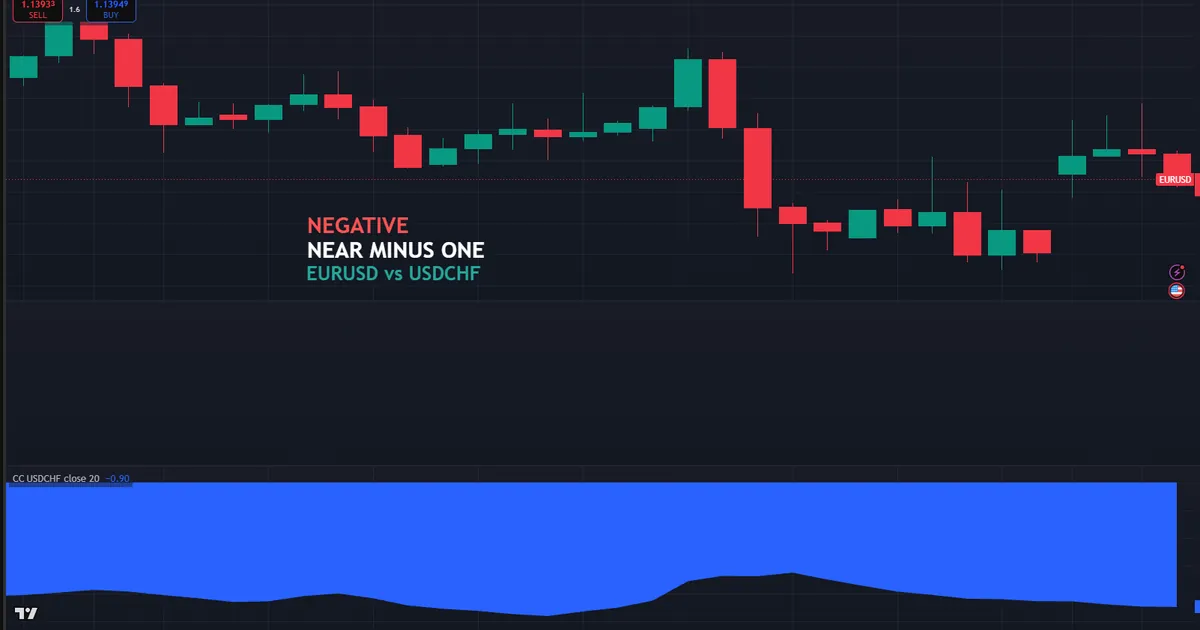
Now trace why that mirror forms. The dollar is the pivot both pairs share, yet it sits in a different slot in each quote. So when the dollar weakens, EURUSD rises and USDCHF falls at nearly the same time. Because that link is structural, it tends to hold across long stretches rather than appearing by chance.
Where Correlations Come From
Links between pairs are rarely random. Most trace back to a currency the two pairs hold in common, and the dollar sits behind the majority of them. Because the dollar features in every major pair, a broad move in it ripples across your whole watchlist at once.
Economic ties add a second layer. The Canadian dollar leans on oil, the Australian dollar leans on metals, and pairs built on those currencies inherit some of that behavior. So a commodity swing can nudge several pairs together even when the dollar sits still. Reading the shared driver, rather than the surface link, is what turns a correlation value into something you can actually use.
How Correlation Is Measured
The number behind the relationship comes from a standard statistic, and knowing how it works stops you from over-trusting it. A correlation coefficient turns the link between two pairs into a single value.
- The scale. The coefficient runs from plus one to minus one. Plus one is a perfect positive link, minus one is a perfect negative link, and zero means no link.
- Strong positive. A value above roughly plus 0.7 means the pairs mostly move together. So a long in both stacks the same bet twice.
- Strong negative. A value below roughly minus 0.7 means the pairs mostly move apart. So a long in one and a long in the other partly cancel out.
- Weak or none. A value between minus 0.3 and plus 0.3 means little reliable link. Those pairs move on their own drivers.
- The window matters. The reading changes with the lookback period, so a one-week value can differ sharply from a one-year value.
So the coefficient is a snapshot, not a fixed law. The concept graphic below lines up the three cases and shows how each pair of lines behaves.

One detail keeps traders honest. Correlation describes how pairs have moved, not why, and never promises they keep moving that way. Because the value shifts as the market changes, treat it as a live gauge to recheck, not a rule carved in stone. A correlation that held all year can loosen in a single volatile week.
Timeframe Changes the Reading
The window you choose shapes the whole picture. A short lookback, such as one week, captures the current mood and can swing hard from day to day. A long lookback, such as one year, smooths those swings into a stable, structural read.
Match the window to your horizon. A scalper cares about this week’s link, while a swing trader cares about the multi-month one. Because the two windows can disagree, check both before you lean on a relationship. Our free forex correlation matrix lays out the values across many pairs and windows at a glance.
Watch how a value drifts, not just where it sits today. A pair link that reads plus 0.8 this month but only plus 0.4 last quarter is loosening, and that trend matters as much as the level. So glance at the recent history of a correlation, not only its current number. A relationship on the way toward zero deserves far less trust than a stable one that has held for months.
How Currency Correlation Fits a Workflow
Correlation earns its keep in one main place, which is risk control across a book of trades. Most traders hold more than one position, and correlation tells you whether those positions truly diversify or secretly double up.
Start with the doubling trap. If you go long EURUSD and short USDCHF, the strong negative link means both trades win or lose on the same dollar move. So you have not spread risk at all, you have simply bet on a weak dollar twice, which doubles the swing on your account.
Then use correlation to size sensibly. When two open trades share a strong link, treat them as one larger position for risk purposes, not two independent ones. Because their outcomes move together, your real exposure is the sum, not the average. The currency strength indicators archive helps you see which currency is driving that shared move underneath.
Now flip the idea for confirmation. If EURUSD breaks higher and its positive partner GBPUSD breaks higher too, the two moves agree and the signal looks stronger. Meanwhile a break in one that its partner ignores hints the move may be thin. So correlation can confirm a setup as well as flag hidden risk.
Correlation and the Dollar Index
Most major pairs orbit the dollar, so the dollar index frames them all. The index, often called DXY, tracks the dollar against a basket of currencies, and EURUSD makes up the largest slice of that basket.
So EURUSD and the dollar index move almost perfectly opposite, near a minus one link. When DXY climbs, EURUSD falls, and when DXY slips, EURUSD rises. Because the index sums up broad dollar demand, watching it can explain why several of your pairs moved together on the same day. Our currency strength meter breaks that broad move down currency by currency.
Treat the index as a shortcut, then. Rather than eyeballing five dollar pairs at once, glance at one line that already blends them. So a rising index warns that dollar-quoted longs face a headwind together, while a falling one favors them together. That single read frames every dollar pair on your chart before you commit to any of them. Many traders keep the index on a second pane for exactly this reason, using it as a quick sanity check on any dollar trade they plan to take before the entry goes in.
Using Correlation to Hedge
Some traders use the negative links to soften risk on purpose. Holding a long EURUSD alongside a long USDCHF partly hedges the dollar leg, so a surprise dollar move hurts less. The catch is that a partial hedge also caps the reward, since the two positions fight each other.
So weigh the trade-off before you hedge this way. A hedge lowers both risk and reward, which suits a cautious book but frustrates a trader hunting a clean directional move. Because the balance is personal, decide in advance whether you want protection or full exposure on a given idea.
Correlation Across Asset Classes
Currency links do not stop at forex pairs. Gold often moves opposite to the dollar, so XAUUSD near 4100 tends to rise when the dollar falls, much like EURUSD does. Because both react to the same dollar swing, holding long gold and long EURUSD can quietly double a weak-dollar bet.
Commodities feed the currency side too. Oil ties closely to the Canadian dollar, so a sharp move in crude can push USDCAD before any dollar story appears. So when you trade a commodity currency, glance at the commodity behind it, since the two often lead each other. That wider view catches links a pure forex matrix can miss.
Worked Example: EURUSD and USDCHF
Picture two setups that both look bullish on the euro. EURUSD sits near 1.14 and looks ready to climb, while USDCHF sits near 0.80 and looks ready to fall. Both charts tempt a trade, and both point at the same dollar view.
Now read the risk as a whole. Going long EURUSD and short USDCHF at once is not two trades, it is one weak-dollar bet placed twice. The same doubling shows up on the positive side too: the chart below plots the Correlation Coefficient for EURUSD against GBPUSD near plus 0.92, where going long both would stack one dollar bet twice just as the USDCHF short does.

Then size the combined position, not each leg alone. If each trade risks one percent, the pair together risks close to two percent on a single dollar move, since they rise and fall as one. Because the correlation is near minus one, the account swing is effectively doubled. Our free position size calculator helps you set both legs so the total stays within your limit.
Managing the Combined Trade
Treat the two legs as a single risk unit throughout. So if you would normally risk two percent on one idea, split that budget across the pair rather than loading each leg to the full amount. That keeps the real exposure where you intended it.
Watch for the moment the link loosens. While the two pairs mirror each other, the combined view holds and the trades move together. Meanwhile, if the correlation starts to slip, the legs can drift apart and behave more like separate bets. So recheck the value as the trade runs, not only when you enter.
Compare a trader who missed the link entirely. Someone treating the two legs as independent would think they held a diversified book, when they really held one doubled bet. Because the correlation was ignored, a single sharp dollar move could hit twice as hard as expected. So the read on the relationship, not the setups themselves, decided the true risk.
Notice the quiet lesson in that comparison. Two attractive charts can hide a single risk, and only the correlation view exposes it. So a good habit is to ask, before every second trade, whether it truly adds a new bet or merely repeats one you already hold. That one question keeps a book honestly diversified rather than diversified in name alone.
Download the complete indicator database
Put these concepts on your charts. One email unlocks the full library of 1,380+ indicators with compiled MT4 and MT5 files, plus my TradingView scripts. No paywall, no spam, unsubscribe any time.
Get free access to my indicator database
One email unlocks 1,380+ free MT4, MT5 and TradingView indicators — the complete library. No single-tool download; you get the whole database.
Common Currency Correlation Mistakes
The idea is simple, yet the same errors repeat across every book of trades. Most come from treating a correlation value as fixed or forgetting it exists, and the fixes follow beneath the graphic.

Doubling Risk Without Noticing
The classic slip is opening several highly correlated trades and calling them diversified. Each looks like a fresh idea, yet they all ride the same driver. So check correlation before you stack positions, and count linked trades as one larger risk rather than several small ones.
Trusting an Old Reading
A correlation from last year may not hold this week. Markets shift, and links tighten or loosen with them. Instead of assuming a value is permanent, refresh it on a live matrix, and treat every reading as a snapshot with a short shelf life.
Ignoring the Timeframe
A one-week link and a one-year link can point opposite ways. Borrowing the wrong window wrecks the read. So match the lookback to your trading horizon, and check both a short and a long window before you lean on any relationship.
Confusing Correlation With Causation
Two pairs moving together does not mean one drives the other. Often a third factor, usually the dollar, moves both. So look for the shared currency behind a link rather than assuming a direct cause, and let that driver, not the coincidence, guide your read.
Over-Hedging Into Zero
Stacking negative-correlated trades to feel safe can cancel your position entirely. Two perfect opposites net out to almost nothing but spread cost. So hedge on purpose and in measured size, and never build a book that quietly neutralizes its own edge.
Currency Correlation Checklist
Run this short list before you open a second trade that shares a currency. A few seconds here saves hours of regret later. So keep it in view, tick each item honestly, and let a missing check talk you out of a hidden double-up.
- Correlation value checked between the new trade and every open one.
- Strong links, above 0.7 or below minus 0.7, flagged as shared risk.
- Linked trades counted as one larger position for sizing.
- Lookback window matched to your trading horizon.
- Both a short and a long window compared for agreement.
- Shared driver, often the dollar, identified behind the link.
- Total risk across correlated trades kept within your limit.
When Correlation Breaks Down
Study the failure case as hard as the winner. Here is a common one. A trader sees EURUSD and GBPUSD carry a strong positive link and shorts both, sure the two will fall together as one clean dollar bet near 1.14 and 1.34.
Then a UK-only event hits. GBPUSD drops on a soft data print while EURUSD holds firm, so the two pairs split apart despite their history. The chart below shows that break: on a short lookback the EURUSD-GBPUSD correlation coefficient slides from strongly positive down below zero toward minus 0.2 as the pound moves on its own driver.

So what went wrong? Correlation describes a tendency, not a certainty, and it snaps whenever a currency-specific shock hits one pair alone. Hence the guard that saves an account, which is to remember that a shared link only holds while the shared driver leads. When local news takes over a single currency, its pair goes its own way, and the correlation you leaned on simply stops applying.
Events Override Correlation
Respect the calendar when you rely on a link. A central bank decision or a data surprise can move one currency hard while its usual partner sits still. So around big scheduled events, treat correlations as fragile, and size as if the link may vanish for a day. Our guide to how to use ATR for day trading shows how to gauge the extra range those events bring.
Keep a Trade Log
Be systematic about which correlations actually affect your results. Because your pairs and timing are unique, a written record beats memory every time. So note the correlated clusters in each trade and their outcomes, then let the data reveal where hidden doubling has quietly cost you over the months.
Related Concepts to Study Next
Currency correlation connects to a web of risk and trend tools, and a few ideas deserve your next reading hour. The strength of the shared driver often shows up first in a trend read, which is where a smoothing tool earns its place beside the correlation view. Reading the same pairs across several windows also sharpens the picture, so a top-down routine pairs naturally with this work. Both partners deepen the read that a single correlation value gives you.
For broader context, the trend indicators archive frames the shared move through direction instead of correlation. Our guides to moving averages explained and multi timeframe analysis extend the trend and timeframe themes. So master the correlation read first on your own, and then let any tool on the chart simply confirm the relationships you already understand.
FAQ
What is currency correlation in forex?
Currency correlation in forex measures how two pairs move relative to each other. The reading runs from plus one to minus one, where plus one means they move together, minus one means they move apart, and zero means no link. It exists mainly because pairs share a common currency such as the dollar.
Which pairs are negatively correlated?
EURUSD and USDCHF usually carry a strong negative link because they sit on opposite sides of the dollar. When the dollar weakens, EURUSD rises while USDCHF falls. The dollar index also moves nearly opposite to EURUSD, since the euro is its largest component.
How do I read a correlation value?
A value above roughly 0.7 means a strong positive link, and one below minus 0.7 means a strong negative link. Values between minus 0.3 and plus 0.3 mean little reliable link. The reading also depends on the lookback window, so check both a short and a long one.
Why does correlation matter for risk?
Highly correlated trades ride the same driver, so opening several stacks the same bet many times. That doubles your exposure while feeling like diversification. Counting linked trades as one larger position keeps your true risk where you intended it.
Can I use correlation to hedge?
Yes, holding two negatively correlated pairs partly offsets a shared move. The catch is that a hedge caps reward as well as risk, since the positions fight each other. So hedge on purpose and in measured size rather than by accident.
Does currency correlation always hold?
No, correlation describes a tendency and can break when a currency-specific event hits one pair alone. A link that held all year can loosen in a volatile week. So recheck the value often, size for the chance it fails, and manage risk on every trade. Results are not guaranteed; past performance is not indicative of future results.
External references
- For background on this concept, see Currency Correlation at BabyPips.
- For broader market context, see Intermarket Analysis at Corporate Finance Institute.

About the author
Written by Dominic Walsh, a Forex trader and MT4/MT5 indicator, Expert Advisor and script developer. Every tool on forexmt4systems.com is tested on live charts before release and ships with ready-to-use compiled MT4 (.ex4) and MT5 (.ex5) files. Learn more about the trader and developer behind this site.
How we build, test and correct every tool: Editorial & Testing Policy. Trading carries risk; see the disclaimer.