
Few tools appear on more charts than the moving average, so getting moving averages explained clearly is worth an hour of your time. A moving average smooths the jagged price line into one flowing curve, and that curve reveals the trend hiding under the daily noise.
This guide gets moving averages explained from the ground up. So by the end, you will know the difference between the main types, read a crossover with confidence, and use the line as dynamic support or resistance in a live market.
Moving Averages Explained: The Basics
A moving average is the average price over a set number of bars, recalculated on every new candle. So as each fresh bar arrives, the oldest bar drops out and the average shifts along. That constant update is why the line seems to move with price.
The point of the tool is clarity. Raw price jumps around with every tick, and that noise hides the underlying direction. A moving average filters the jumps into a single smooth line, so the trend becomes obvious at a glance.
One idea sits at the core. A moving average lags by design, because it looks backward over past bars. So the line confirms a trend rather than predicting one, and it always turns after price, never before. That lag is a feature, not a flaw, once you plan around it.
Think about why the lag helps. Price itself is full of false starts, brief pokes that fizzle within a bar or two. Because the average waits for several bars to agree, it ignores most of those head fakes. So the line trades a little lateness for a lot of reliability, which is usually a bargain worth taking.
What the Length Controls
The period, or length, sets how many bars feed the average. A short length, such as 20, hugs price closely and reacts fast. A long length, such as 200, sits far from price and reacts slowly. So the number you choose decides the balance between speed and smoothness.
Match the length to your job. Day traders lean on short averages that track quick swings, while position traders lean on long ones that map the big picture. Because each length answers a different question, many traders plot two or three at once and read them together.
A few lengths show up again and again. The 20 tracks the near-term swing, the 50 maps the intermediate trend, and the 200 anchors the long-term bias. So these three cover most needs without cluttering a chart. Because so many traders watch the same numbers, price often reacts at them, which turns a popular level into a kind of self-fulfilling reference.
Look at a concrete case. The chart shows EURUSD on the daily timeframe with three moving averages plotted over price. As the pair trends up near 1.14, the short average leads, the medium one follows, and the long one anchors the whole move from below.
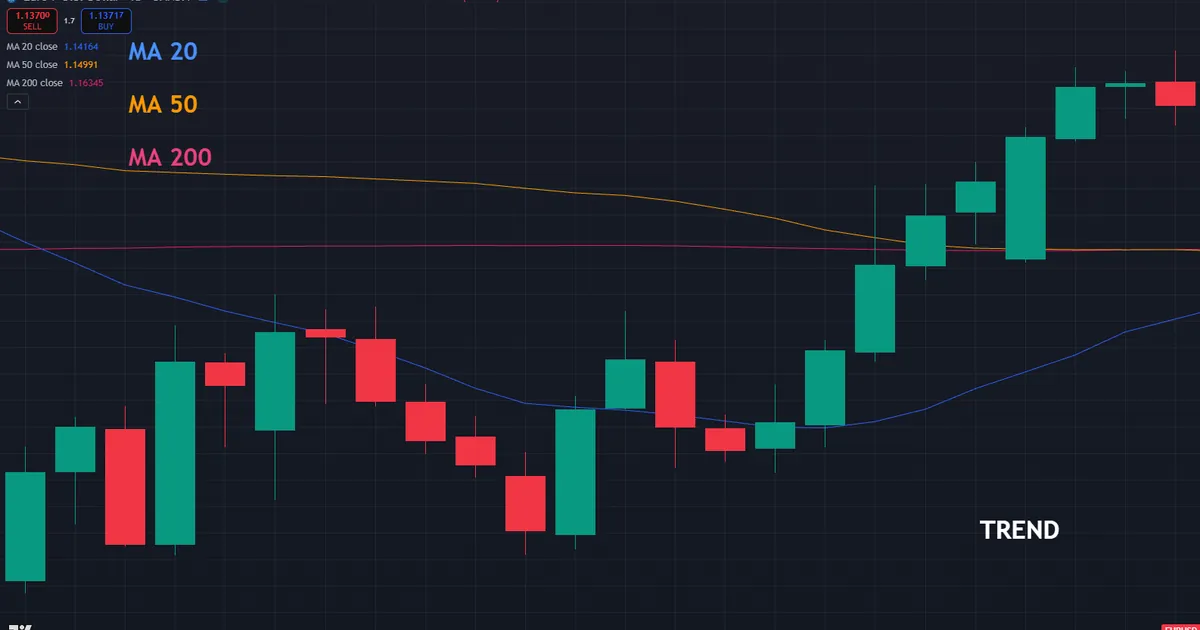
Now trace the lines from left to right. First all three sit tangled during a flat stretch. Then price breaks higher, the short average pulls up first, and the others fan out beneath it in order. That fanned, stacked look is the signature of a healthy trend.
The Main Types of Moving Average
Not all moving averages weight the data the same way. Three types cover almost every chart you will meet, and each handles recent prices differently.
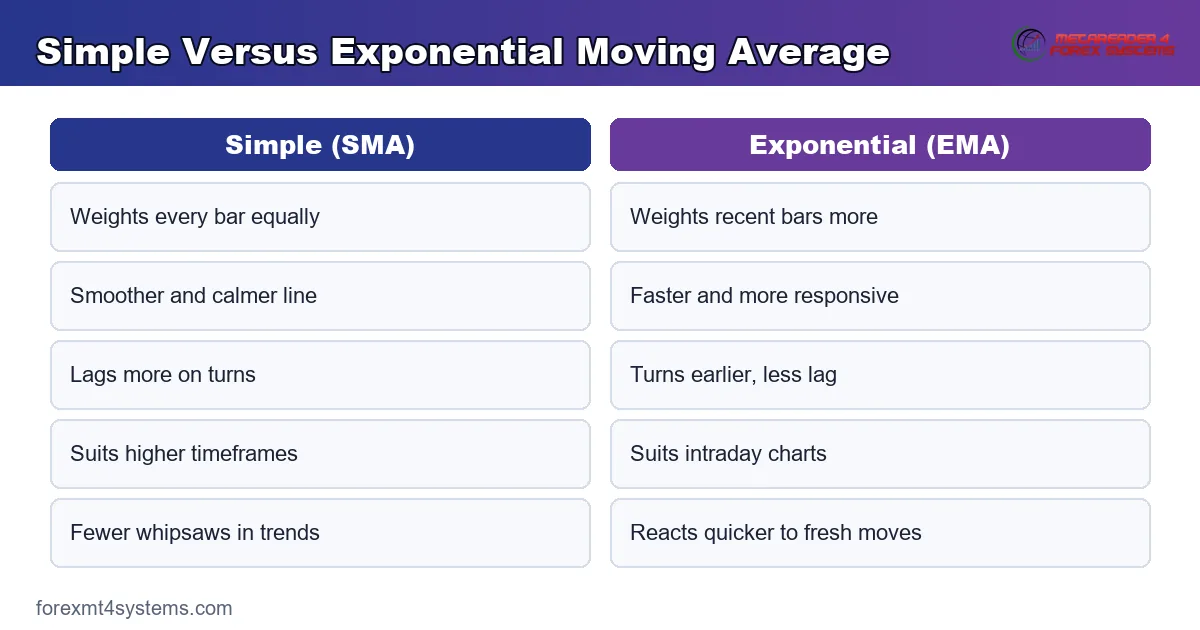
- Simple moving average. The SMA adds the closing prices over the period and divides by the count. Every bar counts equally, so the line is smooth but slow to react.
- Exponential moving average. The EMA weights recent bars more heavily than old ones. So it turns faster than the SMA and tracks fresh moves with less lag.
- Weighted moving average. The WMA assigns a straight-line weighting, heaviest on the newest bar. It reacts even faster than the EMA, at the cost of more sensitivity to noise.
- The trade-off. Faster averages catch turns early but whipsaw more, while slower ones stay calm but arrive late.
So the choice is really about how much weight you give the latest price. The concept graphic below lines up the three types and shows how each responds to the same move.
One detail helps here. The EMA is the popular middle ground for most traders. Because it reacts quicker than the SMA yet stays steadier than the WMA, it balances speed against noise well. So many charts default to an EMA when a single line is all you need.
SMA Versus EMA in Practice
The two most common types deserve a direct look. An SMA gives a clean, calm read that suits higher timeframes and long trends. An EMA gives a quick, responsive read that suits intraday work and fast markets. So the same length behaves differently depending on the type you pick.
Test both before you settle. On a smooth daily chart, the extra lag of the SMA barely matters and its calm helps. On a jumpy five-minute chart, the faster EMA keeps you closer to the action. Our guide to SMA vs EMA works through that choice with examples.
The WMA fills a narrower niche. Because it front-loads weight even harder than the EMA, it hugs price the closest of the three. So a very short-term trader might reach for it, yet most others find it too twitchy for calm decisions. Start with the SMA or EMA, and treat the WMA as a specialist tool for fast scalping.
How Moving Averages Fit a Workflow
A moving average does three jobs at once, and knowing which one you want keeps a chart clean. It reads trend direction, it flags crossovers, and it acts as dynamic support or resistance.
Start with direction, the simplest job. When price sits above a rising average, the trend is up, and when price sits below a falling one, the trend is down. So a single glance at price against the line tells you which way to lean before any entry. That one read alone filters out a surprising number of poor trades.
Then use the slope as a filter. A rising average confirms buyers control the tape, while a falling one confirms sellers do. Because the slope cuts through short-term noise, it keeps you trading with the larger flow rather than against it. The moving average indicators archive plots the whole family automatically if you want it on every chart.
A flat, wandering slope carries its own message. When the average drifts sideways with no clear tilt, the market has no trend to trade. So a flat line is a signal to stand aside, not a puzzle to solve. Because that read is so simple, the slope alone can keep you out of the choppy conditions that punish trend methods the most.
Reading a Crossover
A crossover happens when a faster average crosses a slower one. When the fast line crosses above the slow line, momentum has turned up, and traders call it a bullish cross. When the fast line crosses below, momentum has turned down.
The most famous pair is the 50 and the 200. A cross of the 50 above the 200 earns the name golden cross, and the reverse earns the name death cross. So these long-term crossings draw attention because they mark major shifts in the bigger trend.
Treat a cross as confirmation, not a crystal ball. Because both lines lag, the cross prints after the turn has already begun. So pair it with structure or a momentum read, and our guide to what is ADX indicator shows how to confirm the trend has real force behind it.
Dynamic Support and Resistance
A moving average often acts as a moving floor or ceiling. In an uptrend, price frequently dips to the rising average and bounces, so the line behaves like support that travels with the market. In a downtrend, price rallies to the falling average and stalls, so the line acts as resistance instead.
Use those touches as low-risk entry zones. A pullback to a rising average in an uptrend offers a spot to join the move with a tight stop just beyond the line. Our free position size calculator turns that stop distance into a size in seconds.
The longer averages tend to hold the firmest. A 200-period line often marks a level that big institutions watch, so bounces there can be sharp. Meanwhile a short average gives more frequent but weaker touches. So pick the length whose touches match how often you want to trade, and respect that longer lines carry more weight.
Worked Example: A EURUSD Pullback Entry
Picture an uptrend on EURUSD holding above a rising 50-period EMA on the four-hour chart. Price has climbed toward 1.14, then eased back toward the average. The longer 200-period line sits below and also slopes up, so both timeframes agree.
Now read the setup as a whole. The rising 50 EMA names the uptrend, and a pullback to that line offers a low-risk join. So trend and timing line up together. The chart below marks the touch of the average and the long entry that follows the bounce.
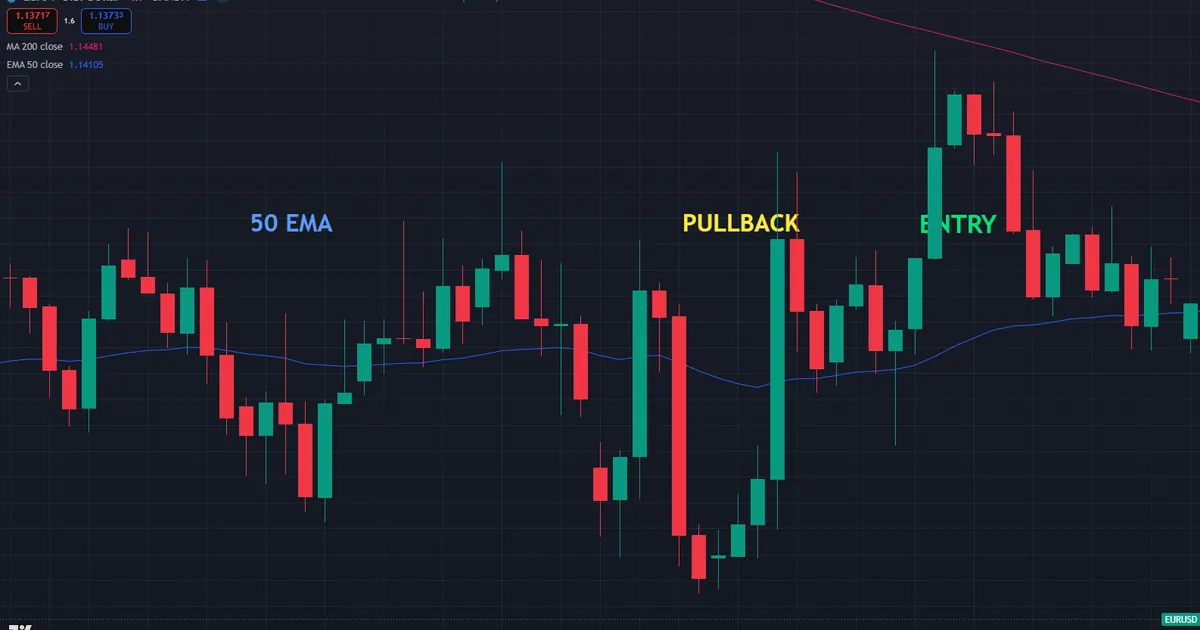
Then build the risk plan around the line. A stop sits just below the 50 EMA, near 1.135, where a clean break would deny the uptrend. Because the average has held as support through the move, that stop sits at a logical spot rather than a random pip count.
Managing the Trade
Let the average guide the exit as well as the entry. As long as price holds above the rising line, the uptrend stays intact and the trade runs. If price closes firmly below the average, the support has failed and the reason for the trade is gone.
Watch the spacing between your lines too. When the fast and slow averages stay wide apart, the trend is strong and the winner can breathe. Meanwhile, when they pinch back together, momentum is fading and a tighter exit makes sense. So the gap between the lines quietly tracks the health of the move.
Compare a fixed-target trader on the same chart. Someone who exits at a set pip goal often leaves a strong trend early. Because the moving-average exit rides the trend until the line breaks, it captures more of a big move. So the line manages the trade rather than a guess about how far price will go.
Notice how the plan stays simple throughout. One line named the trend, offered the entry, held the stop, and guided the exit. Because a single tool covered so many decisions, there was little to second-guess in the heat of the move. So a clean moving-average plan often beats a cluttered one, not because the math is clever, but because it keeps you consistent.
Download the complete indicator database
Put these concepts on your charts. One email unlocks the full library of 1,380+ indicators with compiled MT4 and MT5 files, plus my TradingView scripts. No paywall, no spam, unsubscribe any time.
Get free access to my indicator database
One email unlocks 1,380+ free MT4, MT5 and TradingView indicators — the complete library. No single-tool download; you get the whole database.
Common Moving Average Mistakes
The tool is simple, yet the same errors repeat across every market. Most come from expecting the line to do a job it was never built for, and the fixes follow beneath the graphic.

Trading Every Crossover
In a flat market, fast and slow averages cross back and forth endlessly. Each cross looks like a signal, yet most lead nowhere. So filter crossovers with a trend read, and skip them entirely when the market is ranging sideways.
Using Too Many Lines
A chart buried under six averages becomes noise, not clarity. More lines rarely mean more insight. Instead, pick two or three lengths with clear jobs, such as a fast, a medium, and a slow, and let the rest go.
Expecting the Line to Predict
A moving average lags, so it can only confirm a move already under way. Traders who wait for the line to turn before acting arrive very late. So use the average to define the trend, then take entries from structure or a pullback, not from the line alone.
Ignoring the Timeframe
A 200-period average means one thing on a daily chart and something else on a one-minute chart. Borrowing a level from the wrong window wrecks the read. So plot each average on the exact timeframe you trade, and let higher timeframes inform bias separately. Mixing the two windows is one of the quietest ways to confuse an otherwise clean plan.
Forcing One Type Everywhere
An EMA that shines on a fast chart may whipsaw a calm one, and an SMA can lag too much intraday. No single type fits every market. So match the type to the timeframe and the pace, and test the pairing before you rely on it. A quick backtest on your own charts settles the question faster than any rule of thumb ever could.
Moving Average Checklist
Run this short list before every entry that leans on an average. A few seconds here saves hours of regret later. So keep it in view, tick each item honestly, and let a missing check talk you out of a marginal trade.
- Trend direction confirmed by price against a rising or falling average.
- Average length matched to your working timeframe.
- Type, whether SMA or EMA, suited to the pace of the market.
- Crossover, if used, filtered by a separate trend read.
- Entry taken from a pullback or structure, not the line alone.
- Stop placed just beyond the average that supports the trade.
- Risk fixed as a small percent of the account.
When Moving Averages Fail
Study the failure case as hard as the winner. Here is a common one. A trader plots a 50-period EMA on EURUSD in a quiet range near 1.13 and buys every touch of the line, sure it marks support. The first bounce works.
Then the market turns against the plan. Price chops straight through the average, bounces the wrong way, and each crossover reverses within a few bars. The chart below shows that whipsaw, with price slicing back and forth across the flat line.
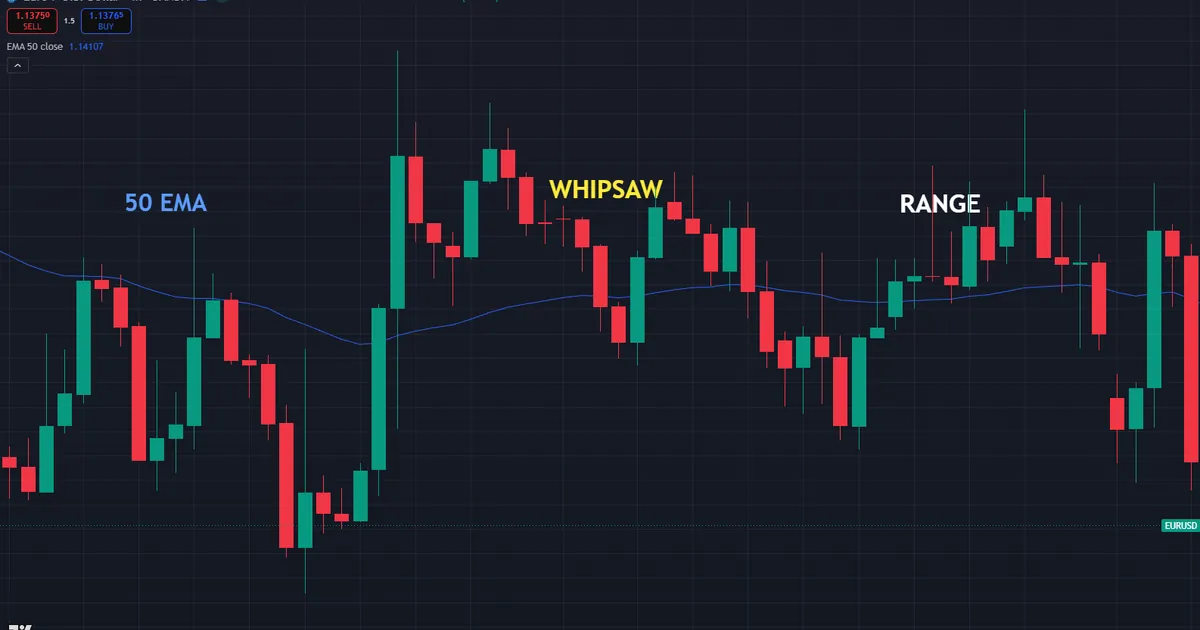
So what went wrong? A moving average only works as support in a trend, and this market had none. In a flat range, the line sits in the middle of the noise and gives false signal after false signal. Hence the guard that saves an account, which is to demand a clear trend before you trust an average at all. A line with no trend behind it simply tracks the chop.
The Range Trap
See the deeper lesson in that whipsaw. A moving average assumes a trend exists, and it has nothing useful to say when one does not. So the same tool that shines in a clean run becomes a liability in a box. Read the wider structure first, and only reach for the average once a real trend has taken hold.
Lag During Fast Reversals
Respect the delay when a trend snaps. Because the average looks backward, it keeps pointing the old way for several bars after a sharp reversal. So a trader leaning only on the line can stay long well into a new downtrend. Confirm turns with structure, and treat a violent reversal as a reason to trust price over the lagging line.
Keep a Trade Log
Be systematic about which settings actually help you. Because every trader favors a slightly different length and type, a written record beats memory every time. So note each average setup and its outcome in a trade journal, then let the data refine your own defaults over months.
Related Concepts to Study Next
Moving averages connect to a web of sibling tools, and a few ideas deserve your next reading hour. A trend line still needs a strength check, which is where a directional gauge earns its place beside it. The choice between a simple and an exponential average also shapes every entry, so weigh the two carefully. Both partners appear in the sections above, ready to sharpen the read that a single line gives you.
For broader context, the trend indicators archive frames the same direction question through other lenses, from channels to slope tools. Charting speeds the work, yet the logic above still carries the trade. So master the moving-average read first on your own, and then let any indicator on the chart simply plot the trend that you already know exactly how to follow and trade around.
FAQ
What is a moving average in trading?
A moving average is the average price over a set number of bars, updated on every new candle. It smooths the jagged price line into one flowing curve, so the underlying trend stands out. The line confirms the direction of a move rather than predicting it in advance.
What is the difference between SMA and EMA?
The SMA weights every bar in the period equally, so it is smooth but slow. An EMA weights recent bars more heavily, so it reacts faster with less lag. In practice, the SMA suits calm, higher timeframes, while the EMA suits quicker charts.
What is a good moving average length?
Short lengths like 20 track fast swings for day trading, while long lengths like 200 map the big trend for position trading. Many traders plot two or three at once. Start with common values and adjust one variable at a time.
What is a golden cross?
A golden cross happens when a faster average, often the 50, crosses above a slower one, often the 200. It signals a shift toward an uptrend in the larger picture. The reverse crossing, a 50 falling below a 200, is called a death cross and points the other way.
Can a moving average predict price?
No, a moving average lags because it looks backward over past bars. It confirms a trend already in motion rather than forecasting the next move. So pair it with structure or a momentum tool before you enter a trade.
Do moving averages work in a range?
No, moving averages struggle in flat, directionless markets. The line sits in the middle of the noise and fires false signals as price chops across it. Demand a clear trend first, and manage risk on every trade. Results are not guaranteed; past performance is not indicative of future results.
External references
- For background on this concept, see Exponential Moving Average (EMA) at Corporate Finance Institute.
- For broader market context, see Moving Average at BabyPips.

About the author
Written by Dominic Walsh, a Forex trader and MT4/MT5 indicator, Expert Advisor and script developer. Every tool on forexmt4systems.com is tested on live charts before release and ships with ready-to-use compiled MT4 (.ex4) and MT5 (.ex5) files. Learn more about the trader and developer behind this site.
How we build, test and correct every tool: Editorial & Testing Policy. Trading carries risk; see the disclaimer.