
If you have ever wondered what is ADX indicator good for, the short answer is trend strength. The Average Directional Index puts a single number on how strong a move is, so you can tell a real trend from aimless chop before you risk a cent.
This guide explains what is ADX indicator, how the reading is built, and how the +DI and -DI lines name the side. So by the end, you will read the three lines together, judge whether a trend deserves a trade, and step aside when the market is only drifting.
What Is the ADX Indicator?
The Average Directional Index is a trend-strength tool built by J. Welles Wilder in 1978. He introduced it in the same book that gave traders the RSI and the ATR. So it comes from a toolkit that still anchors technical trading today.
ADX answers one question. How strong is the current trend, up or down? A high reading means a firm, one-way move. A low reading means a flat, range-bound market with no clear push.
One point matters most. The ADX line itself is not directional. It never tells you whether price is rising or falling, only how much force sits behind the move. So a strong downtrend and a strong uptrend can print the very same ADX value.
Direction comes from two partner lines instead. The +DI line tracks upward pressure, and the -DI line tracks downward pressure. So when +DI sits above -DI, buyers lead, and when -DI sits above +DI, sellers lead. The ADX then rates how convincing that lead really is.
Strength Versus Direction
Keep these two ideas apart in your head. Strength is how hard price is pushing, and direction is which way it points. So the ADX owns the first job, while the DI pair owns the second. Many losing trades trace back to blurring the two.
Think of it like a car. The ADX reads the speed, not the road. A fast car can head north or south, yet the speedometer looks the same either way. So a trader who mistakes a high ADX for a buy signal reads the speedometer and forgets to check the map.
This split is also why the ADX pairs so cleanly with other tools. Because it never argues about direction, it sits happily beside a moving average or a structure read. So the two never contradict each other, and each does the single job it was built for.
Look at a concrete case. The chart shows GBPUSD on the daily timeframe with the full ADX indicator in a lower pane. As price breaks into a clean trend, the ADX line climbs above 25 while +DI pulls clear of -DI. That combination is a trend worth respecting.

Now trace the reading from left to right. First the ADX sits under 20 while price drifts sideways. Then a breakout fires, the ADX turns up, and it pushes through 25 as the candles line up. Because the move gained force, the strength gauge rose with it.
Why the Filter Matters
Why does this matter for real trades? A trend tool works beautifully in a trend and terribly in a range. So the ADX acts as a filter, telling you which environment you are in before you pick a strategy to match it.
Consider how much that saves you. Most trend systems bleed slowly in sideways markets, giving back in chop what they earn in runs. Because the ADX flags a range early, it steers you away from the setups most likely to fail. So the tool earns its keep as much by the trades it blocks as the trades it approves.
How the ADX Reading Is Built
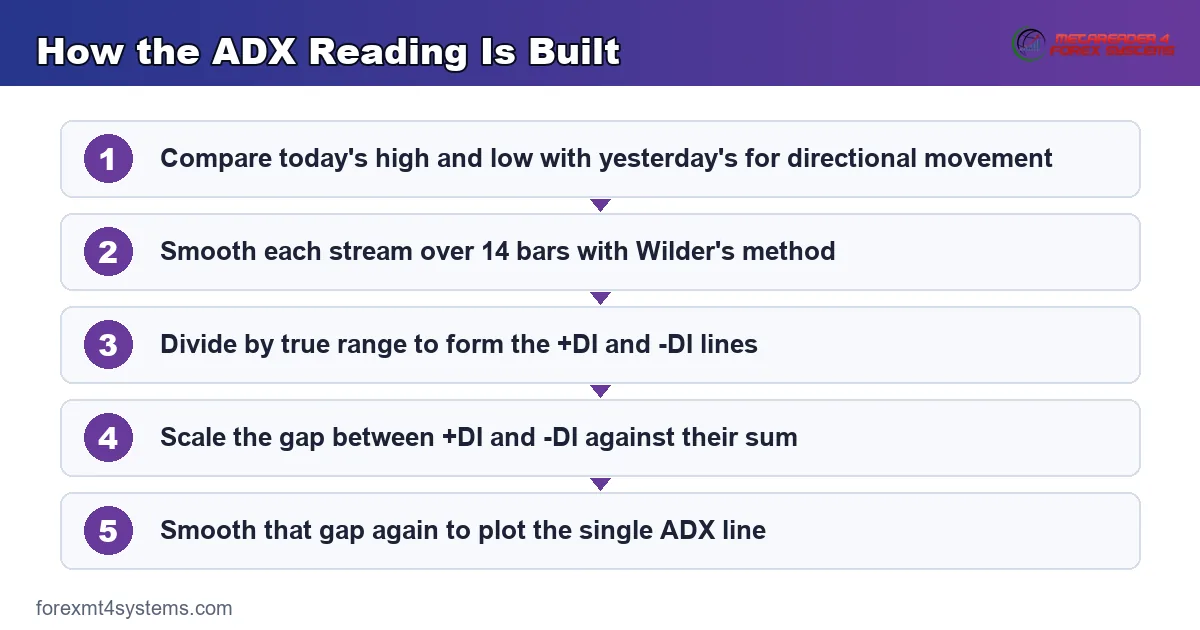
The math has a few steps, so learn the logic once and let the platform do the arithmetic. The reading grows out of directional movement.
- Directional movement. Compare today’s high and low with yesterday’s. A higher high gives positive movement, and a lower low gives negative movement.
- Smooth over 14 bars. Average each stream with Wilder’s method, which fades old bars gradually rather than dropping them at once.
- Build the DI lines. Divide each smoothed movement by the true range to get +DI and -DI as percentages of travel.
- Measure the gap. Take the difference between +DI and -DI, then scale it against their sum. A wide gap means one side dominates.
- Smooth again for ADX. Average that gap over 14 bars, and the result is the single ADX line that rates trend strength.
So the ADX is really a smoothed measure of how far apart the two directional lines stay. The concept graphic below shows the three lines and the zones that guide a read.
One detail helps here. Wilder’s double smoothing makes the ADX slow but steady. Because the line lags on purpose, it filters out single-bar noise and only rises when strength truly builds. So you trade a confirmed trend rather than a one-candle head fake.
Notice why the standard length is 14. Wilder set that period as a balance between speed and stability, and it still suits most charts. A shorter length reacts faster yet whipsaws more, while a longer one calms the line but arrives late. So start at 14 and change it only with a reason.
Reading the ADX Value
The number runs from 0 to 100, though most markets rarely climb past 60. The zones matter more than any exact figure. So learn the three bands and you can read any ADX pane at a glance.
Below 20, treat the market as rangebound. There the trend is weak or absent, and trend entries tend to fail. Above 25, a trend is in force and worth trading in its direction. Between 20 and 25 sits a gray zone where strength is still deciding.
Some traders add a fourth band above 40. There the trend is very strong, though such readings rarely last long. Because extreme strength often marks a late stage, that top band calls for managing an open winner rather than chasing a fresh entry. So the highest values warn as much as they invite.
Watch the slope as much as the level. A rising ADX shows a trend gathering force, whichever way price points. Meanwhile a falling ADX warns that the current move is tiring, even if the value still reads high. So the direction of the line often signals a shift before the level confirms it.
How ADX Fits a Trading Workflow
ADX works best as a filter, not a trigger. It tells you when to trust a trend method and when to switch to a range plan instead.
Use it in a clear order. First read the ADX to judge the environment. Then, if the value sits above 25, look for entries in the direction the DI lines name. Because the filter runs first, you skip the trend setups that a flat market would punish.
Pair ADX with a directional tool for the actual entry. A moving average or a structure read confirms the side, and our guide to moving averages explained covers that partner in depth. So ADX rates the strength while the average names the trend to trade.
Respect the timeframe you work on. A daily ADX rates the daily trend, and a five-minute ADX rates a scalp. Because strength differs hugely between windows, read the ADX on the same chart you trade rather than a larger one. The trend indicators archive plots the whole family automatically if you want it on every chart.
Combining ADX With Volatility
Strength and volatility answer different questions, so they team up well. ADX rates how one-way a move is, while a volatility read like the ATR rates how far each bar travels. So together they size both the conviction and the risk of a setup.
Build the pairing into your plan. A high ADX argues for a trend entry, and the current ATR then sets a stop that respects real movement. Our guide to what is ATR in trading shows that stop math, and our free position size calculator turns the stop into a size in seconds. So the two tools cover strength and risk without any overlap.
Keep the two roles clean in your routine. First the ADX decides whether a trend even exists. Then the ATR decides how much room to give the trade. So one tool answers whether to play, and the other answers how much to risk. That division keeps a plan simple under pressure, when clear rules matter most.
Worked Example: A GBPUSD Trend Trade
Picture a long setup on GBPUSD forming on the four-hour chart near 1.34. Price has just broken out of a tight range, and the ADX line has turned up through 25. The +DI line sits well above -DI, so buyers clearly lead.
Now read the three lines as a group. A rising ADX confirms the breakout has force, and the +DI lead names the upside. So both strength and side agree at once. The chart below marks the ADX cross above 25 and the entry that follows it.

Then build the risk plan around the move. A stop sits below the breakout base, near 1.335, where the range low would invalidate the idea. Because the ADX confirmed strength, the trade has room to run rather than stall in chop. So the reward-to-risk ratio starts in a healthy place.
Managing the Open Trade
Watch the DI lines while the trade breathes. As long as +DI keeps its lead, the buyers stay in control and the idea holds. If -DI creeps up toward +DI, that lead is fading and the trend may be losing grip. So the crossover of the two lines becomes a live warning bell, not just an entry cue.
Notice how the strength read shapes the target too. A firm, rising ADX supports a wider target, since a strong trend tends to travel. Meanwhile a barely-there reading argues for a quick, modest goal. So the same number that filtered the entry also scales how far you let the winner run.
The follow-through rewarded the read. Price pushed toward 1.35 while the ADX held above 25 and kept climbing. As long as +DI stayed above -DI and the ADX slope pointed up, the trend deserved the position. So the exit waited for the ADX to roll over, not for a single red candle.
Contrast a range trader on the same chart. Someone fading every push would have been run over the moment the ADX cleared 25. Because the filter flagged a real trend, the trend follower pressed while the range trader stood aside. So one number sorted two very different plans.
Download the complete indicator database
Put these concepts on your charts. One email unlocks the full library of 1,380+ indicators with compiled MT4 and MT5 files, plus my TradingView scripts. No paywall, no spam, unsubscribe any time.
Get free access to my indicator database
One email unlocks 1,380+ free MT4, MT5 and TradingView indicators — the complete library. No single-tool download; you get the whole database.
Common ADX Mistakes and How to Fix Them
The tool is simple, yet the same errors repeat across every market. Most come from asking the ADX line for direction it cannot give, and the fixes follow beneath the graphic.

Reading ADX as a Direction Signal
A rising ADX shows strength, not a coming rally. Traders who buy on a high reading confuse force with side. So always let the DI lines or a separate trend tool name the direction before you act.
Trading Trends in the Gray Zone
An ADX stuck between 20 and 25 is still deciding. Entries there often stall as the market chops. Instead, wait for a clean push above 25 before you trust a trend setup, and treat the gray zone as a reason to sit on your hands.
Ignoring the DI Crossover
Some traders watch only the ADX line and miss the DI cross that flags a side change. A -DI climbing above +DI warns that sellers are taking over. So track both directional lines, not just the strength gauge, when you judge a turn.
Chasing a Very High ADX
An ADX above 50 feels like a green light, yet extreme readings often mark exhaustion. Late entries there buy the end of a move. So treat a very high, flattening ADX as a warning to protect profit rather than pile in.
Using ADX Alone in a Range
A low ADX means the tool has little to say, and forcing trend trades there bleeds an account. Ranges call for a different plan entirely. So when the ADX sits under 20, switch to range tactics or simply wait for strength to return.
Pre-Trade ADX Checklist
Run this short list before every trend entry. A few seconds here saves hours of regret later. So keep it in view, tick each item honestly, and let a missing check talk you out of a marginal trade.
- ADX reading above 25 on your working timeframe.
- ADX slope pointing up, not rolling over.
- DI lines confirming the side, with the lead line matching your bias.
- A directional tool, such as a moving average, agreeing with the DI read.
- Stop placed beyond structure, sized by current volatility.
- Risk fixed as a small percent of the account.
- No very high, flattening ADX that hints at exhaustion.
When the ADX Misleads
Study the failure case as hard as the winner. Here is a common one. A trader sees the ADX push above 25 on EURUSD near 1.14 and buys the breakout, sure a trend has begun. Every reading looks strong.
Then the move stalls at once. Price stalls, reverses, and the breakout turns into a false start, while the ADX slips back under 20. The chart below shows that failed push, with the brief ADX spike and the fade that followed.

So what went wrong? ADX lags by design, so it can confirm strength right as a move runs out of room. A late breakout that clears 25 may already be near its end. Hence the guard that limits the damage, which is a stop beyond structure that closes the trade when the breakout fails. Strength that has just peaked never shows its exhaustion in the value alone.
Then respect the whipsaw risk in choppy markets. In a wide, directionless box, the ADX can flicker around 20 to 25 and fire false trend flags. Because those signals lead nowhere, demand a clean structure break alongside the reading. A wider band tool can frame that box, and our guide to the parabolic SAR shows a trailing partner that exits a stall early.
Watch out for the timeframe trap as well. A strong daily ADX can hide a messy, rangebound hour chart underneath it. So a scalper who borrows the higher-timeframe reading may trade a trend that simply is not there on the chart in front of them. Read the strength on the exact window you enter, and let each timeframe speak for itself.
Lag Cuts Both Ways
Be honest about the built-in delay. The ADX reacts to strength after it appears, not before. So the line is often low as a trend begins and high as it ends. Treat a fresh climb through 25 as a genuine signal, yet treat a long, high plateau as a reason for caution rather than confidence.
Keep a Trade Log
Be systematic about what actually works for you. Because every trader reads the gray zone a little differently, a written record beats memory every time. So note each ADX read and its outcome in a trade journal, then let the data refine your own threshold over months.
Related Concepts to Study Next
ADX connects to a web of sibling tools, and a few ideas deserve your next reading hour. A strength filter still needs a direction, which is where a trend average earns its place beside it. The choice of stop also shapes every trade, so a volatility read belongs in the plan too. Both partners appear in the pairing section above, ready to fill the gaps the ADX leaves open.
For hands-free charting, the momentum indicators archive plots the DI lines and their cousins automatically. Tools speed the work, yet the logic above still carries the trade. So master the strength read first on your own, and then let any indicator on the chart simply plot the trend force that you already know exactly how to judge and act on.
FAQ
What does the ADX indicator measure?
The ADX measures trend strength, not direction. A reading above 25 points to a strong trend, and a reading below 20 points to a weak or rangebound market. The +DI and -DI lines then name which side leads.
What is a good ADX setting?
The 14-period ADX that Wilder designed suits most charts and timeframes. A shorter length reacts faster but whipsaws more, while a longer one calms the line yet arrives late. Start at 14 and change one variable at a time, then test the result over many trades before you keep it.
What ADX level shows a strong trend?
A reading above 25 signals a trend worth trading, and a rising line adds conviction. Below 20 marks a range where trend entries tend to fail. The zone between 20 and 25 is a gray area where strength is still deciding, so many traders simply wait it out.
Can the ADX tell me which way price will move?
No, the ADX line alone is not directional. It rates how strong a move is, not whether price rises or falls. So read the +DI and -DI lines, or a separate trend tool, to name the side before you enter.
How do I trade with the +DI and -DI lines?
Buy bias appears when +DI sits above -DI, and sell bias appears when -DI sits above +DI. A crossover flags a possible side change, and a rising ADX confirms the move has force. Combine both reads before you commit, since either one alone can mislead.
Is the ADX reliable in a ranging market?
No, the ADX has little to say when it sits below 20. Forcing trend trades in that flat zone tends to bleed an account. Switch to range tactics or wait for strength to return, and manage risk on every trade. Results are not guaranteed; past performance is not indicative of future results.
External references
- For background on this concept, see Average Directional Index (ADX) at Corporate Finance Institute.
- For broader market context, see Average Directional Index (ADX) at BabyPips.

About the author
Written by Dominic Walsh, a Forex trader and MT4/MT5 indicator, Expert Advisor and script developer. Every tool on forexmt4systems.com is tested on live charts before release and ships with ready-to-use compiled MT4 (.ex4) and MT5 (.ex5) files. Learn more about the trader and developer behind this site.
How we build, test and correct every tool: Editorial & Testing Policy. Trading carries risk; see the disclaimer.